
We recently started a series called “Penny Stock of the Day”. These ideas are geared towards traders with an extremely high risk appetite.
Our Penny Stock of the Day is chosen by screening for stocks under $5 and then applying technical analysis on the shortlisted set of penny stocks showing unusual volume. When making these trades, please make sure to pay vigilant attention to pricing moves and have a strict stop loss in place to avoid significant losses.
Penny Stock of the Day: Red Cat Holdings, Inc. (NASDAQ: RCAT)
Today’s penny stock pick is the aircraft company, Red Cat Holdings, Inc. (NASDAQ: RCAT).
Red Cat Holdings, Inc. engages in the provision of various products, services, and solutions to the drone industry. The company operates through two segments: Enterprise and Consumer. It built infrastructure to manages drone fleets and fly, and provide services remotely, navigates confined industrial interior spaces and dangerous military environments.
Website: https://www.redcatholdings.com
Latest 10-k report: https://ir.redcatholdings.com/sec-filings/all-sec-filings/content/0001554795-23-000231/0001554795-23-000231.pdf
Analyst Consensus: Not Covered By Wall Street Analysts.
Potential Catalysts / Reasons for the Hype:
- The company announced a strategic partnership with Ocean Power Technologies, Inc. (NASDAQ: OPTT). This collaboration looks to enhance maritime surveillance and defense capabilities through the integration of Teal 2 Drones with OPT’s innovative marine power, data, and service solutions.
- RCAT also has partnerships with Reveal Technology, Tomahawk Robotics, Athena AI, and Immervision.
On analyzing the company’s stock charts, there seem to be multiple bullish indications…
Bullish Indications
#1 Symmetrical Triangle Pattern Breakout: The daily chart shows that the stock has currently broken out a symmetrical triangle pattern, which is marked as purple color lines. A symmetrical triangle pattern represents a period of consolidation before the price breaks out. This is typically formed when there is indecision in the price movements and uncertainty among the buyers and sellers. Once a breakout from the upper trend line occurs, it usually signifies the start of a new bullish trend.
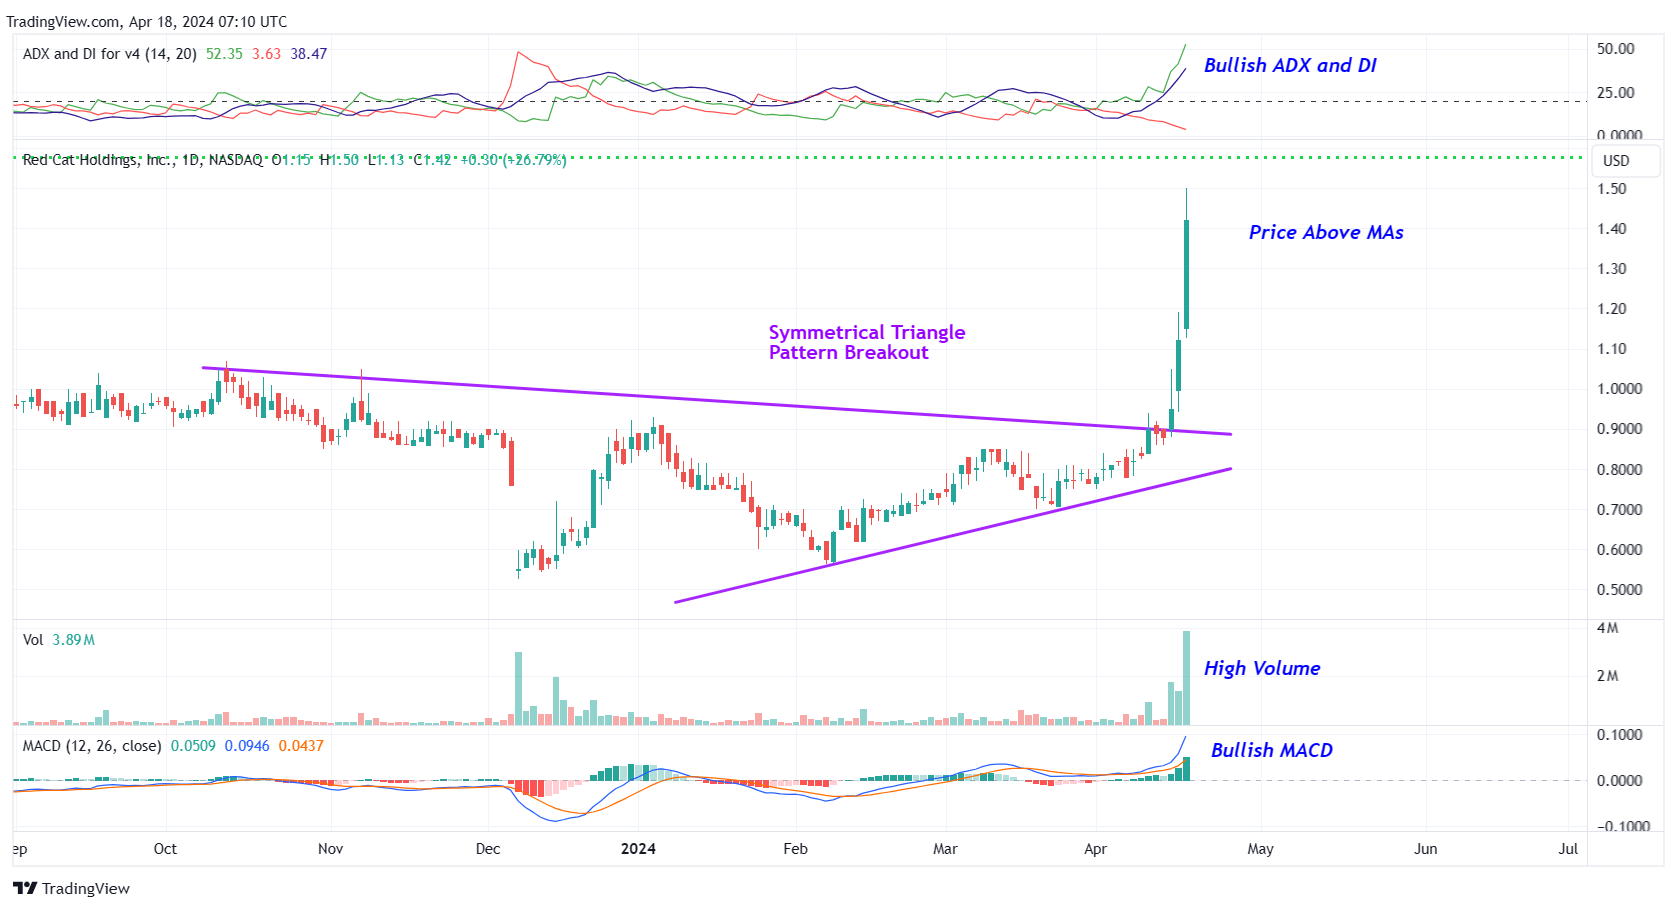
RCAT – Daily Chart
#2 Bullish ADX and DI: The ADX indicator shows bullishness as the +DI line is above the -DI line, and the ADX line is currently moving higher from below the +DI and -DI lines.
#3 Price above MAs: The stock is currently above its 50-day as well as 200-day SMA, indicating that the bulls have currently gained control.
#4 MACD above Signal Line: In the daily chart, the MACD (light blue color) is currently above the MACD signal line (orange color). This indicates a possible bullish setup.
#5 Consolidation Area: The weekly chart shows that the stock has been consolidating within a price range for the past few weeks. This is marked as a pink color rectangle. Once the stock breaks out of the consolidation area, it could surge higher. The breakout level of the consolidation area typically acts as a good support level. The stock is also trading above its 50-week SMA, indicating that the bulls are gaining control.
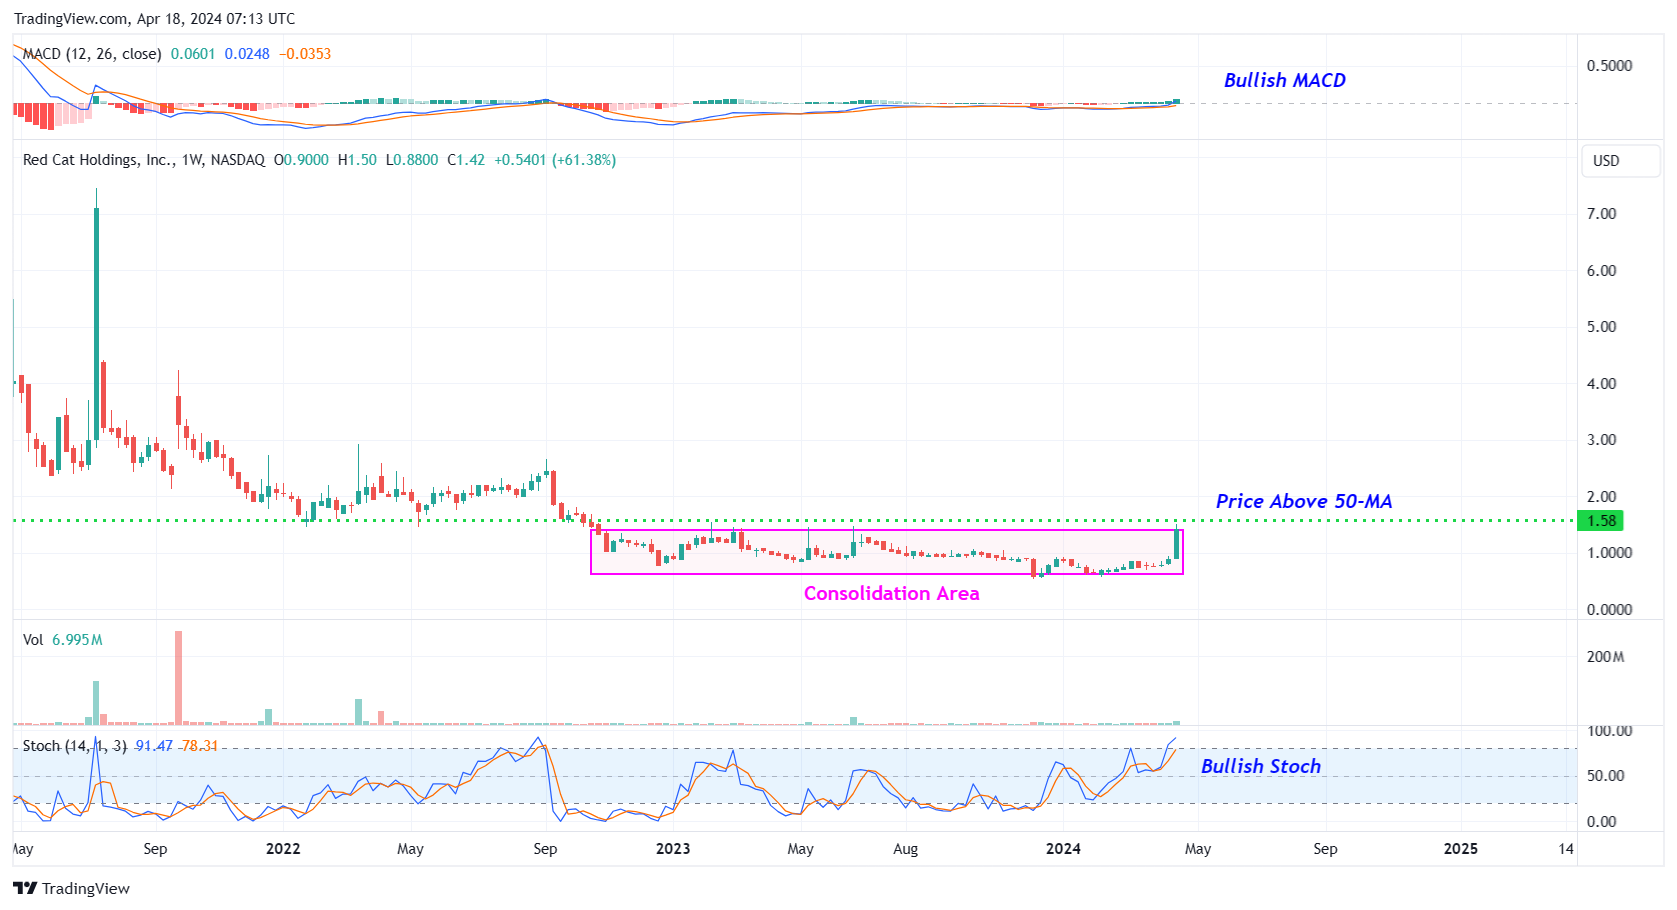
RCAT – Weekly Chart
#6 Bullish Stoch: The %K line is above the %D line of the stochastic in the weekly chart, indicating possible bullishness.
#7 MACD above Signal Line: In the weekly chart as well, the MACD (light blue color) is currently above the MACD signal line (orange color). This indicates a possible bullish setup.
Recommended Trade (based on the charts)
Buy Levels: If you want to get in on this trade, the ideal buy level for RCAT is above the price of $1.60.
Target Prices: Our first target is $2.80. If it closes above that level, the second target price is $3.80.
Stop Loss: To limit risk, place a stop loss at $0.88. Note that the stop loss is on a closing basis.
Our target potential upside is 75% to 138%.
For a risk of $0.72, our first target reward is $1.20, and the second target reward is $2.20. This is a nearly 1:2 and 1:3 risk-reward trade.
In other words, this trade offers 2x to 3x more potential upside than downside.
Potential Risks / Red Flags:
- The company has a history of net losses and reported an accumulated deficit of almost $55 million on April 30, 2023.
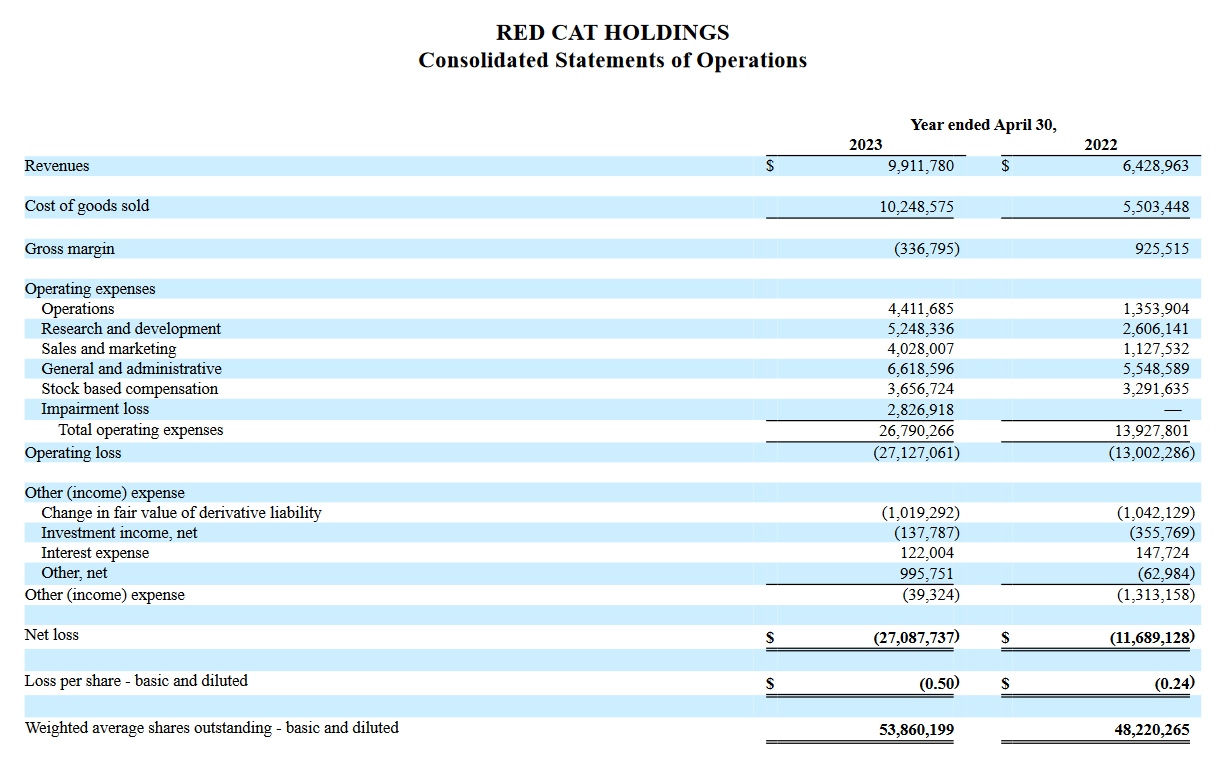
RCAT – Consolidated Statements of Operations
- The company has a pending legal matter, which is an action filed against Teal Drones and RCAT in a U.S. District Court in California. The complaint asserts claims for breach of contract, and the unlawful conversion and sale of shares of common stock that the plaintiff alleges to have purchased in Teal prior to its acquisition by the Company.
- During the fiscal year ending April 30, 2022, RCAT acquired Skypersonic and Teal Drones. The company’s other businesses include Rotor Riot and Fat Shark. Historically, only Fat Shark has reported profits and it was not profitable in fiscal 2022 or 2023. There can be no assurance that any of RCAT’s operating businesses will reach profitability in the future.
- The drone industry is highly competitive, especially with the entry of larger companies that have substantially greater resources. Moreover, lack of long-term purchase orders and purchase commitments may result in a rapid decline in the company’s sales.
- Despite being a loss-making company, the executives are being paid significant compensation.
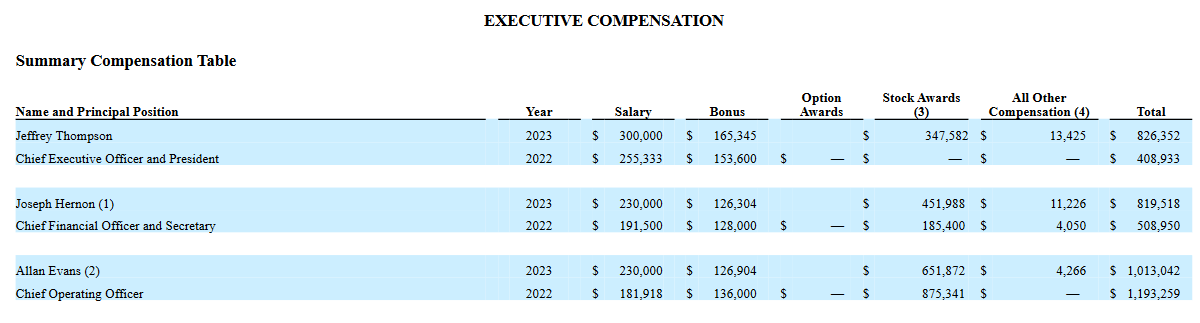
RCAT – Executive Compensation
As you can see, today’s featured penny stock offers big upside potential… but it also comes with a number of risks and red flags. As always, when dealing with penny stocks, we advise caution before entering into such high-risk ventures. Remember to think before you trade… understand the risks… and if you decide to trade, stick to your stop-losses!
Happy Trading!
Trades of the Day Research Team
READ BEFORE TRADING PENNY STOCKS: The allure of penny stocks lies in their potential to deliver massive gains in a short period of time. However, in exchange for that opportunity, most penny stocks carry tremendous risk. They can be extremely volatile and are susceptible to “pump and dump” schemes and fraud.
Unlike regular stocks, the financial condition of most penny stock companies can be extremely difficult to analyze, as the majority of such stocks are traded on over-the-counter (OTC) exchanges, which are typically less transparent and less regulated than the major exchanges. In fact, in the penny stock space, it’s often easier to spot warning signs and red flags than it is to identify a sound investment. Nevertheless, we do our best to identify short-term trade opportunities in this exciting space because we know some of our readers are looking for high-risk, high-reward ideas. We just urge you to make sure you fully understand the risks before making any of these trades.
If you're buying rare earth or other critical mineral stocks, you're already one step behind - because we believe that political insiders in Washington are preparing to buy a whole new group of stocks, which could begin soaring 500%+ just days from now. The man once ranked in 2020 as America's #1 stock picker is doing something extraordinary and giving away the name and ticker of every single stock that could be next. Everything you need to know is here.
Source: Trades of the Day
