
Capitalism is awesome.
It’s lifted countless people out of poverty, improved the broad productivity of humanity, and radically advanced society.
This has happened in a largely passive way for most people.
However, actively participating in capitalism can lead to even more awesome results.
That can occur via investing.
Regular people (like you and I) can use investing to profit from the immense power of capitalism.
Now, there are a lot of ways to invest.
But I’d argue that dividend growth investing is the best way of all.
This is a long-term strategy whereby one buys and holds shares in high-quality businesses that pay safe, growing dividends to shareholders.
 Those safe, growing dividends are usually funded by consistent and growing profits.
And those consistent, growing profits are produced by selling the products and/or services the world demands.
Makes sense, right?
Well, you can find hundreds of examples of what I’m talking about by taking a look at the Dividend Champions, Contenders, and Challengers list.
This list has rich data on US-listed stocks that have raised dividends each year for at least the last five consecutive years.
I’ve been using this strategy for myself for more than a decade now.
It’s helped me to build the FIRE Fund.
That’s my real-life, real-money portfolio, and it generates enough five-figure passive dividend income for me to live off of.
I’ve actually been in the extremely fortunate position of being able to live off of dividend income for about a decade, and I was even able to retire in my early 30s.
How?
My Early Retirement Blueprint explains.
A large part of my success comes down to investing in the right businesses at the right valuations.
After all, price is only what you pay, but value is what you ultimately get.
An undervalued dividend growth stock should provide a higher yield, greater long-term total return potential, and reduced risk.
 This is relative to what the same stock might otherwise provide if it were fairly valued or overvalued.
Price and yield are inversely correlated. All else equal, a lower price will result in a higher yield.
That higher yield correlates to greater long-term total return potential.
This is because total return is simply the total income earned from an investment – capital gain plus investment income – over a period of time.
Prospective investment income is boosted by the higher yield.
But capital gain is also given a possible boost via the “upside” between a lower price paid and higher estimated intrinsic value.
And that’s on top of whatever capital gain would ordinarily come about as a quality company naturally becomes worth more over time.
 These dynamics should reduce risk.
Undervaluation introduces a margin of safety.
This is a “buffer” that protects the investor against unforeseen issues that could detrimentally lessen a company’s fair value.
It’s protection against the possible downside.
Actively participating in capitalism by buying undervalued high-quality dividend growth stocks can supercharge how positively and powerfully capitalism will affect your life.
Of course, all of this does presuppose that one has a basic understanding of valuation.
If you don’t already have that, don’t be too concerned.
Fellow contributor Dave Van Knapp penned Lesson 11: Valuation in order to help with this.
Part of an overarching series of dividend growth investing “lessons”, it spells out valuation in simple terms and even provides an easy-to-follow valuation template that can be used to estimate the fair value of just about any dividend growth stock out there.
With all of this in mind, let’s take a look at a high-quality dividend growth stock that appears to be undervalued right now…
 Magna International Inc. (MGA)
Magna International Inc. (MGA) is a multinational mobility solutions and technology company for automakers that designs, develops, and manufactures automotive systems, assemblies, modules, and components.
Founded in 1957, Magna is now a $15 billion (by market cap) major manufacturer that employs nearly 180,000 people.
FY 2023 revenue can be broken down by product category: Body Exteriors & Structures, 41%; Power & Vision, 33%; Seating Systems, 14%; and Complete Vehicles, 13%.
The small Corporate & Other segment reconciles the remainder.
Based out of Canada, Magna is one of the world’s largest manufacturers of OEM components for various automakers.
Magna is not only large but also incredibly broad.
In fact, the company is so broad, it could go and manufacture complete vehicles all by itself.
This passage by Morningstar highlights this rare supplier ability: “Many suppliers focus on a particular area of the vehicle. In sharp contrast, Magna’s capabilities are so broad that the firm could nearly design, develop, supply, and assemble vehicles all on its own.”
Vehicles are becoming increasingly complex – EV/hybrid offerings, additional tech content, and even some self-driving features.
That bodes well for Magna.
OEMs must partner with suppliers that can capably handle this level of manufacturing.
Well, Magna sits at the top of that totem pole.
And once Magna is “in” and producing at a high level, there’s a “stickiness” there.
Why would an OEM switch to a less capable supplier?
With Magna’s scale and expertise positioning the firm to take advantage of the rising complexity of vehicles and manufacturing, revenue, profit, and the dividend should all continue to rise over the coming years.
Dividend Growth, Growth Rate, Payout Ratio and Yield
To date, Magna has increased its dividend for 15 consecutive years.
Considering how detrimental pandemic-related shutdowns were to manufacturing, the continuation of the dividend (and the growth of it) straight through that period speaks volumes.
The 10-year dividend growth rate is 11.1%, although recent dividend raises have (understandably) been much more muted.
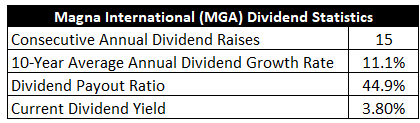 For instance, the last dividend raise was less than 4%.
It’s been a tough stretch for Magna over the last few years, but modest dividend growth during such a difficult time really does show a high level of commitment to shareholders.
On the flip side, to counteract that lower growth, and in order to better reflect the current operating environment, the stock’s yield has risen (via a drop in the stock’s price) to 3.8%.
For perspective, that’s 110 basis points higher than its own five-year average.
Less near-term growth, but more near-term yield (while one waits for the business to fully recover).
Not too bad.
A payout ratio of 44.9% still shows a well-covered dividend – and this number should look even better (i.e., compress and be lower) once earnings fully recover.
One of the knocks against a cyclical business like this is that you just don’t know how it’s going to respond (and cover the dividend) during a downturn.
Well, Magna has shown the world just how resilient it is.
You get utility-like yield here, and double-digit dividend growth could easily return within the next few years.
That’s a strong combination of yield and growth, and the dividend is obviously pretty sacred here.
A lot to like for sure.
Revenue and Earnings Growth
As much as there is to like, though, these dividend metrics are mostly looking backward.
However, investors must always be looking forward, as today’s capital is risked for the rewards of tomorrow.
Thus, I’ll now build out a forward-looking growth trajectory for the business, which will be useful when the time comes later to estimate fair value.
I’ll first show you what the business has done over the last decade in terms of its top-line and bottom-line growth.
I’ll then reveal a professional prognostication for near-term profit growth.
Amalgamating the proven past with a future forecast in this manner should give us what we need to make an educated call on where the business could be going from here.
Magna bumped its revenue from $34.4 billion in FY 2014 to $42.8 billion in FY 2023.
That’s a compound annual growth rate of 2.5%.
Not impressive.
However, this is largely because of temporary pandemic-related shutdowns and the long-lasting effects across the industry (which Magna is now starting to recover from).
Meanwhile, earnings per share moved from $4.34 to $4.23 over this period.
That’s effectively flat bottom-line growth.
Again, this has to be taken with a big grain of salt.
Context is everything.
This is looking at the business in, possibly, its worst possible light.
If we were to back up the 10-year look to before the pandemic and go from FY 2019 back, the 10-year EPS CAGR jumps to 11.6%.
It’s a cyclical business, and points in any particular cycle will impact how good (or bad) the business looks.
Ultimately, when viewing things through a long-term lens and considering the impact of a once-in-a-generation global event, Magna seems capable of (at least) growing the business and dividend at a high-single-digit rate.
Looking forward, CFRA forecasts that Magna will compound its EPS at an annual rate of 22% over the next three years.
So there’s the recovery right there – we go from flattish growth to 22% growth.
That’s a cyclical business for you.
Recent results out of Magna have been extremely promising and back CFRA’s enthusiasm.
For example, the most recent quarter – Q4 FY 2023 – showed 41.5% YOY adjusted EPS growth.
We are clearly in an upswing as Magna moves past recent issues that were largely out of its control.
Now, even if the business does grow this quickly over the next few years, I wouldn’t expect all of that to translate over to the growth of the dividend.
Magna has been “advancing” dividend raises to shareholders over the last few years, even while the business wasn’t fully there this kind of activity.
I suspect management will want to right that ship, hand out somewhat modest dividend raises over the next few years, and get everything back in order.
That said, under regular circumstances, which are nearly upon us, I think Magna is quite capable of producing high-single-digit (or better) revenue, EPS, and dividend growth over longer stretches of time (when averaged out).
And investors looking to buy in now are able to “lock in” a higher-than-average yield (sitting at nearly 4%) before all of that plays out.
That strikes me as a reasonably attractive setup.
Financial Position
Moving over to the balance sheet, Magna has a very good financial position.
The long-term debt/equity ratio is 0.4, while the interest coverage ratio is nearly 8.
That latter number looks worse than it really is, only because of how temporarily depressed results have been.
I’ll note that Magna carries a healthy cash balance that offsets about 1/4 of all long-term debt, and the overall debt load has been relatively stable over the last five or so years.
There’s been a fairly responsible management of the balance sheet, in my view, although I’d certainly prefer something closer to no debt at all.
Profitability is satisfactory, but this is another area of the business that could be improved (while also acknowledging how unusual the last few years have been).
Return on equity has averaged 11% over the last five years, while net margin has averaged 3.2%.
ROE was routinely in the 20% area before the pandemic, which is great, and I’d like to see higher returns on capital return.
Overall, Magna is a premier manufacturer in the auto space.
And the company does have durable competitive advantages that include economies of scale, technological know-how, barriers to entry, and switching costs.
Of course, there are risks to consider.
Competition, regulation, and litigation are omnipresent risks in every industry.
Input costs are highly volatile.
Magna has customer concentration risk: Its six largest customers account for nearly 80% of annual sales.
Demand for auto manufacturing is tied to macroeconomic factors beyond Magna’s control.
There is direct exposure to economic cycles, and that is amplified by the capital-intensive nature of the business model.
Global supply chains are evolving and changing, and this may impact the business in the future.
Constant technological changes in mobility introduce the risk of Magna being left behind.
The company’s international footprint exposes it to geopolitical risks and currency exchange rates.
There are certainly risks to keep in mind, but the leadership and breadth of the business must also be kept in mind.
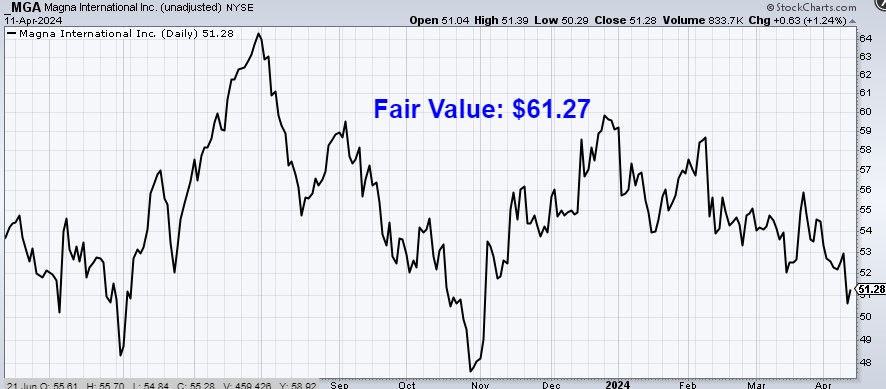
And with the stock down more than 50% from all-time highs, the valuation is something to have at the forefront of one’s mind…
Valuation
The P/E ratio is only 12.
That’s low in any environment, but it’s especially low on a depressed earnings base that’s recovering.
This stock’s own five-year average P/E ratio is 13.3, which in and of itself is quite low (because of lower earnings over the last several years), but we’re below even that.
The sales multiple of 0.3 is shockingly low, and it’s decently off of its own five-year average of 0.5.
And the yield, as noted earlier, is significantly higher than its own recent historical average.
So the stock looks cheap when looking at basic valuation metrics. But how cheap might it be? What would a rational estimate of intrinsic value look like?
I valued shares using a dividend discount model analysis.
I factored in a 10% discount rate and a long-term dividend growth rate of 6.5%.
This number can look aggressive or conservative, depending on how you approach it.
Based on pre-pandemic growth rates of the business and dividend, it’s downright pessimistic.
Also, the near-term projection for EPS growth is about four times higher than this figure.
However, the last few dividend raises have come in at well below this level.
The business has had a tough go of it since 2020, and while a recovery is underway in earnest, I wouldn’t be surprised at all to see management take it easy with the size of dividend raises over the next few years (seeing as how the last few dividend raises weren’t fully justified by business results).
Averaging things out, and erring on the side of caution, I think the business and the dividend can grow at a mid-single-digit rate over the long run.
The DDM analysis gives me a fair value of $57.81.
The reason I use a dividend discount model analysis is because a business is ultimately equal to the sum of all the future cash flow it can provide.
The DDM analysis is a tailored version of the discounted cash flow model analysis, as it simply substitutes dividends and dividend growth for cash flow and growth.
It then discounts those future dividends back to the present day, to account for the time value of money since a dollar tomorrow is not worth the same amount as a dollar today.
I find it to be a fairly accurate way to value dividend growth stocks.
This stock looks noticeably undervalued to my eye.
But we’ll now compare that valuation with where two professional stock analysis firms have come out at.
This adds balance, depth, and perspective to our conclusion.
Morningstar, a leading and well-respected stock analysis firm, rates stocks on a 5-star system.
1 star would mean a stock is substantially overvalued; 5 stars would mean a stock is substantially undervalued. 3 stars would indicate roughly fair value.
Morningstar rates MGA as a 4-star stock, with a fair value estimate of $71.00.
CFRA is another professional analysis firm, and I like to compare my valuation opinion to theirs to see if I’m out of line.
They similarly rate stocks on a 1-5 star scale, with 1 star meaning a stock is a strong sell and 5 stars meaning a stock is a strong buy. 3 stars is a hold.
CFRA rates MGA as a 3-star “HOLD”, with a 12-month target price of $55.00.
I came out close to where CFRA is at on this one. Averaging the three numbers out gives us a final valuation of $61.27, which would indicate the stock is possibly 17% undervalued.
 Bottom line: Magna International Inc. (MGA) is a premier manufacturer, perfectly positioned for increasing complexity in autos. Its breadth is practically peerless. The last few years have been challenging, but the business is in the midst of a substantial upswing. With a market-smashing yield, a reasonable payout ratio, double-digit long-term dividend growth, 15 consecutive years of dividend increases, and the potential that shares are 17% undervalued, dividend growth investors interested in auto exposure ought to seriously consider this idea.
-Jason Fieber
P.S. If you’d like access to my entire six-figure dividend growth stock portfolio, as well as stock trades I make with my own money, I’ve made all of that available exclusively through Patreon.
Note from D&I: How safe is MGA’s dividend? We ran the stock through Simply Safe Dividends, and as we go to press, its Dividend Safety Score is 70. Dividend Safety Scores range from 0 to 100. A score of 50 is average, 75 or higher is excellent, and 25 or lower is weak. With this in mind, MGA’s dividend appears Safe with an unlikely risk of being cut. Learn more about Dividend Safety Scores here.
Source: Dividends & Income
Disclosure: I’m long MGA.
