
Picking a winning trade on a consistent basis is not simply a stroke of luck. It’s the result of calculated screening, planning, and deliberation.
With this in mind, we have started a new weekly series on our top 10 stocks to watch this week — stocks that look poised for a possible breakout in the coming days. Traders should add these stocks to their watchlist now.
The Top 10 Stocks to Watch This Week for Possible Breakouts
| Sl # | Name of the Stock | Stock Ticker | Last Close | Buy Level(s) | Reason |
| 1 | UroGen Pharma Ltd | NASDAQ: URGN | $15.10 | $16.00 | Symmetrical Triangle Pattern |
| 2 | Acadia Realty Trust | NYSE: AKR | $17.10 | $17.40 | Flag Pattern Breakout |
| 3 | Rhythm Pharmaceuticals Inc. | NASDAQ: RYTM | $40.33 | $44.70 | Symmetrical Triangle Pattern |
| 4 | Nurix Therapeutics Inc. | NASDAQ: NRIX | $16.74 | $17.70 | Uptrend Channel |
| 5 | Biomarin Pharmaceutical Inc. | NASDAQ: BMRN | $92.22 | $93.10 | Symmetrical Triangle Pattern Breakout |
| 6 | Vera Therapeutics Inc. | NASDAQ: VERA | $47.97 | $49.20 | Flag Pattern Breakout |
| 7 | Lions Gate Entertainment Corp. | NYSE: LGF.B | $9.99 | $10.10 | Symmetrical Triangle Pattern Breakout |
| 8 | Coupang Inc. | NYSE: CPNG | $21.25 | $21.50 | Ascending Triangle Pattern Breakout |
| 9 | Apple Inc. | NASDAQ: AAPL | $176.55 | $178.80 | Falling Wedge Pattern Breakout |
| 10 | State Street Corp. | NYSE: STT | $75.78 | $78.50 | Symmetrical Triangle Pattern |
Important: Typically, these trades offer a risk: reward ratio of 1:2 or 1:3 in the next 6 months, which implies 2x to 3x rewards when compared to risks. So, be sure to set your stop-loss levels and target prices accordingly to manage your risk. In addition, these trade ideas are triggered using daily closing prices, not intra-day pricing. So, if you participate in these trades, make sure that you only buy the stock once its daily close is above the recommended price level.
That said, here are the top 10 stocks to watch for a breakout, in no particular order.
#1 UroGen Pharma Ltd (NASDAQ: URGN)
Sector: Healthcare • Biotechnology
Reason: Formation of a Symmetrical Triangle Pattern
A symmetrical triangle is a chart pattern formed by two converging trend lines connecting a series of sequential peaks and troughs. These two lines result in the formation of a triangle that appears to be symmetrical.
A symmetrical triangle pattern is usually formed when there is indecision in the price movements and there is uncertainty among the buyers and sellers. This chart pattern represents a period of consolidation before the price breaks out or breaks down. In case a breakout occurs from the upper trend line, it is a strong bullish indication as it signifies the start of a new bullish trend.
Buy Level(s): The ideal buy level for URGN is if the stock has a daily close above the breakout level of the symmetrical triangle pattern, at around $16.00. This is marked in the chart below as a green color dotted line.
Daily chart – URGN
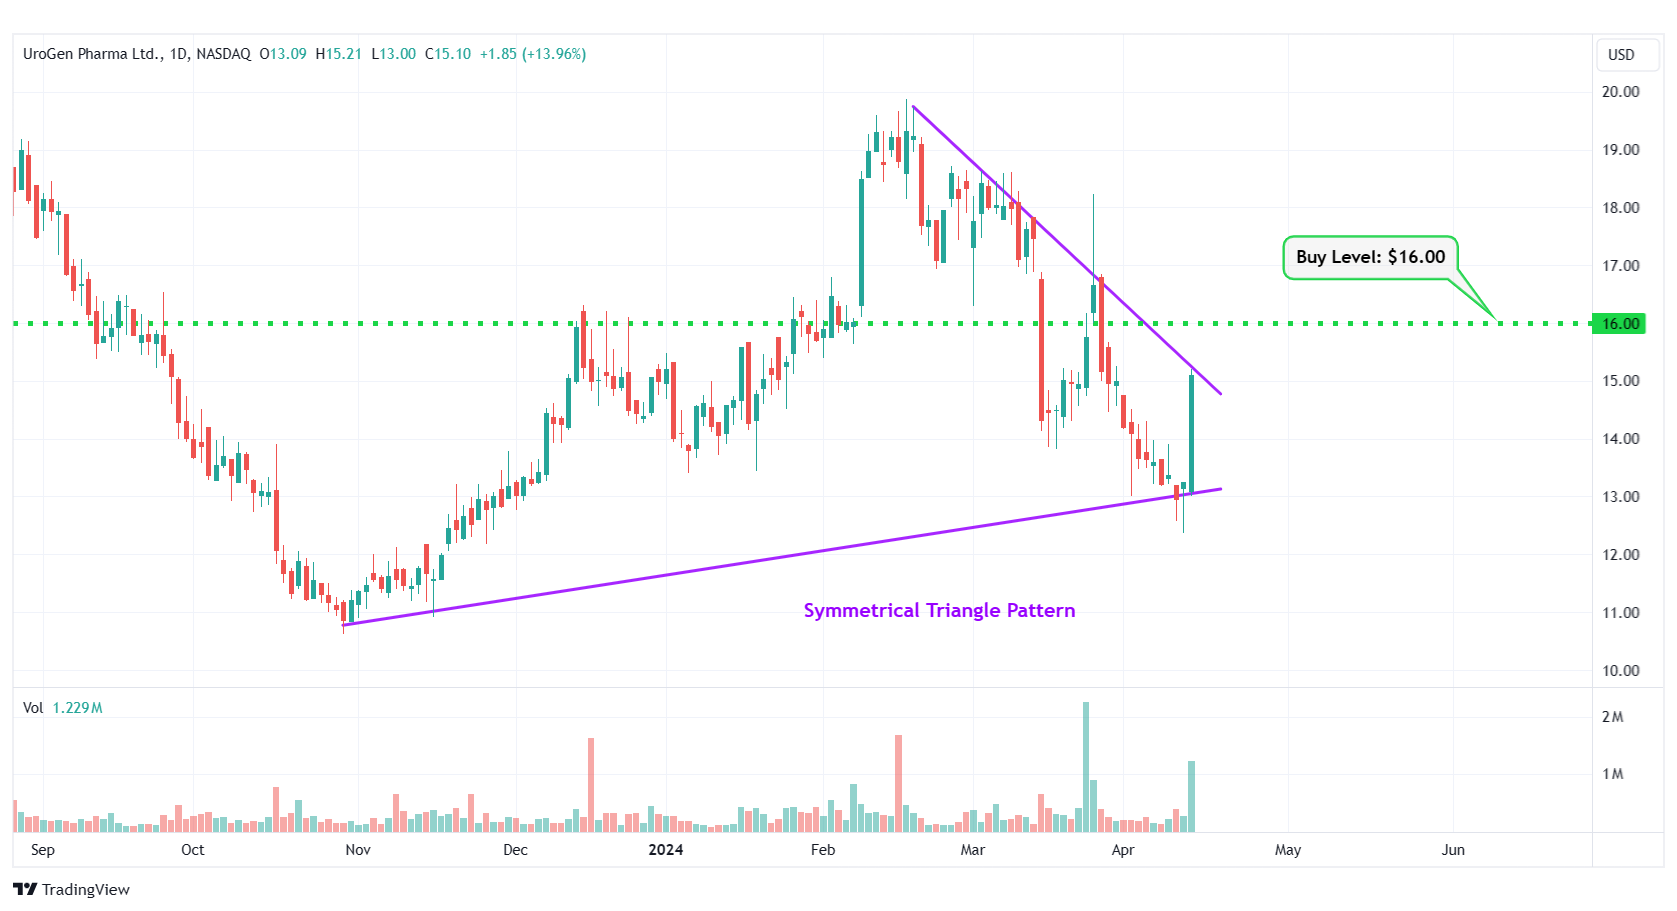
URGN – Symmetrical Triangle Pattern
#2 Acadia Realty Trust (NYSE: AKR)
Sector: Real Estate • REIT – Retail
Reason: Breakout From a Flag Pattern
A flag pattern is a short-term continuation pattern that marks a small consolidation before the previous move resumes. The pattern is formed when the market consolidates in a narrow range after a sharp move. For a stock in an uptrend, a breakout from this pattern is typically a strong bullish indication.
Buy Level(s): Although the stock has currently broken out of the flag pattern, the ideal buy level for AKR is above the near-term resistance level of $17.40. This is marked in the chart below as a green color dotted line.
Daily chart – AKR
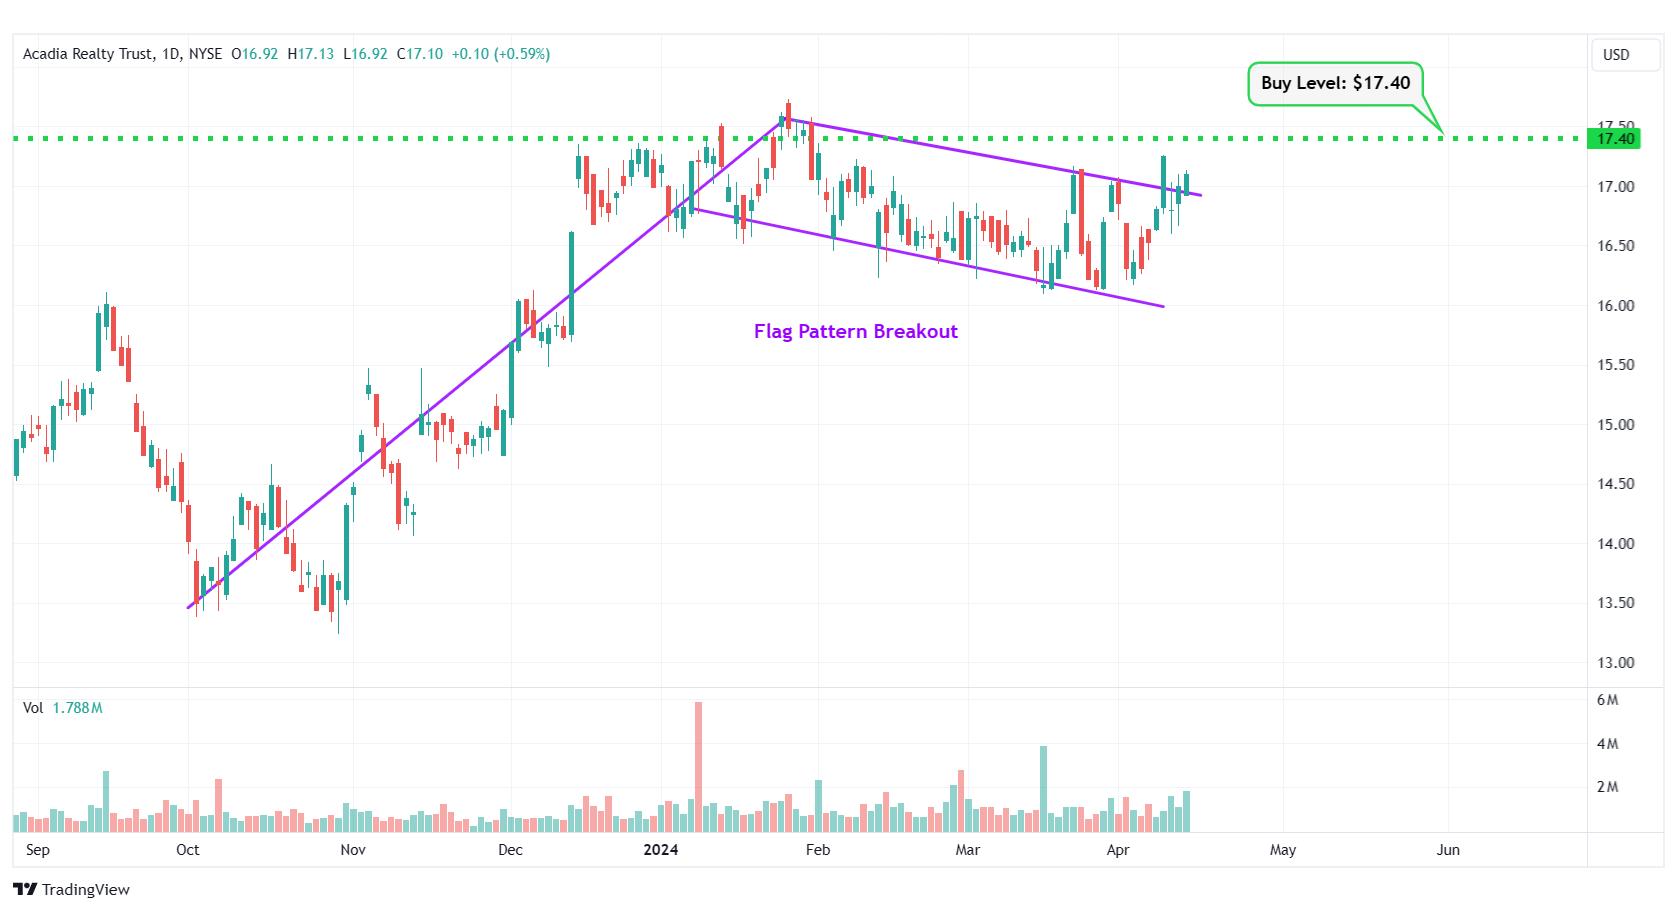
AKR – Flag Pattern Breakout
#3 Rhythm Pharmaceuticals Inc. (NASDAQ: RYTM)
Sector: Healthcare • Biotechnology
Reason: Formation of a Symmetrical Triangle Pattern
A symmetrical triangle is a chart pattern formed by two converging trend lines connecting a series of sequential peaks and troughs. These two lines result in the formation of a triangle that appears to be symmetrical.
A symmetrical triangle pattern is usually formed when there is indecision in the price movements and there is uncertainty among the buyers and sellers. This chart pattern represents a period of consolidation before the price breaks out or breaks down. In case a breakout occurs from the upper trend line, it is a strong bullish indication as it signifies the start of a new bullish trend.
Buy Level(s): The ideal buy level for RYTM is if the stock has a daily close above the breakout level of the symmetrical triangle pattern, at around $44.70. This is marked in the chart below as a green color dotted line.
Daily chart – RYTM
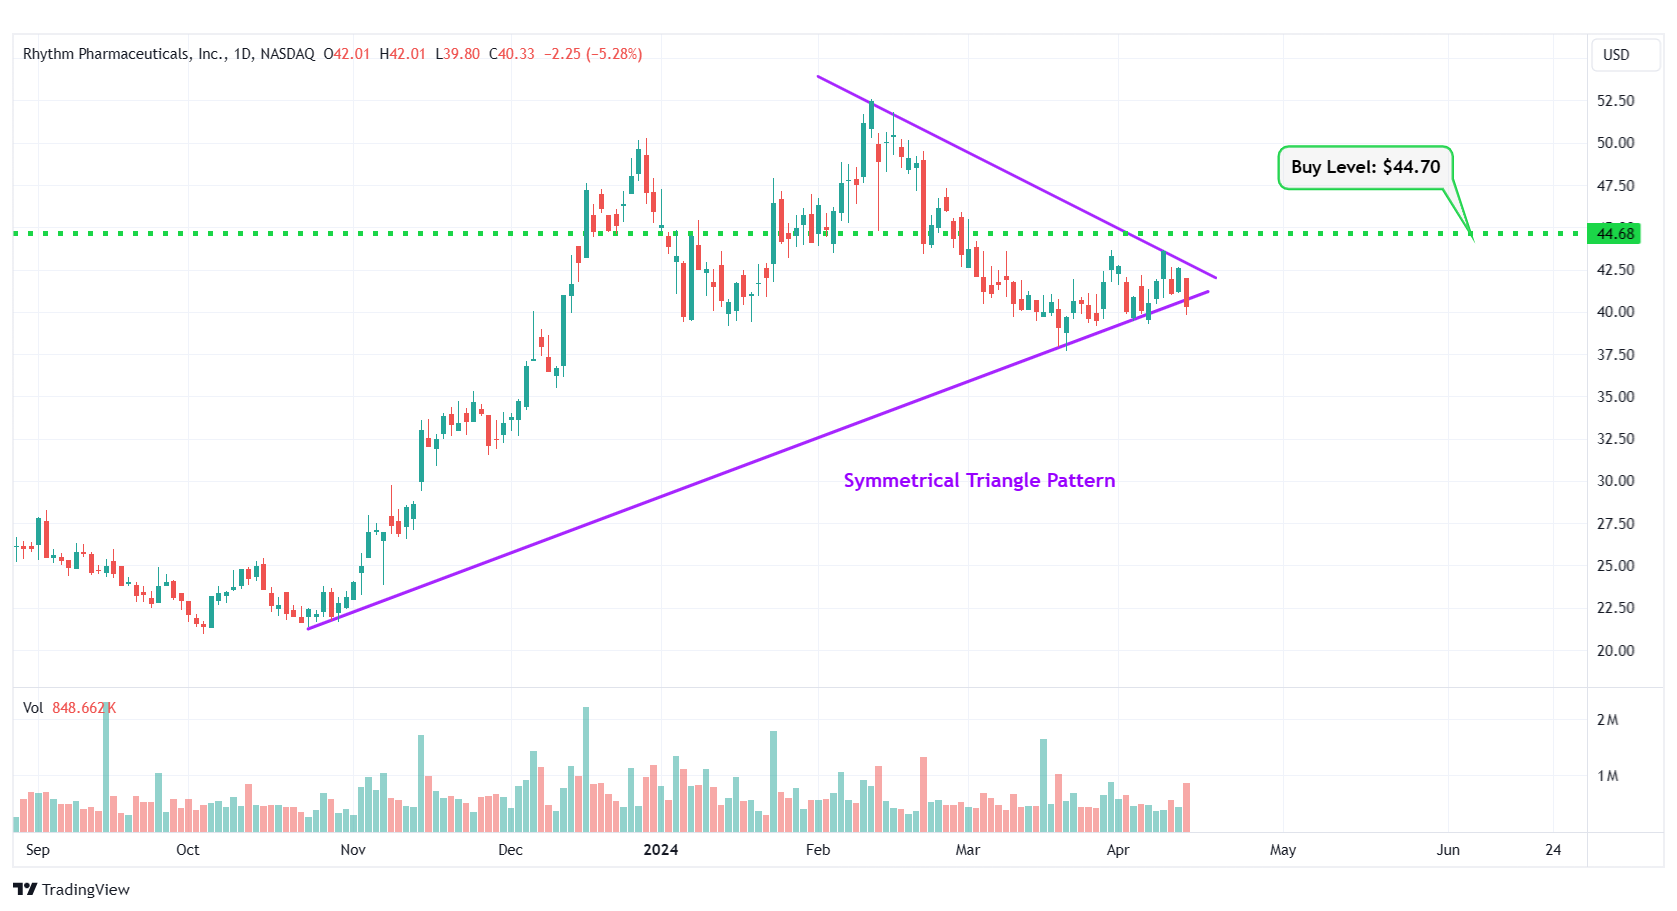
RYTM – Symmetrical Triangle Pattern
#4 Nurix Therapeutics Inc. (NASDAQ: NRIX)
Sector: Healthcare • Biotechnology
Reason: Formation of an Uptrend Channel
An uptrend channel or an ascending channel is the price action contained between upward sloping parallel lines. It is formed by a lower trend line that connects the swing lows, and an upper channel line that joins the swing highs. A stock usually trades between the two rails of the uptrend channel before finally breaking out from the upper rail.
Buy Level(s): The ideal buy level for NRIX is if the stock breaks out of the uptrend channel and has a daily close above $17.70. This is marked in the chart below as a green color dotted line.
Daily chart – NRIX
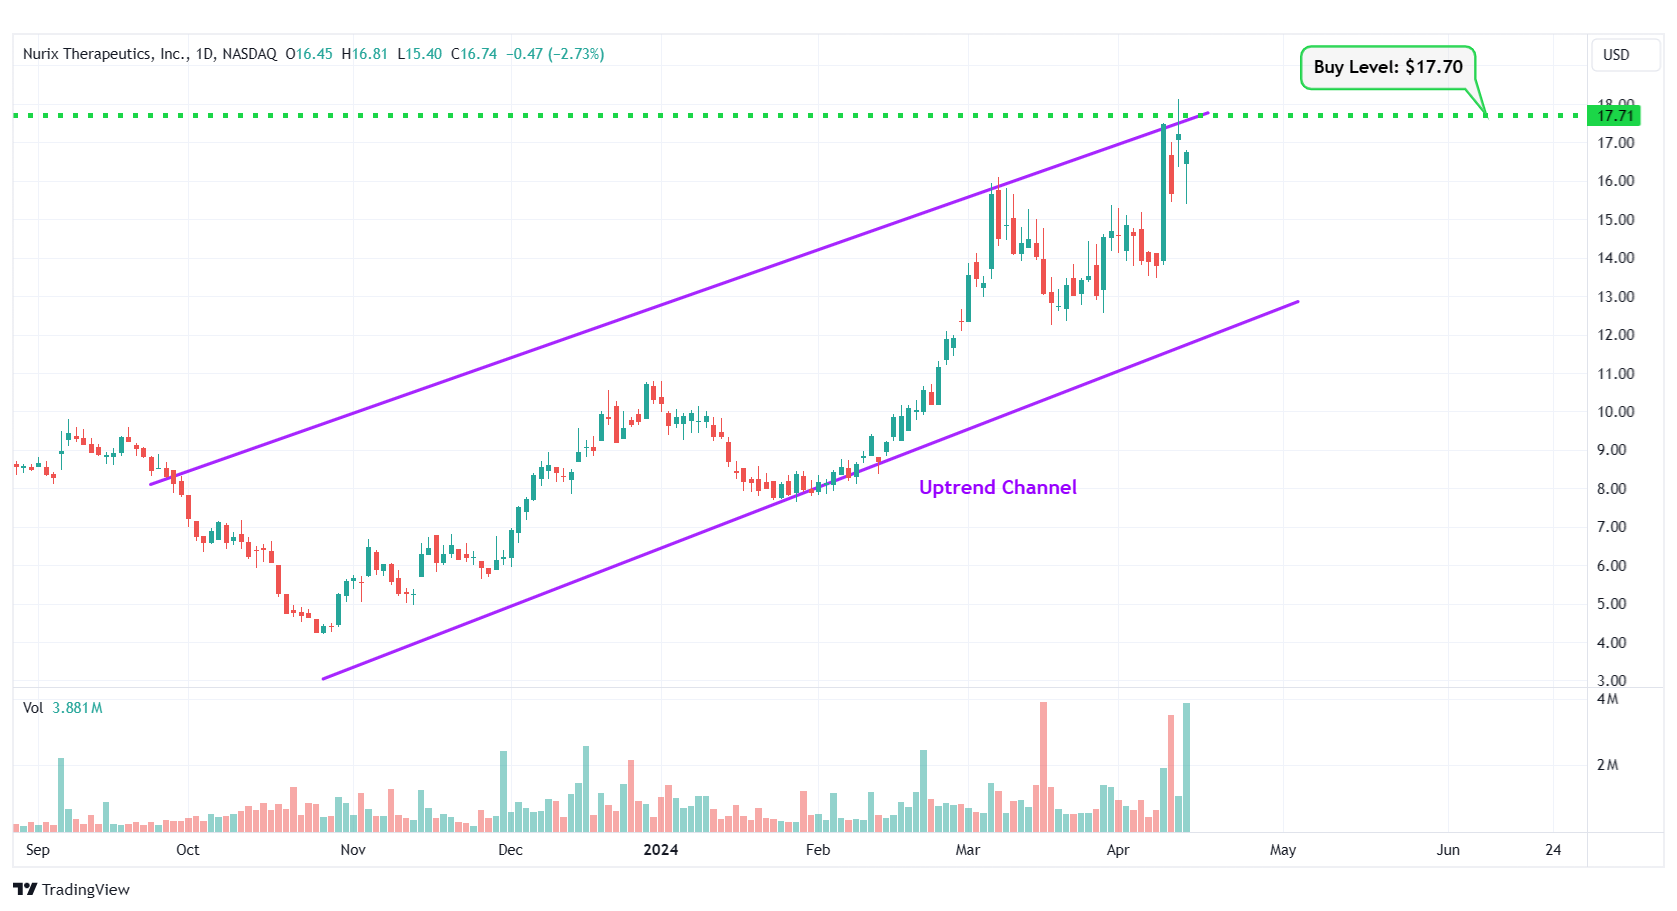
NRIX – Uptrend Channel
#5 Biomarin Pharmaceutical Inc. (NASDAQ: BMRN)
Sector: Healthcare • Biotechnology
Reason: Symmetrical Triangle Pattern Breakout
A symmetrical triangle is a chart pattern formed by two converging trend lines connecting a series of sequential peaks and troughs. These two lines result in the formation of a triangle that appears to be symmetrical.
A symmetrical triangle pattern is usually formed when there is indecision in the price movements and there is uncertainty among the buyers and sellers. This chart pattern represents a period of consolidation before the price breaks out or breaks down. In case a breakout occurs from the upper trend line, it is a strong bullish indication as it signifies the start of a new bullish trend.
Buy Level(s): The stock has currently broken out of a symmetrical triangle pattern. However, the ideal buy level for BMRA is if the stock closes above the immediate resistance level of $93.10. This is marked in the chart below as a green color dotted line.
Daily chart – BMRN
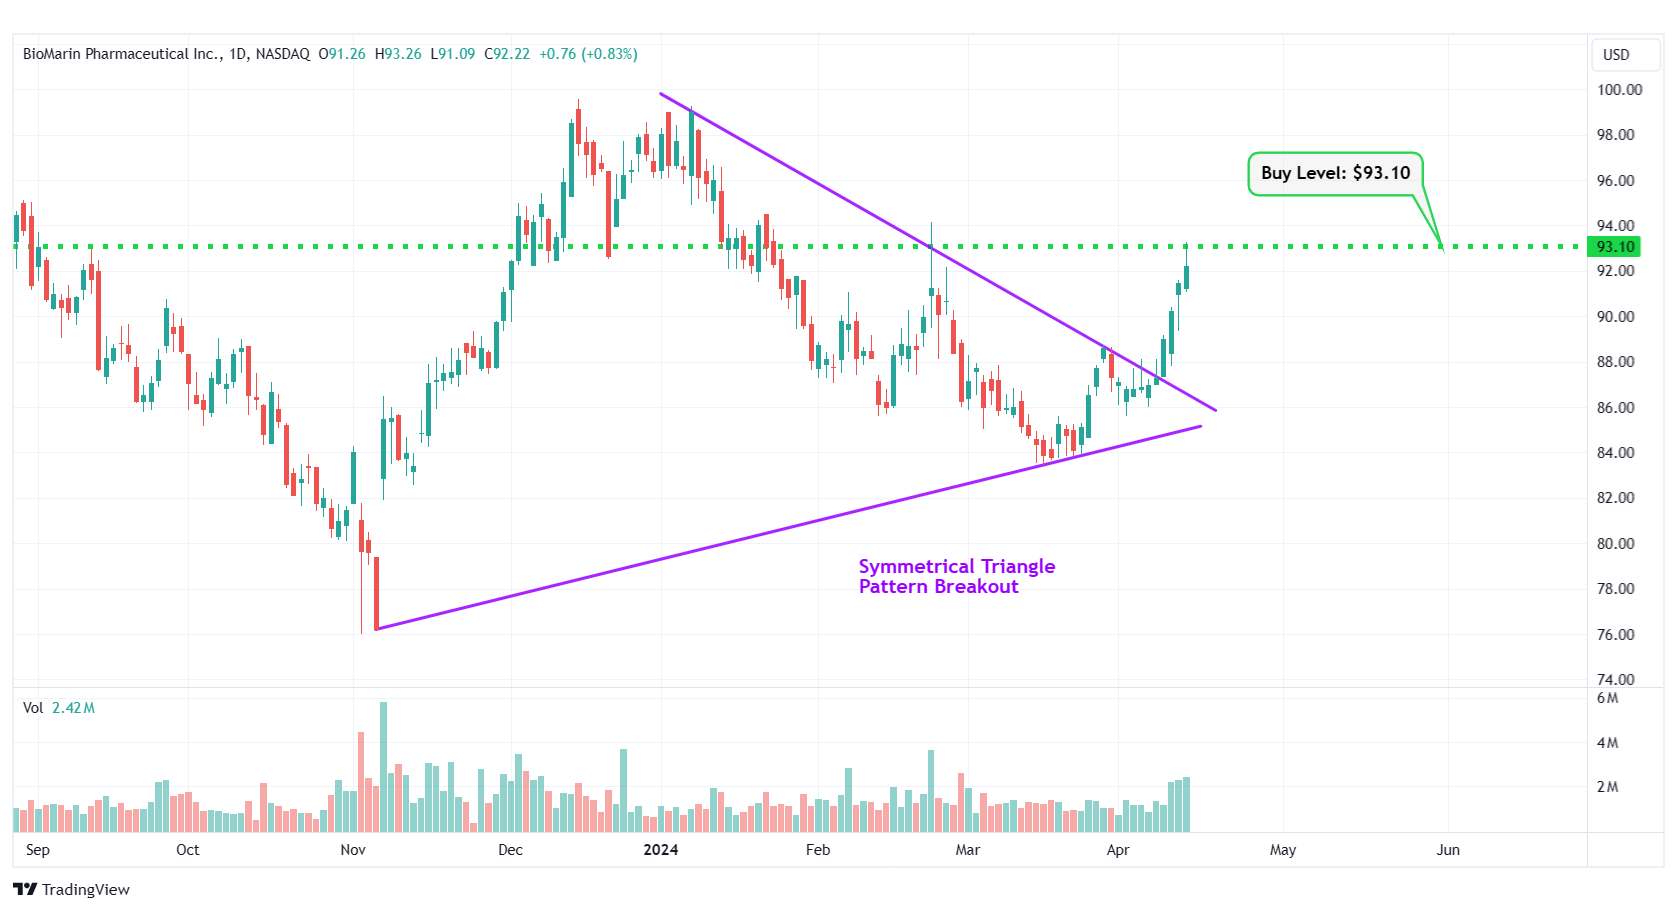
BMRN – Symmetrical Triangle Pattern Breakout
#6 Vera Therapeutics Inc. (NASDAQ: VERA)
Sector: Healthcare • Biotechnology
Reason: Breakout From a Flag Pattern
A flag pattern is a short-term continuation pattern that marks a small consolidation before the previous move resumes. The pattern is formed when the market consolidates in a narrow range after a sharp move. For a stock in an uptrend, a breakout from this pattern is typically a strong bullish indication.
Buy Level(s): Although the stock has currently broken out of the flag pattern, the ideal buy level for VERA is above the near-term resistance level of $49.20. This is marked in the chart below as a green color dotted line.
Daily chart – VERA
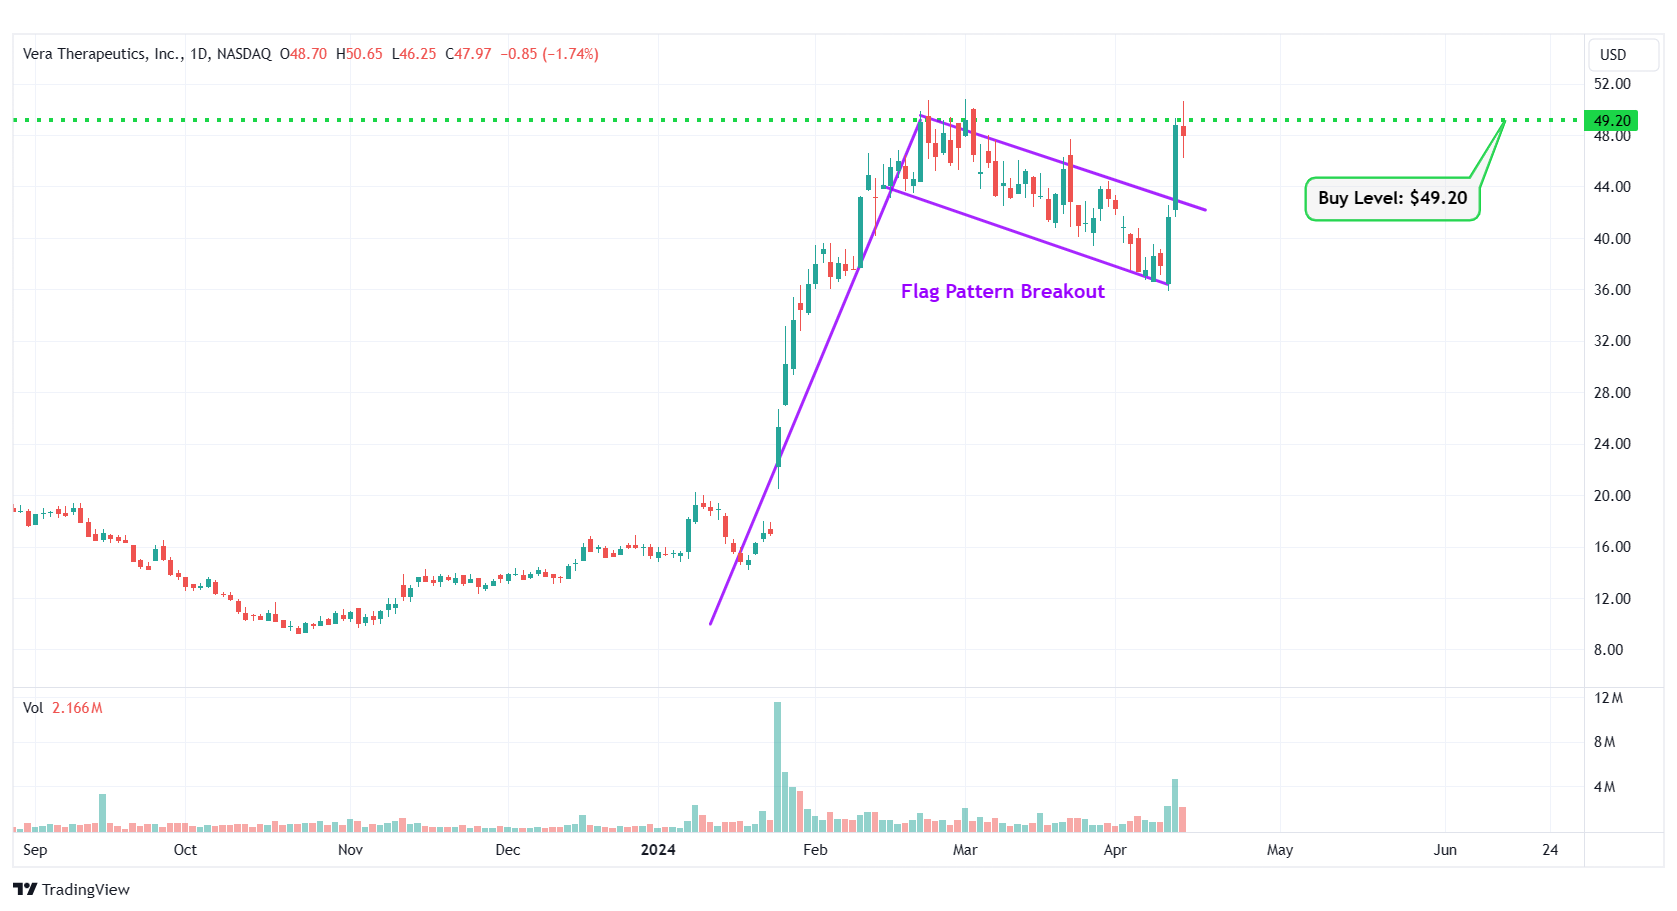
VERA – Flag Pattern Breakout
#7 Lions Gate Entertainment Corp. (NYSE: LGF.B)
Sector: Communication Services • Entertainment
Reason: Symmetrical Triangle Pattern Breakout
A symmetrical triangle is a chart pattern formed by two converging trend lines connecting a series of sequential peaks and troughs. These two lines result in the formation of a triangle that appears to be symmetrical.
A symmetrical triangle pattern is usually formed when there is indecision in the price movements and there is uncertainty among the buyers and sellers. This chart pattern represents a period of consolidation before the price breaks out or breaks down. In case a breakout occurs from the upper trend line, it is a strong bullish indication as it signifies the start of a new bullish trend.
Buy Level(s): The stock has currently broken out of a symmetrical triangle pattern. However, the ideal buy level for LGF.B is if the stock closes above the immediate resistance level of $10.10. This is marked in the chart below as a green color dotted line.
Daily chart – LGF.B
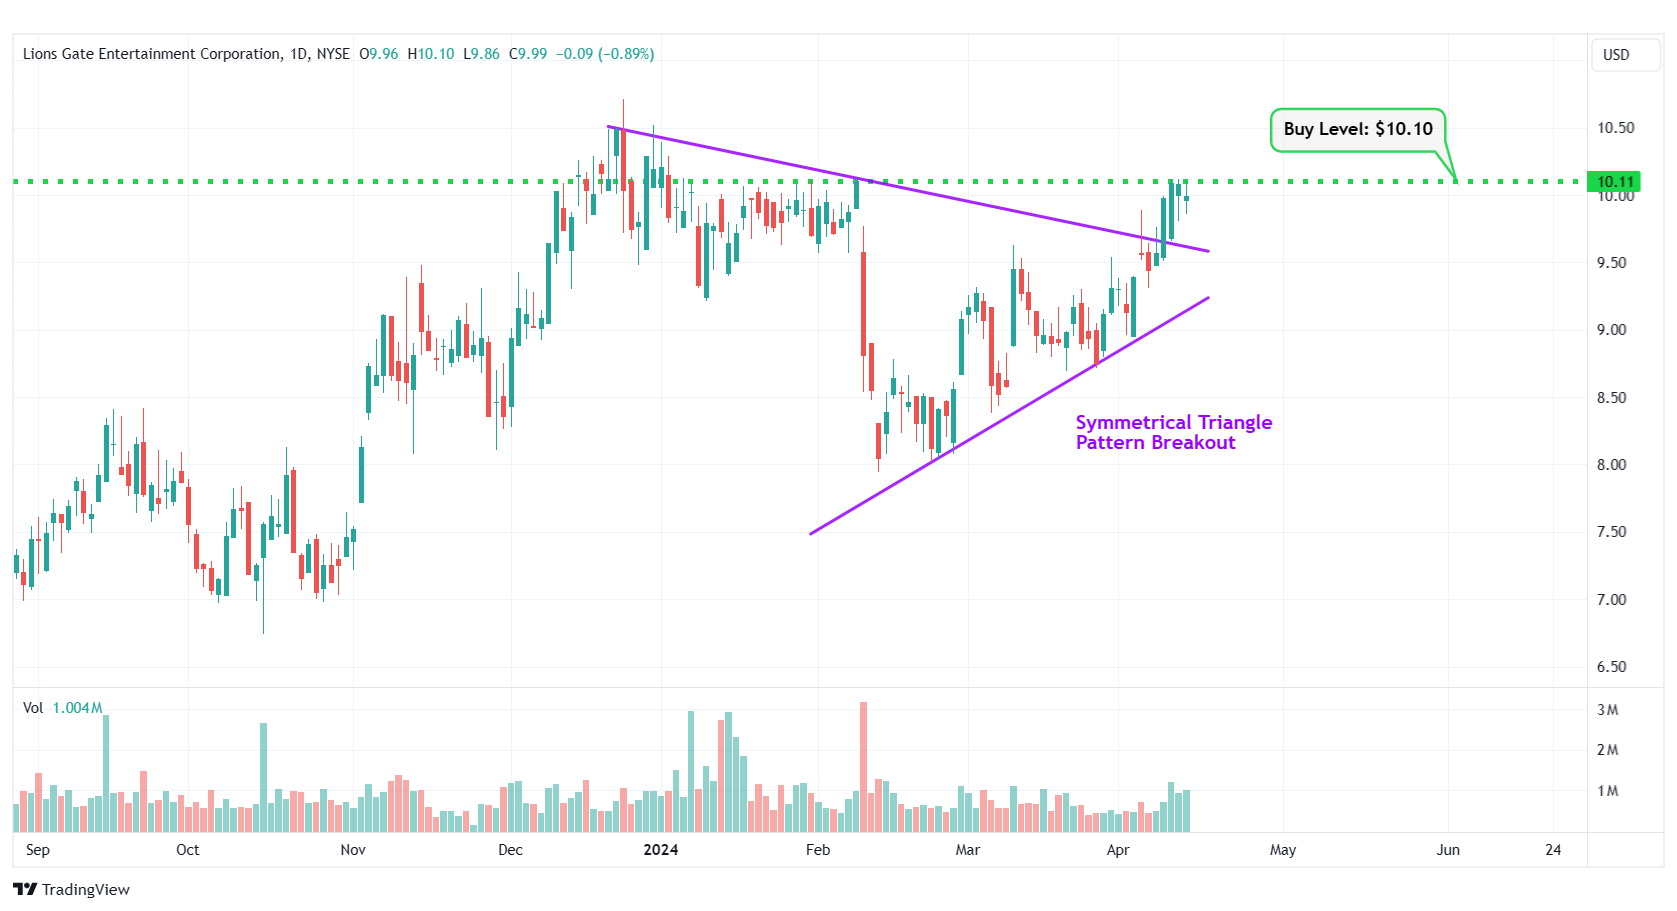
LGF.B – Symmetrical Triangle Pattern Breakout
#8 Coupang Inc. (NYSE: CPNG)
Sector: Consumer Cyclical • Internet Retail
Reason: Breakout From an Ascending Triangle Pattern
An ascending triangle pattern is a bullish pattern formed by drawing a horizontal line along the swing highs, and a rising trendline along the swing lows. These two lines result in the formation of a triangle. A breakout from this pattern is typically a strong bullish indication.
Buy Level(s): Although the stock has broken out of the ascending triangle pattern, the ideal buy level for CPNG is if the stock has a daily close above the near-term resistance level of $21.50. This is marked in the chart below as a green color dotted line.
Daily chart – CPNG
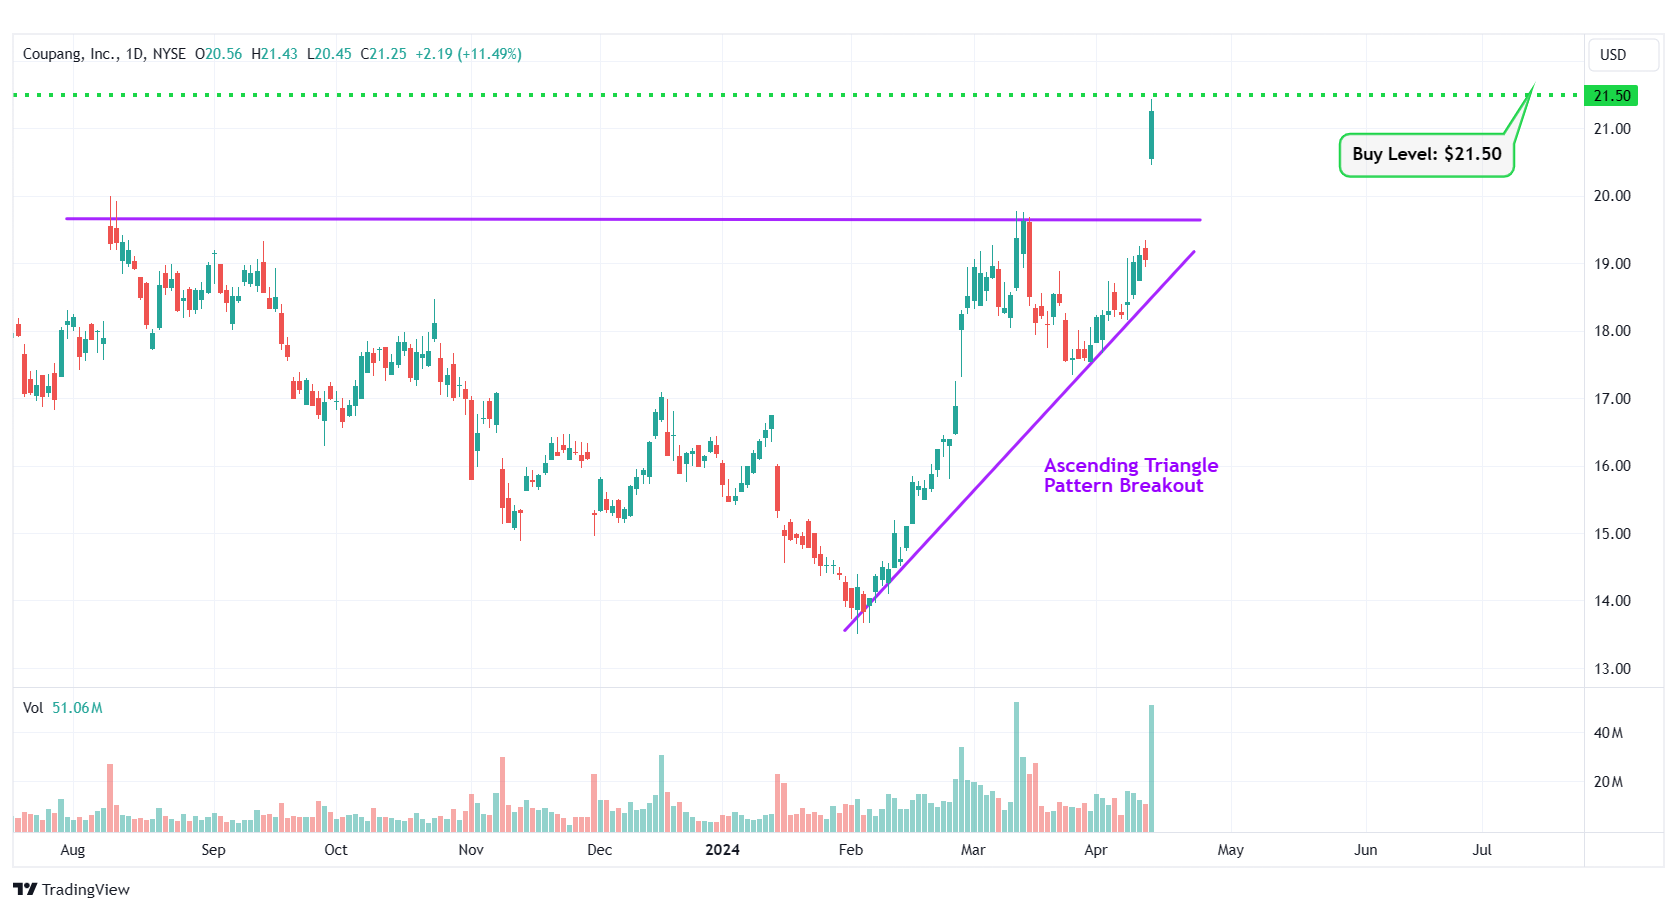
CPNG – Ascending Triangle Pattern Breakout
#9 Apple Inc. (NASDAQ: AAPL)
Sector: Technology • Consumer Electronics
Reason: Falling Wedge Pattern Breakout
A falling wedge pattern is formed by joining two downward-sloping, converging trendlines having a contracting range. The pattern appears to be wide at the top and continues to contract as prices fall. A breakout from a falling wedge pattern can indicate either reversal or continuation depending on where the pattern appeared in the trend.
A stock that has broken out of a falling wedge pattern would have gained momentum and would have the potential to move higher.
Buy Level(s): The stock has currently broken out of a falling wedge pattern. However, the ideal buy level for AAPL is above the nearest resistance level of $178.80. This is marked in the chart below as a green color dotted line.
Daily chart – AAPL
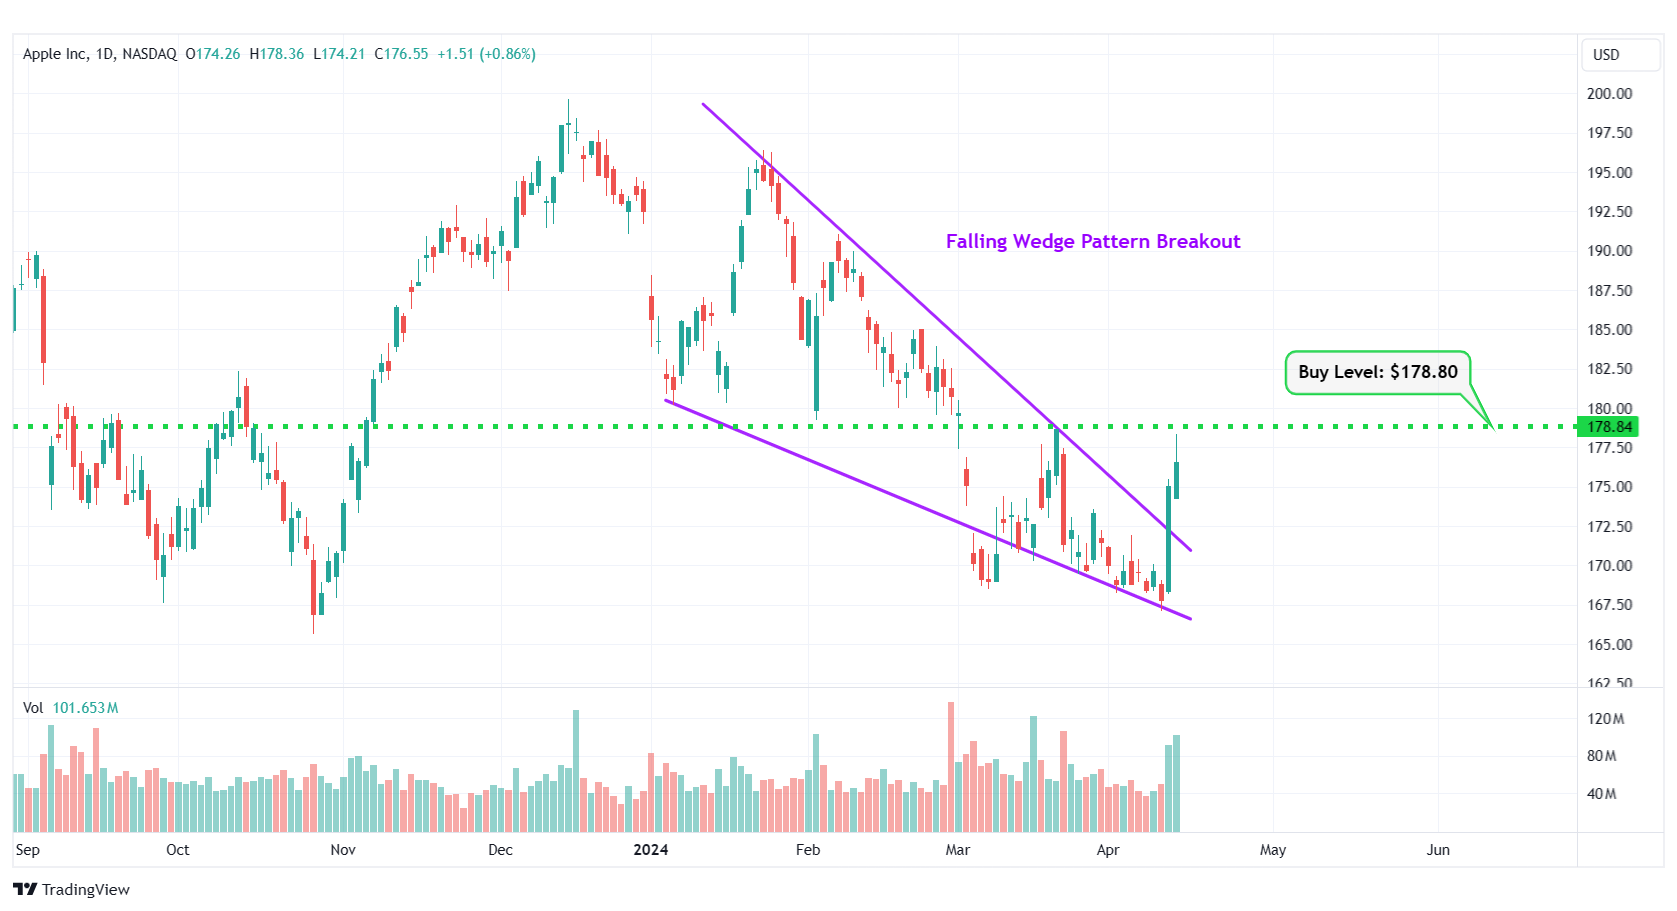
AAPL – Falling Wedge Pattern Breakout
#10 State Street Corp. (NYSE: STT)
Sector: Financial • Asset Management
Reason: Formation of a Symmetrical Triangle Pattern
A symmetrical triangle is a chart pattern formed by two converging trend lines connecting a series of sequential peaks and troughs. These two lines result in the formation of a triangle that appears to be symmetrical.
A symmetrical triangle pattern is usually formed when there is indecision in the price movements and there is uncertainty among the buyers and sellers. This chart pattern represents a period of consolidation before the price breaks out or breaks down. In case a breakout occurs from the upper trend line, it is a strong bullish indication as it signifies the start of a new bullish trend.
Buy Level(s): The ideal buy level for STT is if the stock has a daily close above the breakout level of the symmetrical triangle pattern, at around $78.50. This is marked in the chart below as a green color dotted line.
Daily chart – STT
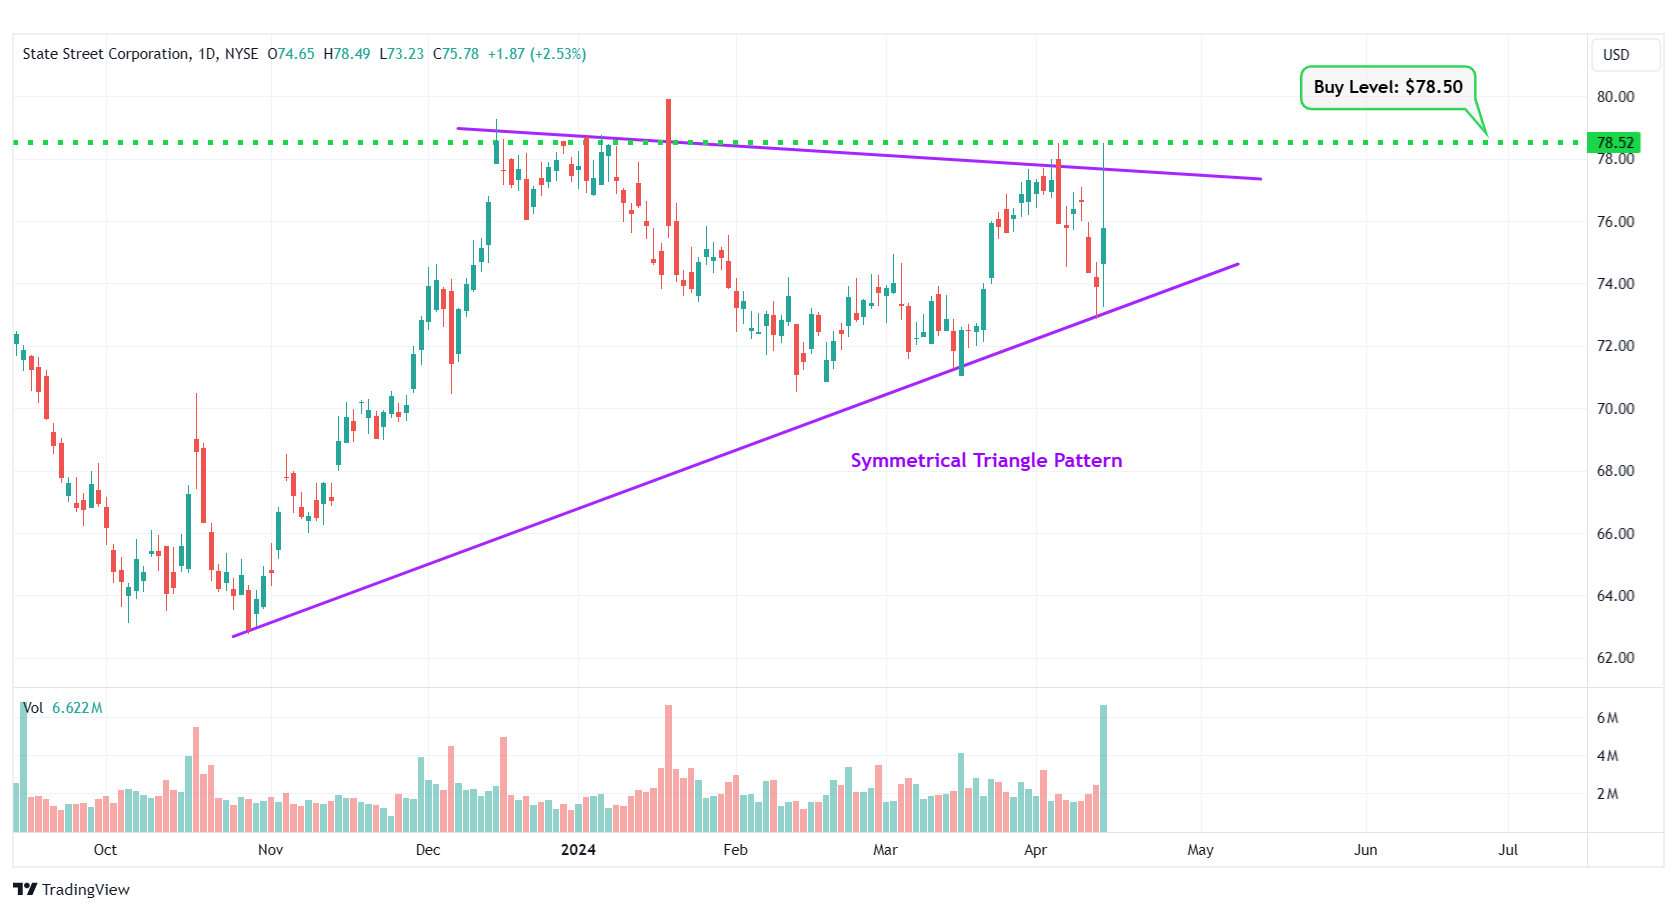
STT – Symmetrical Triangle Pattern
Happy Trading!
Trades of The Day Research Team
If you're buying rare earth or other critical mineral stocks, you're already one step behind - because we believe that political insiders in Washington are preparing to buy a whole new group of stocks, which could begin soaring 500%+ just days from now. The man once ranked in 2020 as America's #1 stock picker is doing something extraordinary and giving away the name and ticker of every single stock that could be next. Everything you need to know is here.
Source: Trades of the Day
