
Hims & Hers Health, Inc. (NYSE: HIMS) seems to be poised for a price surge as per its latest charts. The company operates a telehealth platform that connects consumers to licensed healthcare professionals. The company offers a range of curated prescription and non-prescription health and wellness products and services.
Bullish Indications
#1 Ascending Triangle Pattern Breakout: The daily chart shows that the stock has currently broken out of an Ascending Triangle pattern with a historic high volume. An Ascending Triangle pattern is a bullish pattern. This is marked on the daily chart in purple color lines. A breakout from this pattern typically indicates bullishness. The base of the triangle generally acts as a good support level after the breakout.
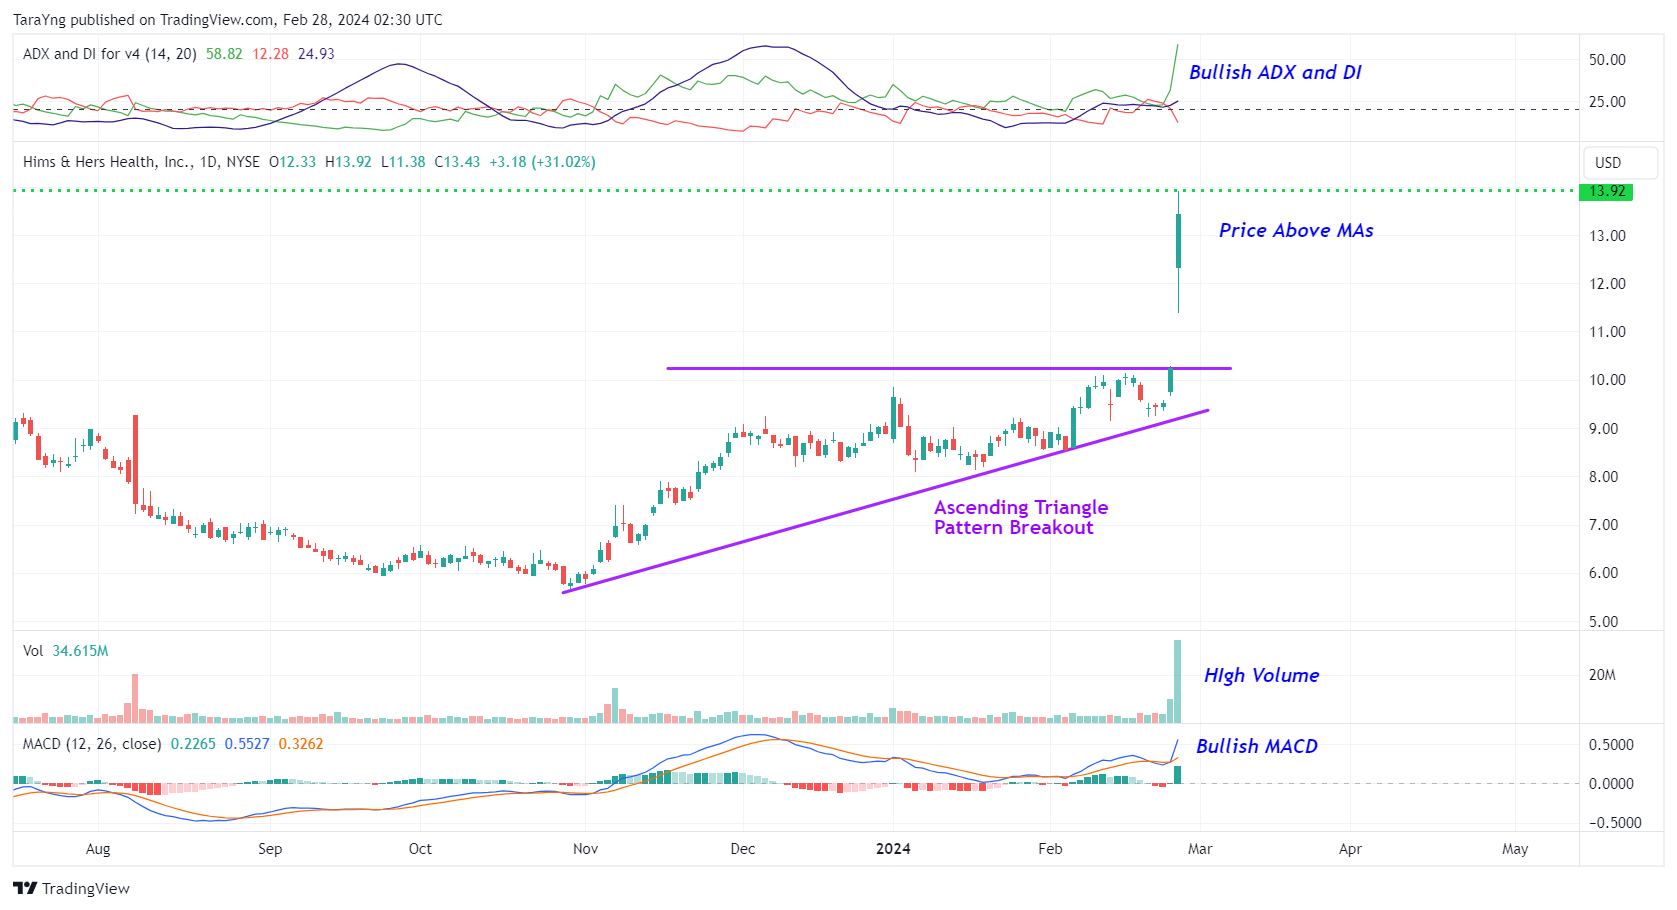
HIMS – Daily Chart
#2 Price above MAs: The price is currently above the short-term moving average of 50-day SMA as well as the longer-term moving average of 200-day SMA, indicating that the bulls are still in control. This is a positive indication.
#3 MACD Above Signal Line: In the daily chart, the MACD line (light blue color) is currently above the MACD signal line (orange color) which is typically considered bullish.
#4 Bullish ADX: The ADX indicator shows that the +DI line is currently above the –DI line and the ADX line has started to move up from below the –DI and +DI lines. This indicates possible bullishness.
#5 Above Support Area: As you can see from the weekly chart, the stock has currently moved up from a resistance-turned-support level. This level is marked as a pink color dotted line. This looks like a good area for the stock to move higher. The stock is also trading above its 50-week and 200-week SMA, indicating that the bulls are still in control.
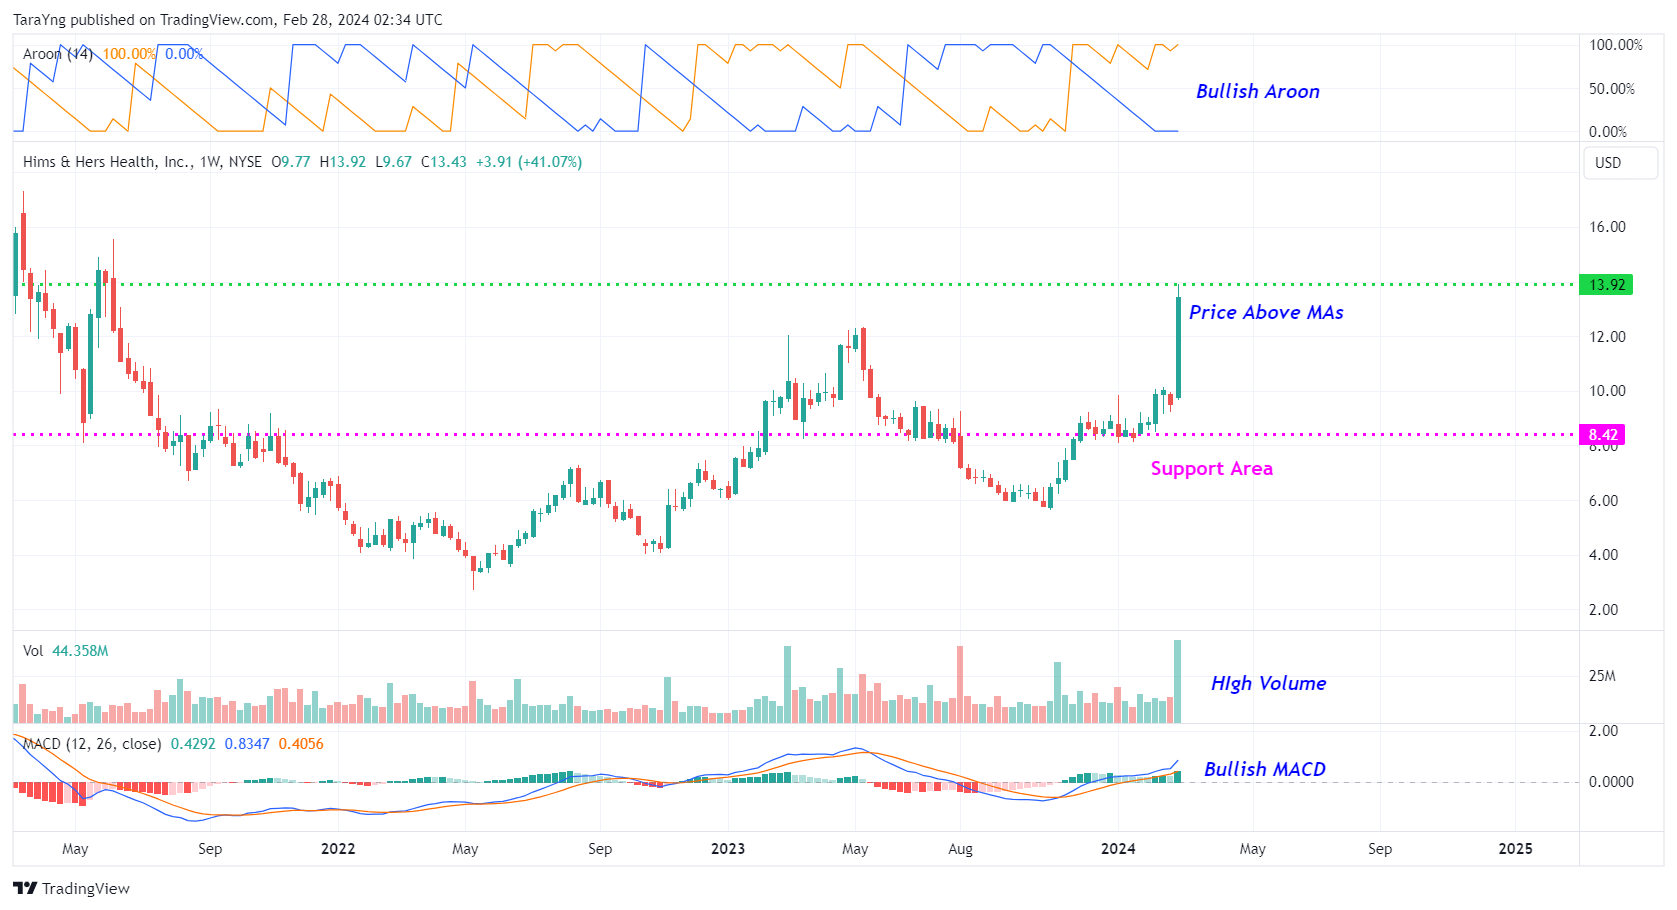
HIMS – Weekly Chart
#6 Bullish MACD: The MACD line is above the MACD signal line in the weekly chart as well, indicating bullishness.
#7 Bullish Aroon: The value of Aroon Up (orange line) is above 70 while Aroon Down (blue line) is below 30 in the weekly chart. This indicates possible bullishness.
Recommended Trade (based on the charts)
Buy Levels: If you want to get in on this trade, you can purchase shares of HIMS above the price of around $13.90.
TP: Our target prices are $18 and $22 in the next 3-6 months.
SL: To limit risk, place stop-loss at $11.30. Note that the stop-loss is on a closing basis.
Our target potential upside is 29% to 58% in the next 3 to 6 months.
For a risk of $2.60, our target rewards are $4.10 and $8.10. This is a nearly 1:2 and 1:3 risk-reward trade.
In other words, this trade offers nearly 2x to 3x more potential upside than downside.
Risks to Consider
The stock may reverse its overall trend if it breaks down from the ascending triangle pattern breakout level with a high volume. The sell-off of the stock could also be triggered in case of any negative news, overall weakness in the market, or any regulatory changes in the sector.
Happy Trading!
Tara
Imagine having 12 new monthly income checks, carrying the potential of up to 21% yields.This is possible because of a tested strategy to get paid out regularly, like a paycheck. For over a decade, I have helped more than 26,000 investors secure 12 new monthly payouts. Meaning, you know exactly how much you'll make every month... Because of some stocks that pay us 8%,13.4%, and even 21.6% yields. See it for yourself here.
Source: Trades of the Day
