
Picking a winning trade on a consistent basis is not simply a stroke of luck. It’s the result of calculated screening, planning, and deliberation.
With this in mind, we have started a new weekly series on our top 10 stocks to watch this week — stocks that look poised for a possible breakout in the coming days. Traders should add these stocks to their watchlist now.
The Top 10 Stocks to Watch This Week for Possible Breakouts
| Sl # | Name of the Stock | Stock Ticker | Last Close | Buy Level(s) | Reason |
| 1 | Meta Platforms Inc. | NASDAQ: META | $474.99 | $481.40 | Uptrend Channel Breakout |
| 2 | Palantir Technologies Inc. | NYSE: PLTR | $17.02 | $17.60 | Symmetrical Triangle Pattern |
| 3 | Applied Optoelectronics Inc. | NASDAQ: AAOI | $18.83 | $19.70 | Flag Pattern |
| 4 |
Tyra Biosciences Inc. |
NASDAQ: TYRA | $16.82 | $17.10 | Downtrend Channel Breakout |
| 5 | Edwards Lifesciences Corp | NYSE: EW | $86.09 | $87.50 | Symmetrical Triangle Pattern Breakout |
| 6 | Snap Inc. | NYSE: SNAP | $17.05 | $17.40 | Flag Pattern |
| 7 | Mattel, Inc. | NASDAQ: MAT | $19.02 | $19.20 | Symmetrical Triangle Pattern Breakout |
| 8 | Confluent Inc. | NASDAQ: CFLT | $24.13 | $25.80 | Falling Wedge Pattern Breakout |
| 9 | Ford Motor Co. | NYSE: F | $12.14 | $12.30 | Symmetrical Triangle Pattern Breakout |
| 10 | Chevron Corp. | NYSE: CVX | $152.24 | $152.60 | Falling Wedge Pattern Breakout |
Important: Typically, these trades offer a risk: reward ratio of 1:2 or 1:3 in the next 6 months, which implies 2x to 3x rewards when compared to risks. So, be sure to set your stop-loss levels and target prices accordingly to manage your risk. In addition, these trade ideas are triggered using daily closing prices, not intra-day pricing. So, if you participate in these trades, make sure that you only buy the stock once its daily close is above the recommended price level.
That said, here are the top 10 stocks to watch for a breakout, in no particular order.
#1 Meta Platforms Inc. (NASDAQ: META)
Sector: Communication Services • Internet Content & Information
Reason: Breakout From an Uptrend Channel
An uptrend channel or an ascending channel is the price action contained between upward sloping parallel lines. It is formed by a lower trend line that connects the swing lows, and an upper channel line that joins the swing highs. A stock usually trades between the two rails of the uptrend channel before finally breaking out from the upper rail.
Buy Level(s): The stock has currently broken out of the uptrend channel. However, the ideal buy level for META is if the stock has a daily close above the near-term resistance level of $481.40. This is marked in the chart below as a green color dotted line.
Daily chart – META
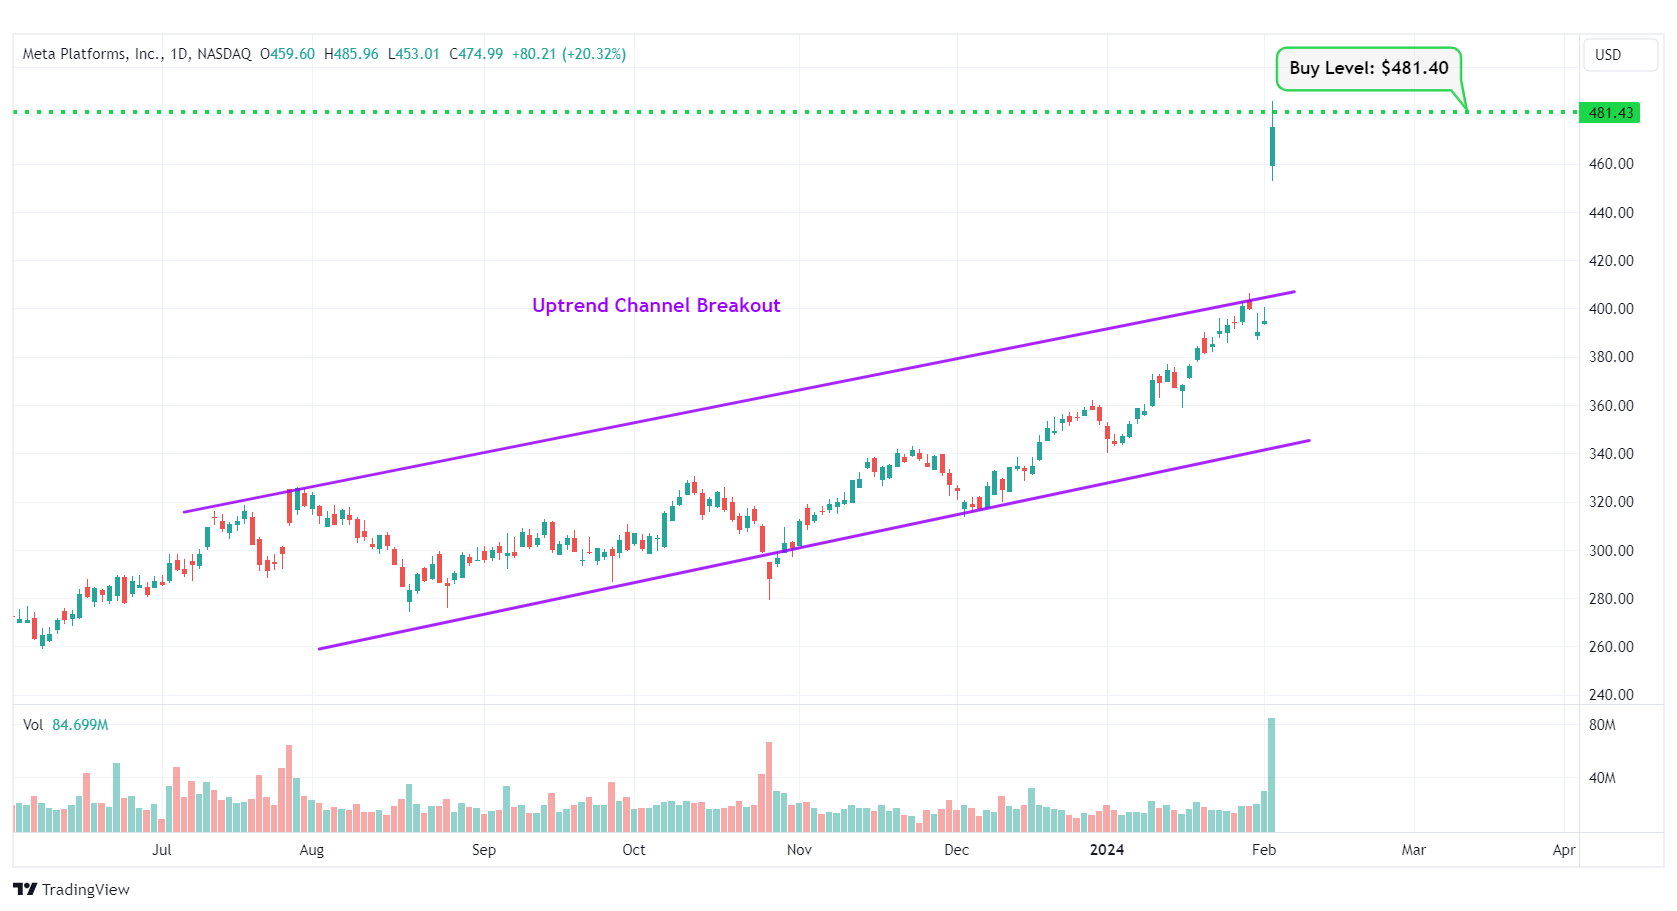
META – Uptrend Channel Breakout
#2 Palantir Technologies Inc. (NYSE: PLTR)
Sector: Technology • Software – Infrastructure
Reason: Formation of a Symmetrical Triangle Pattern
A symmetrical triangle is a chart pattern formed by two converging trend lines connecting a series of sequential peaks and troughs. These two lines result in the formation of a triangle that appears to be symmetrical.
A symmetrical triangle pattern is usually formed when there is indecision in the price movements and there is uncertainty among the buyers and sellers. This chart pattern represents a period of consolidation before the price breaks out or breaks down. In case a breakout occurs from the upper trend line, it is a strong bullish indication as it signifies the start of a new bullish trend.
Buy Level(s): The ideal buy level for PLTR is if the stock has a daily close above the breakout level of the symmetrical triangle pattern, at around $17.60. This is marked in the chart below as a green color dotted line.
Daily chart – PLTR
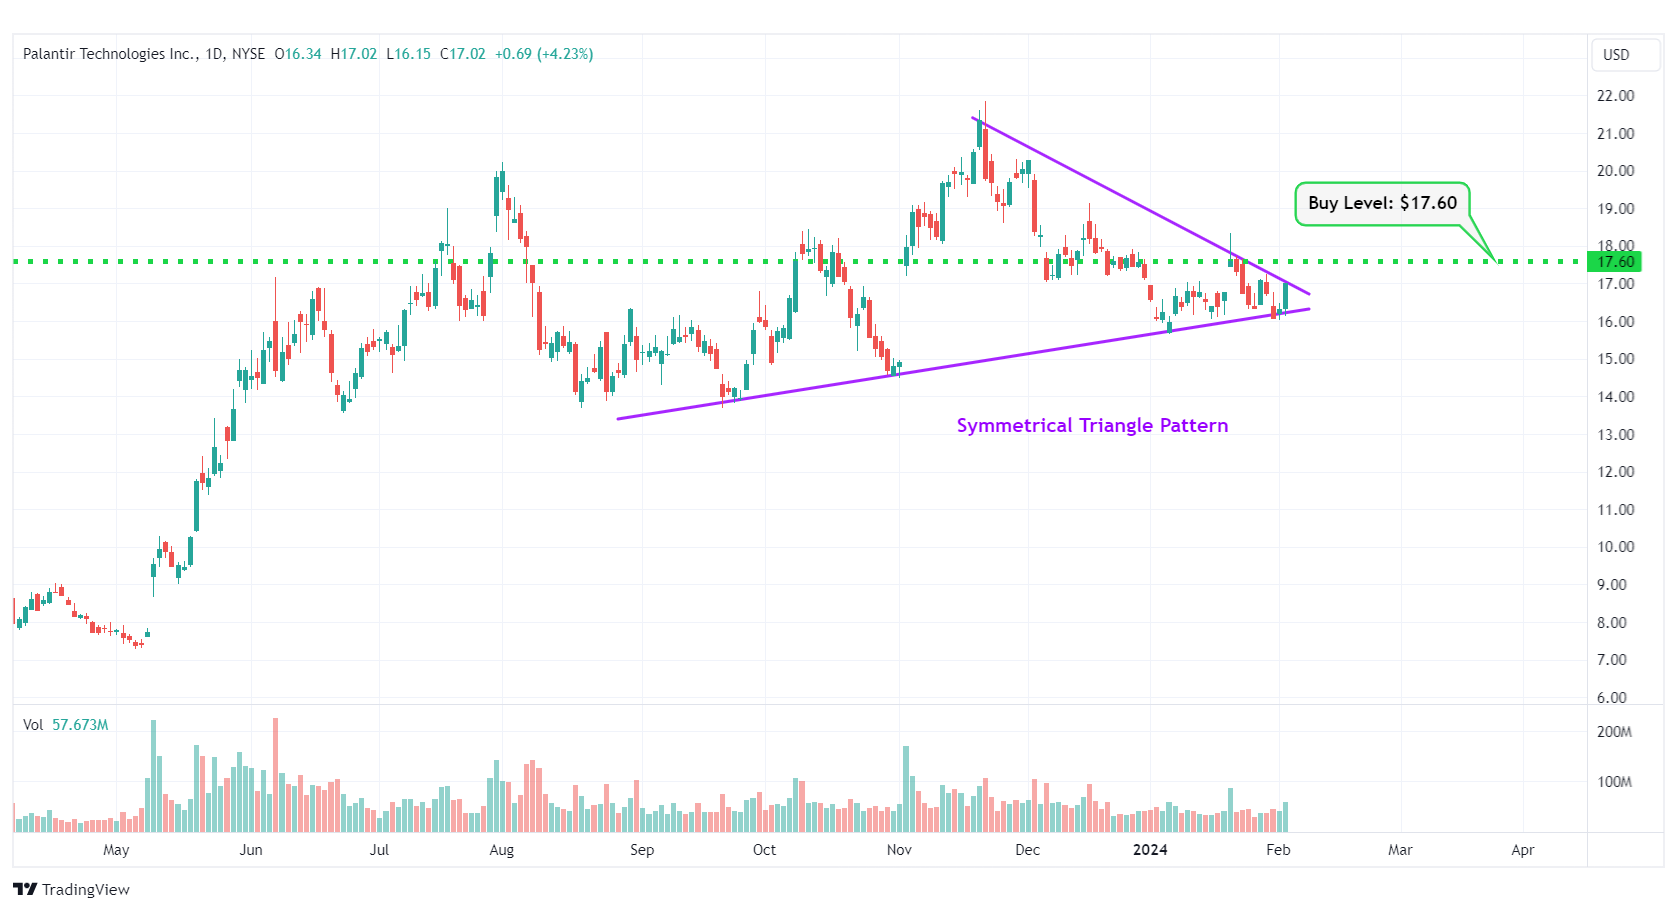
PLTR – Symmetrical Triangle Pattern
#3 Applied Optoelectronics Inc. (NASDAQ: AAOI)
Sector: Technology • Communication Equipment
Reason: Formation of a Flag Pattern
A flag pattern is a short-term continuation pattern that marks a small consolidation before the previous move resumes. The pattern is formed when the market consolidates in a narrow range after a sharp move. For a stock in an uptrend, a breakout from this pattern is typically a strong bullish indication.
Buy Level(s): The ideal buy level for AAOI is if the stock breaks out of the flag pattern, at around $19.70. This is marked in the chart below as a green color dotted line.
Daily chart – AAOI
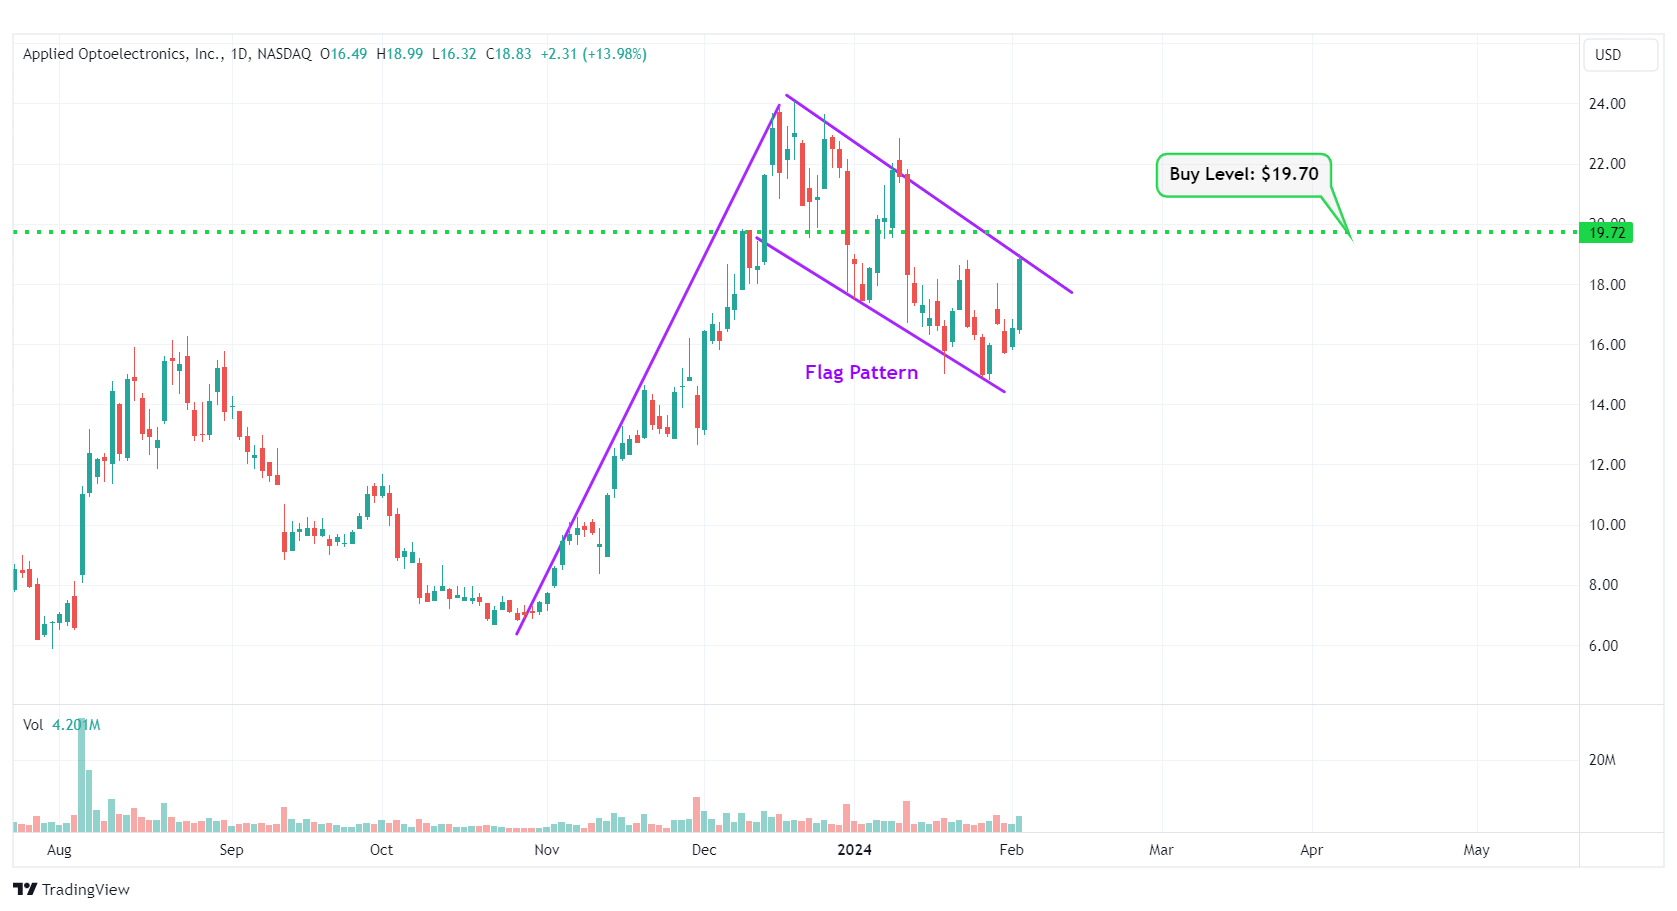
AAOI – Flag Pattern
#4 Tyra Biosciences Inc. (NASDAQ: TYRA)
Sector: Healthcare • Biotechnology
Reason: Downtrend Channel Breakout
A downtrend or descending channel is the price action contained between downward sloping parallel lines. It is formed by two lines that are drawn by connecting the lower highs and lower lows of a stock’s price. Even though this is typically a bearish pattern, a breakout from the upper rail of this pattern is considered a good bullish indication.
Buy Level(s): The daily chart shows that the stock has currently broken out of a downtrend channel. However, there is a near-term resistance level for the stock. Hence, the ideal buy level for TYRA is if the stock has a daily close above $17.10. This is marked in the chart below as a green color dotted line.
Daily chart – TYRA
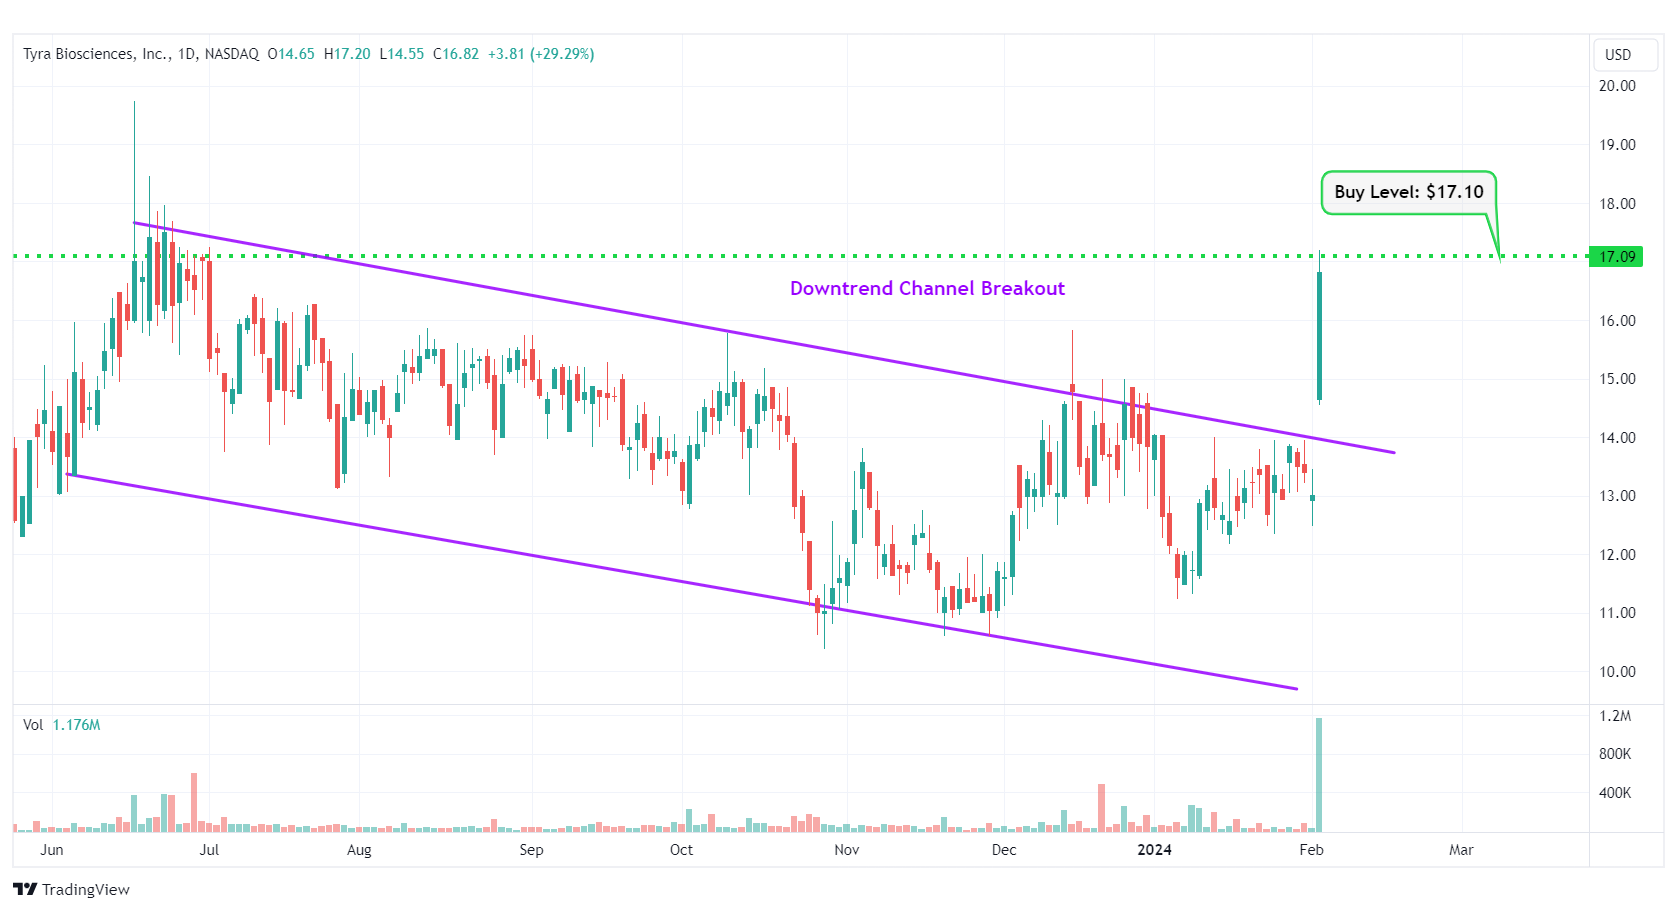
TYRA – Downtrend Channel Breakout
#5 Edwards Lifesciences Corp (NYSE: EW)
Sector: Healthcare • Medical Devices
Reason: Symmetrical Triangle Pattern Breakout
A symmetrical triangle is a chart pattern formed by two converging trend lines connecting a series of sequential peaks and troughs. These two lines result in the formation of a triangle that appears to be symmetrical.
A symmetrical triangle pattern is usually formed when there is indecision in the price movements and there is uncertainty among the buyers and sellers. This chart pattern represents a period of consolidation before the price breaks out or breaks down. In case a breakout occurs from the upper trend line, it is a strong bullish indication as it signifies the start of a new bullish trend.
Buy Level(s): The stock has currently broken out of a symmetrical triangle pattern. However, the ideal buy level for EW is if the stock closes above the immediate resistance level of $87.50. This is marked in the chart below as a green color dotted line.
Daily chart – EW
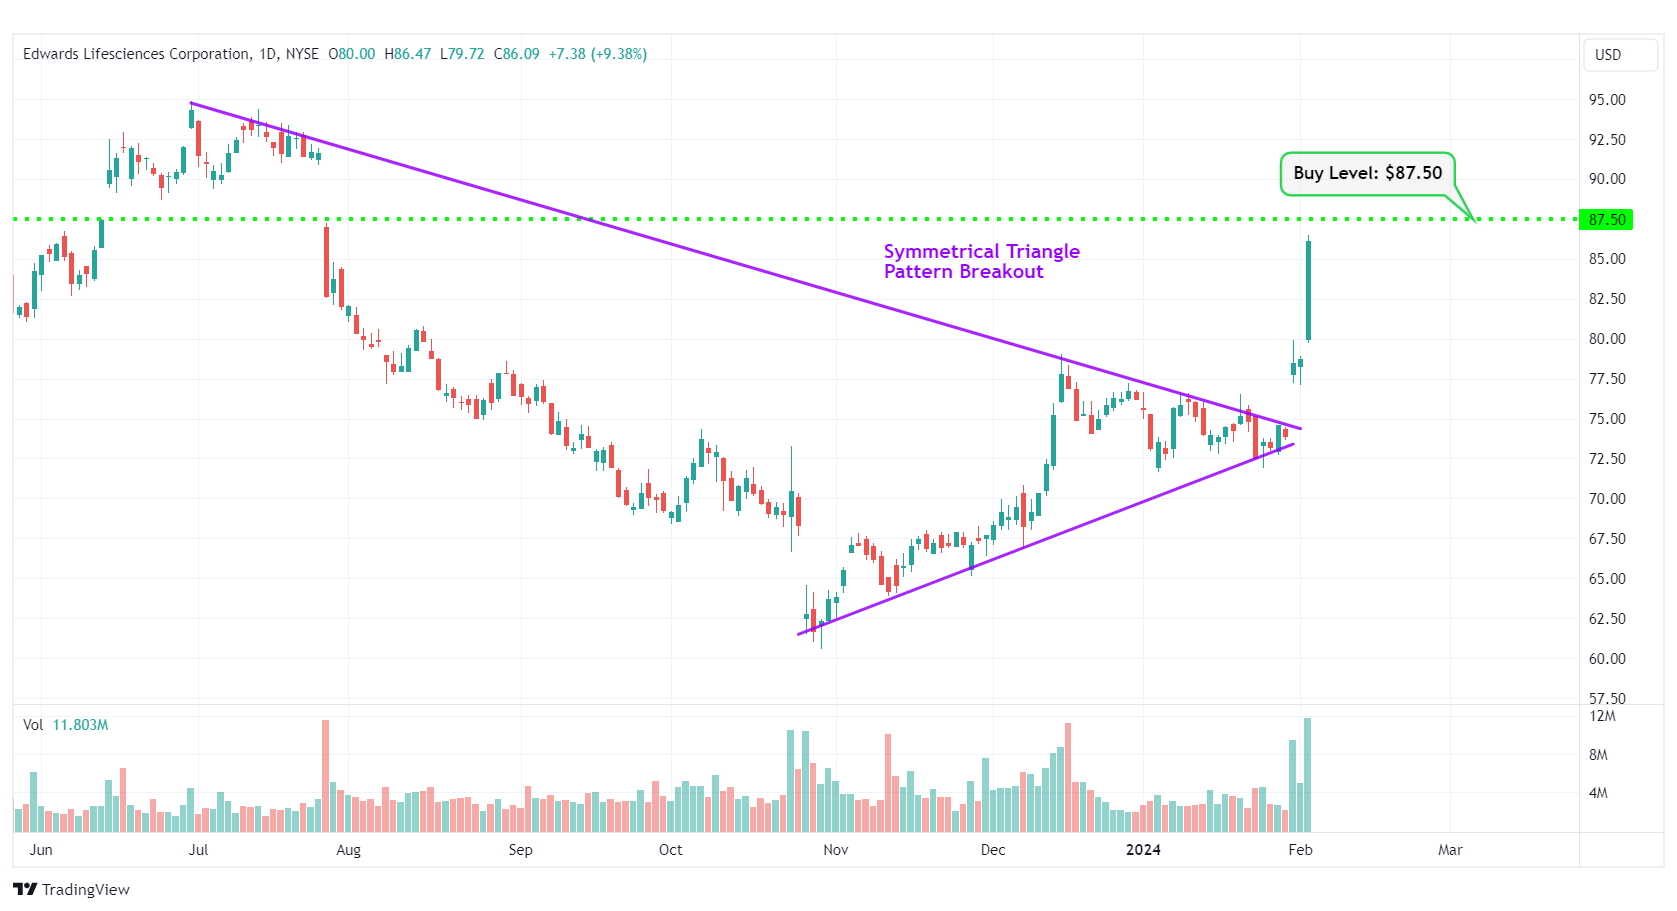
EW – Symmetrical Triangle Pattern Breakout
#6 Snap Inc. (NYSE: SNAP)
Sector: Communication Services • Internet Content & Information
Reason: Formation of a Flag Pattern
A flag pattern is a short-term continuation pattern that marks a small consolidation before the previous move resumes. The pattern is formed when the market consolidates in a narrow range after a sharp move. For a stock in an uptrend, a breakout from this pattern is typically a strong bullish indication.
Buy Level(s): The ideal buy level for SNAP is if the stock breaks out of the flag pattern, at around $17.40. This is marked in the chart below as a green color dotted line.
Daily chart – SNAP
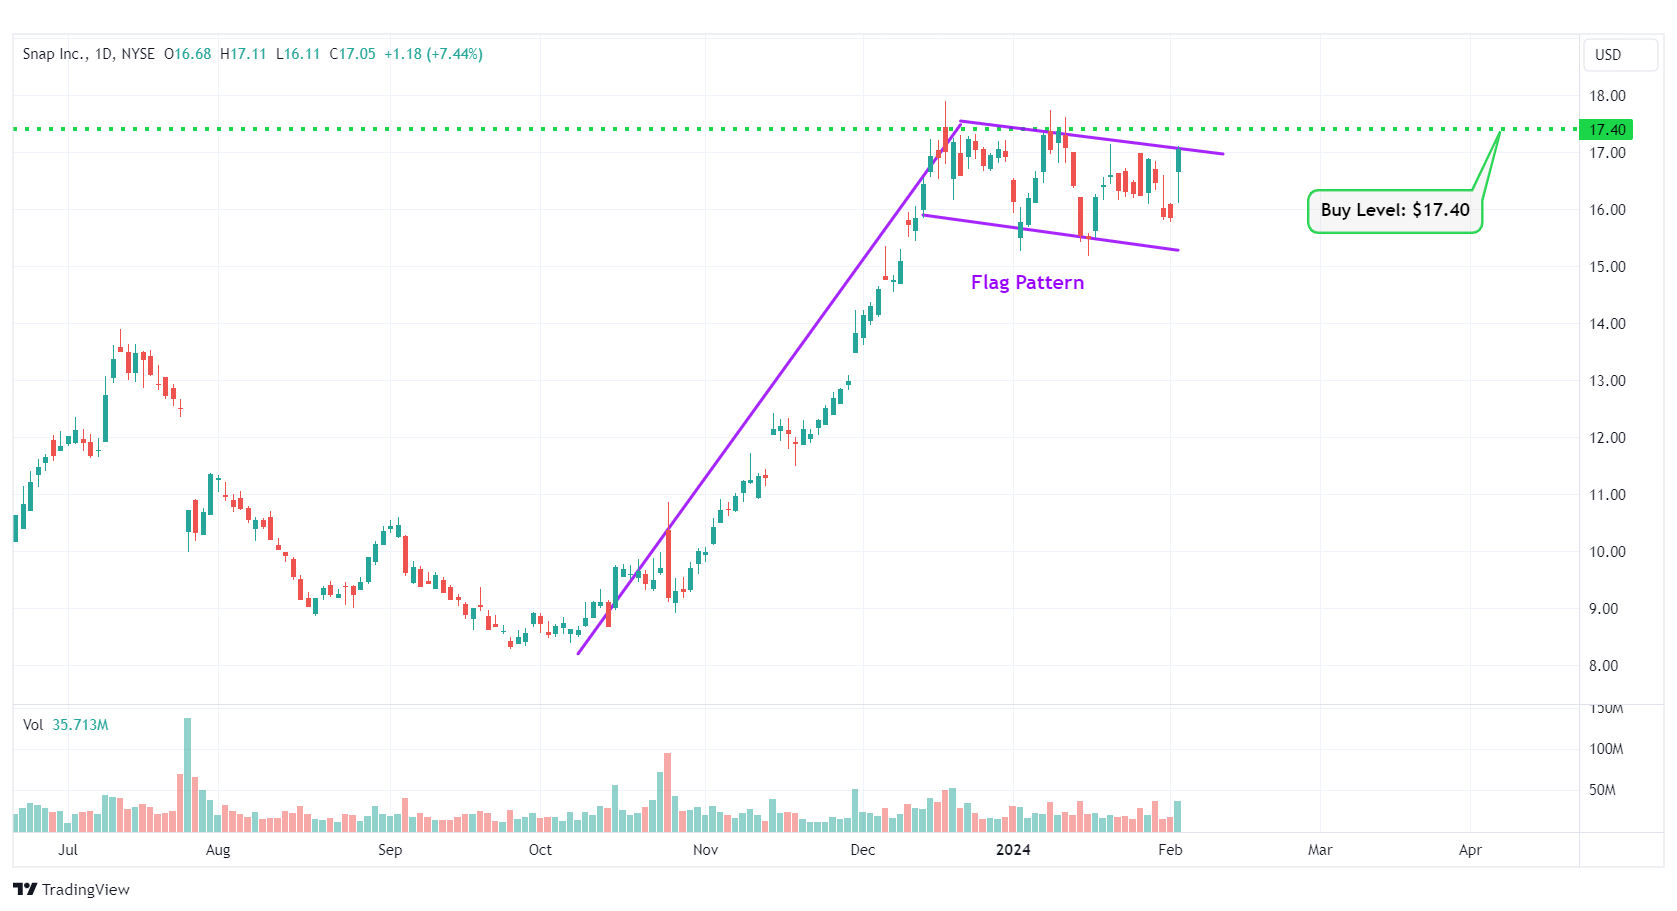
SNAP – Flag Pattern
#7 Mattel, Inc. (NASDAQ: MAT)
Sector: Consumer Cyclical • Leisure
Reason: Symmetrical Triangle Pattern Breakout
A symmetrical triangle is a chart pattern formed by two converging trend lines connecting a series of sequential peaks and troughs. These two lines result in the formation of a triangle that appears to be symmetrical.
A symmetrical triangle pattern is usually formed when there is indecision in the price movements and there is uncertainty among the buyers and sellers. This chart pattern represents a period of consolidation before the price breaks out or breaks down. In case a breakout occurs from the upper trend line, it is a strong bullish indication as it signifies the start of a new bullish trend.
Buy Level(s): The stock has currently broken out of a symmetrical triangle pattern. However, the ideal buy level for MAT is if the stock closes above the immediate resistance level of $19.20. This is marked in the chart below as a green color dotted line.
Daily chart – MAT
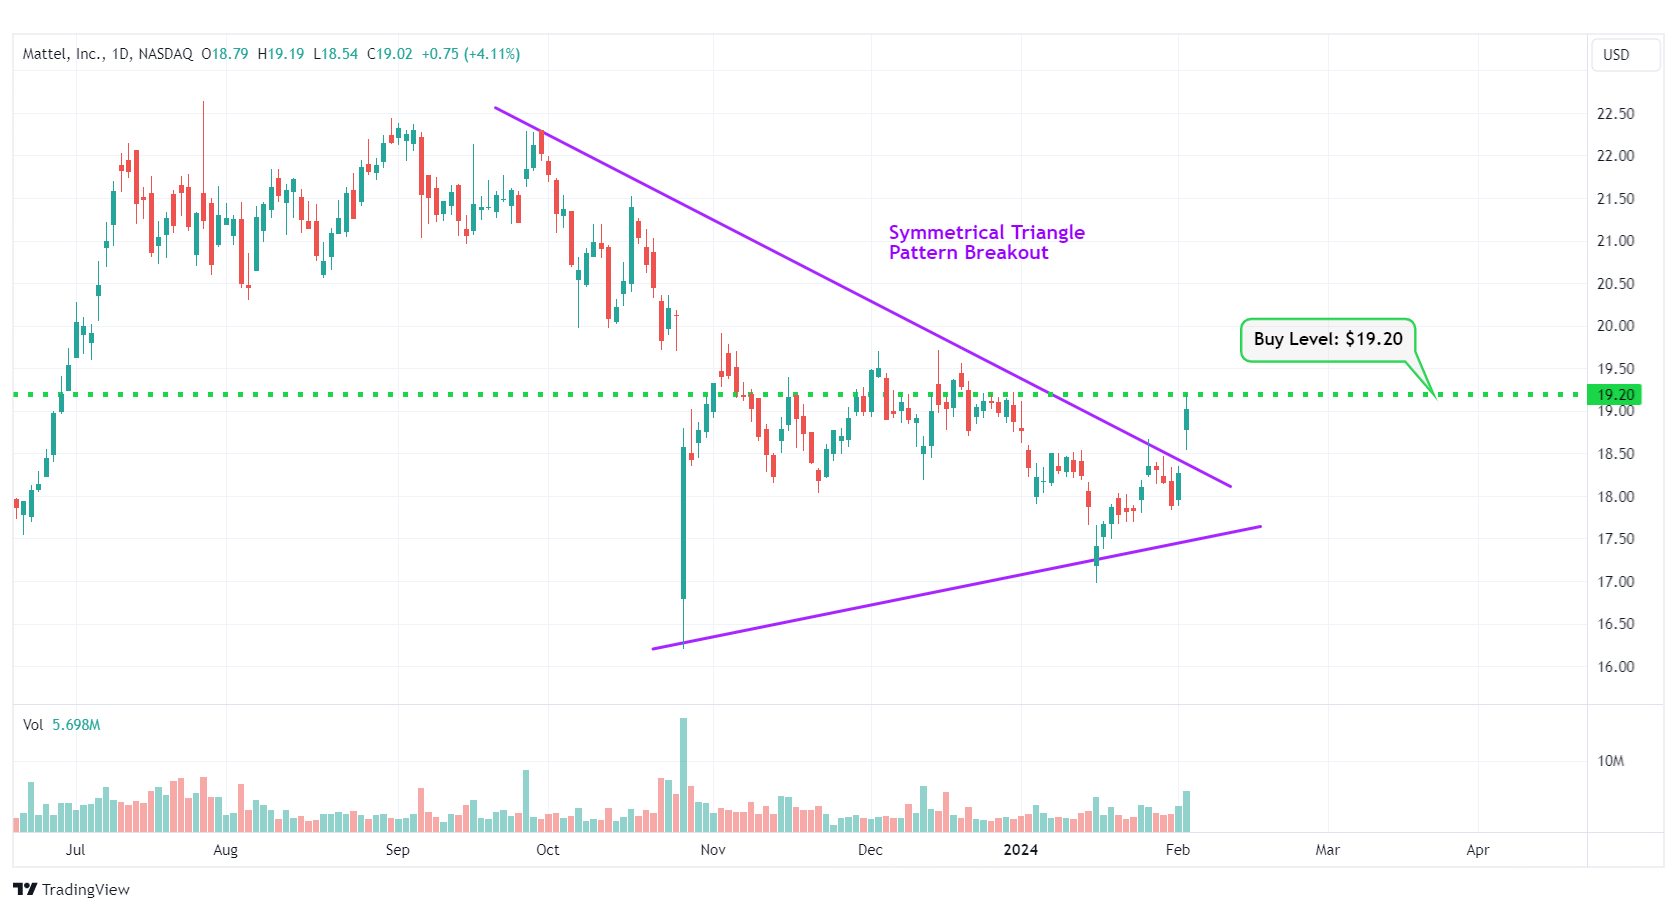
MAT – Symmetrical Triangle Pattern Breakout
#8 Confluent Inc. (NASDAQ: CFLT)
Sector: Technology • Software – Infrastructure
Reason: Falling Wedge Pattern Breakout
A falling wedge pattern is formed by joining two downward-sloping, converging trendlines having a contracting range. The pattern appears to be wide at the top and continues to contract as prices fall. A breakout from a falling wedge pattern can indicate either reversal or continuation depending on where the pattern appeared in the trend.
A stock that has broken out of a falling wedge pattern would have gained momentum and would have the potential to move higher.
Buy Level(s): The stock has currently broken out of a falling wedge pattern. However, the ideal buy level for CFLT is above the nearest resistance level of $25.80. This is marked in the chart below as a green color dotted line.
Daily chart – CFLT
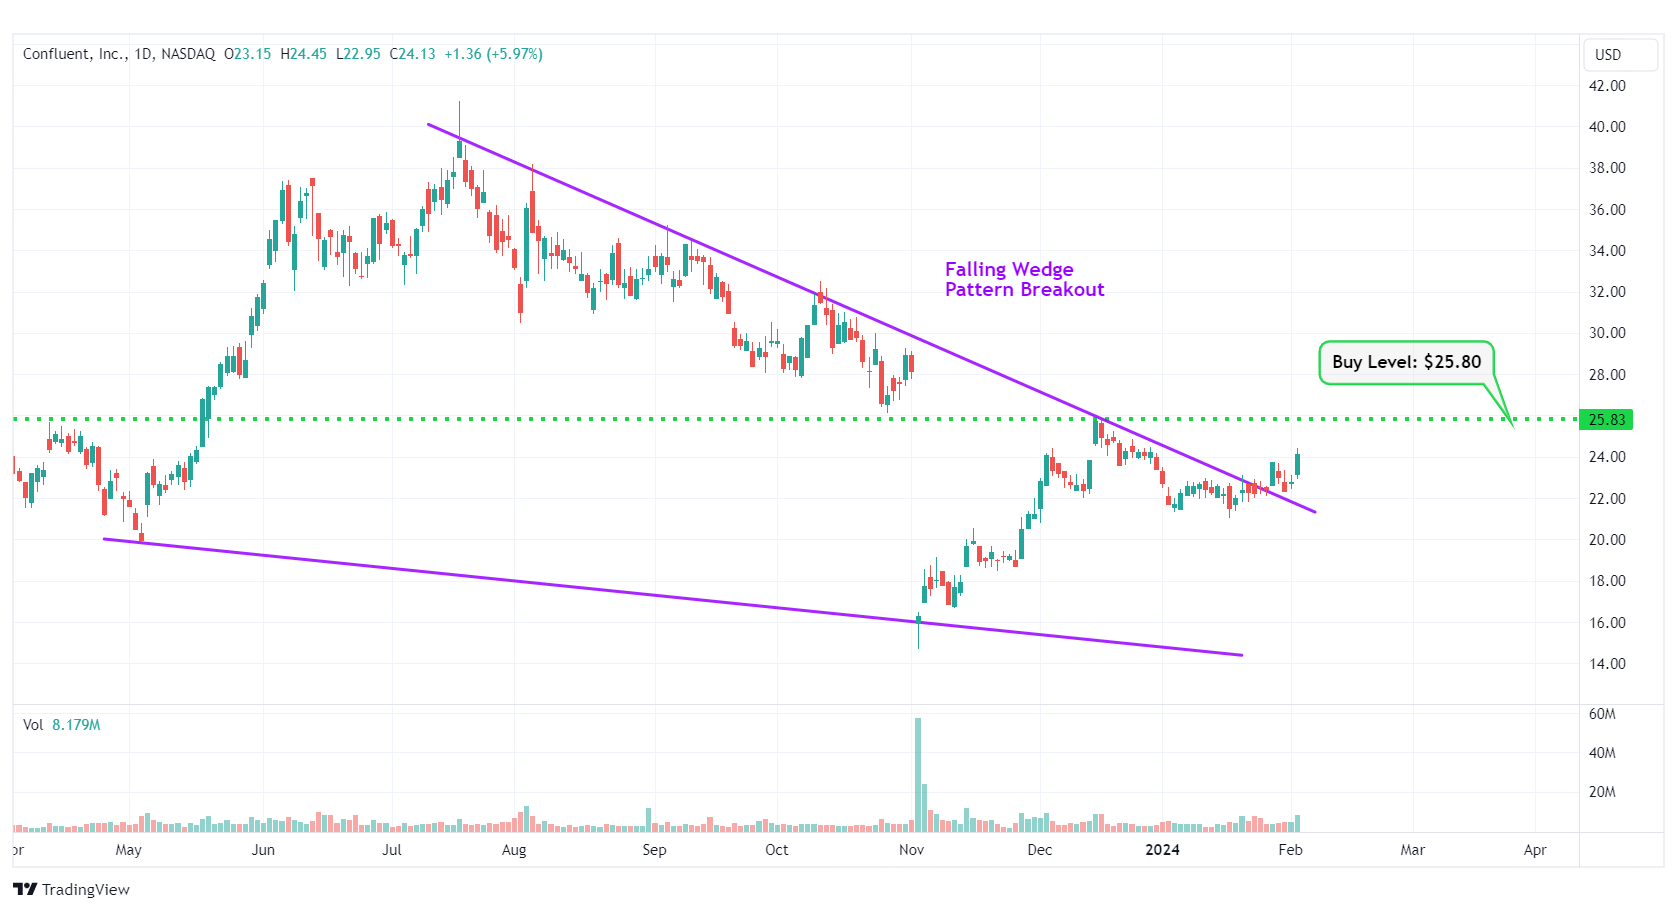
CFLT – Falling Wedge Pattern Breakout
#9 Ford Motor Co. (NYSE: F)
Sector: Consumer Cyclical • Auto Manufacturers
Reason: Symmetrical Triangle Pattern Breakout
A symmetrical triangle is a chart pattern formed by two converging trend lines connecting a series of sequential peaks and troughs. These two lines result in the formation of a triangle that appears to be symmetrical.
A symmetrical triangle pattern is usually formed when there is indecision in the price movements and there is uncertainty among the buyers and sellers. This chart pattern represents a period of consolidation before the price breaks out or breaks down. In case a breakout occurs from the upper trend line, it is a strong bullish indication as it signifies the start of a new bullish trend.
Buy Level(s): The stock has currently broken out of a symmetrical triangle pattern. However, the ideal buy level for F is if the stock closes above the immediate resistance level of $12.30. This is marked in the chart below as a green color dotted line.
Daily chart – F
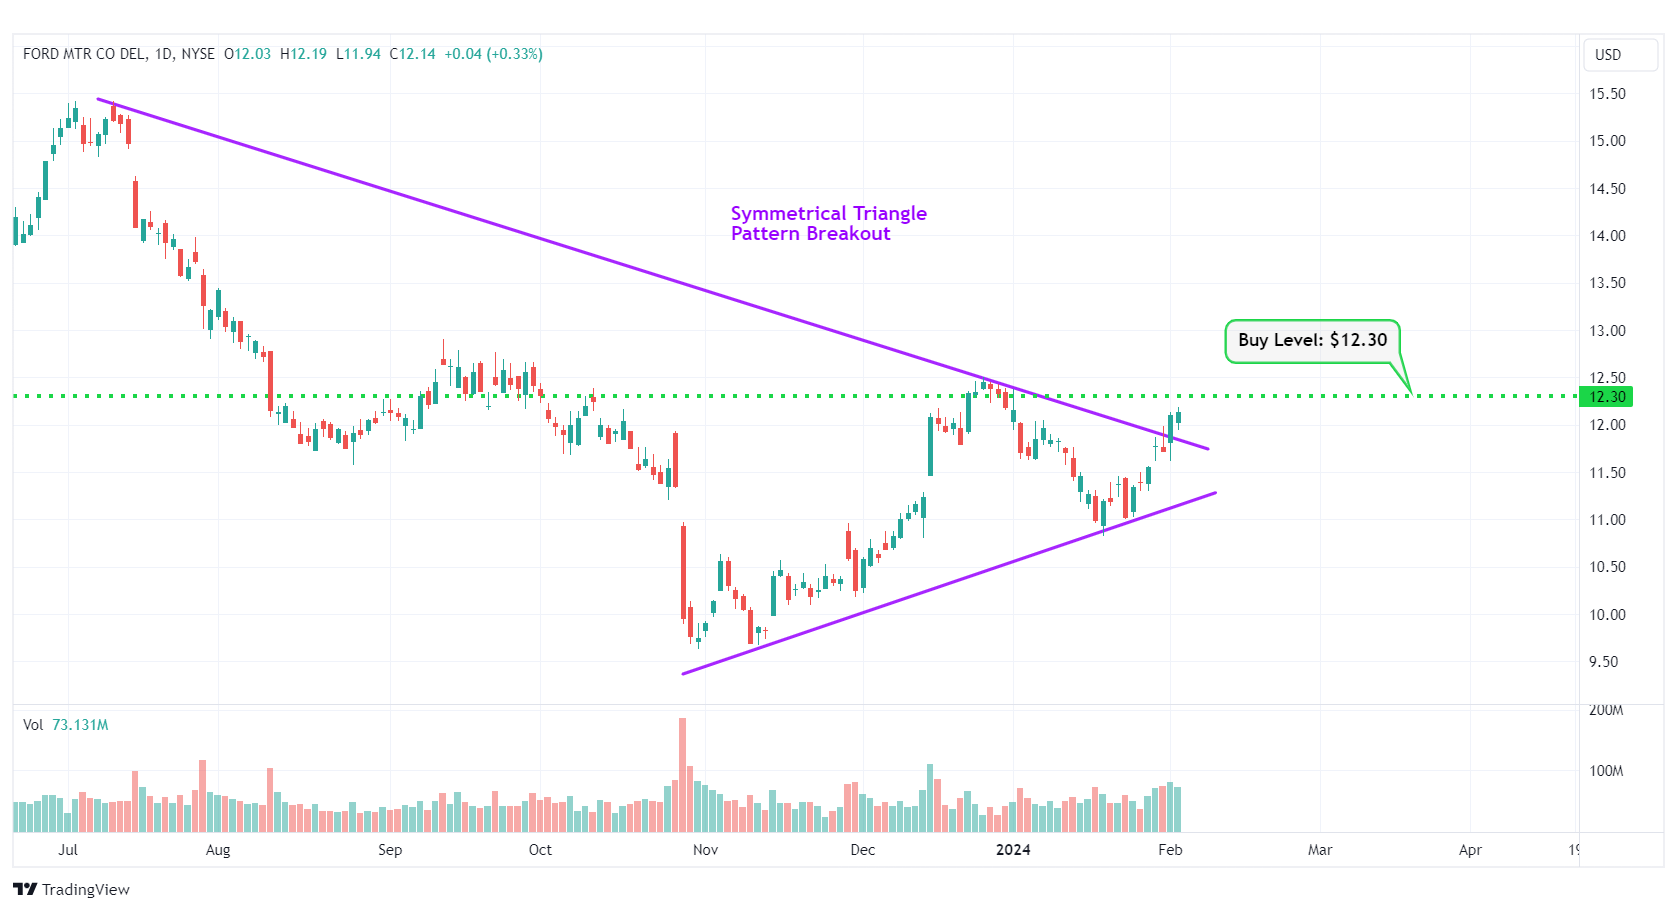
F – Symmetrical Triangle Pattern Breakout
#10 Chevron Corp. (NYSE: CVX)
Sector: Energy • Oil & Gas Integrated
Reason: Falling Wedge Pattern Breakout
A falling wedge pattern is formed by joining two downward-sloping, converging trendlines having a contracting range. The pattern appears to be wide at the top and continues to contract as prices fall. A breakout from a falling wedge pattern can indicate either reversal or continuation depending on where the pattern appeared in the trend.
A stock that has broken out of a falling wedge pattern would have gained momentum and would have the potential to move higher.
Buy Level(s): The stock has currently broken out of a falling wedge pattern. However, the ideal buy level for CVX is above the nearest resistance level of $152.60. This is marked in the chart below as a green color dotted line.
Daily chart – CVX
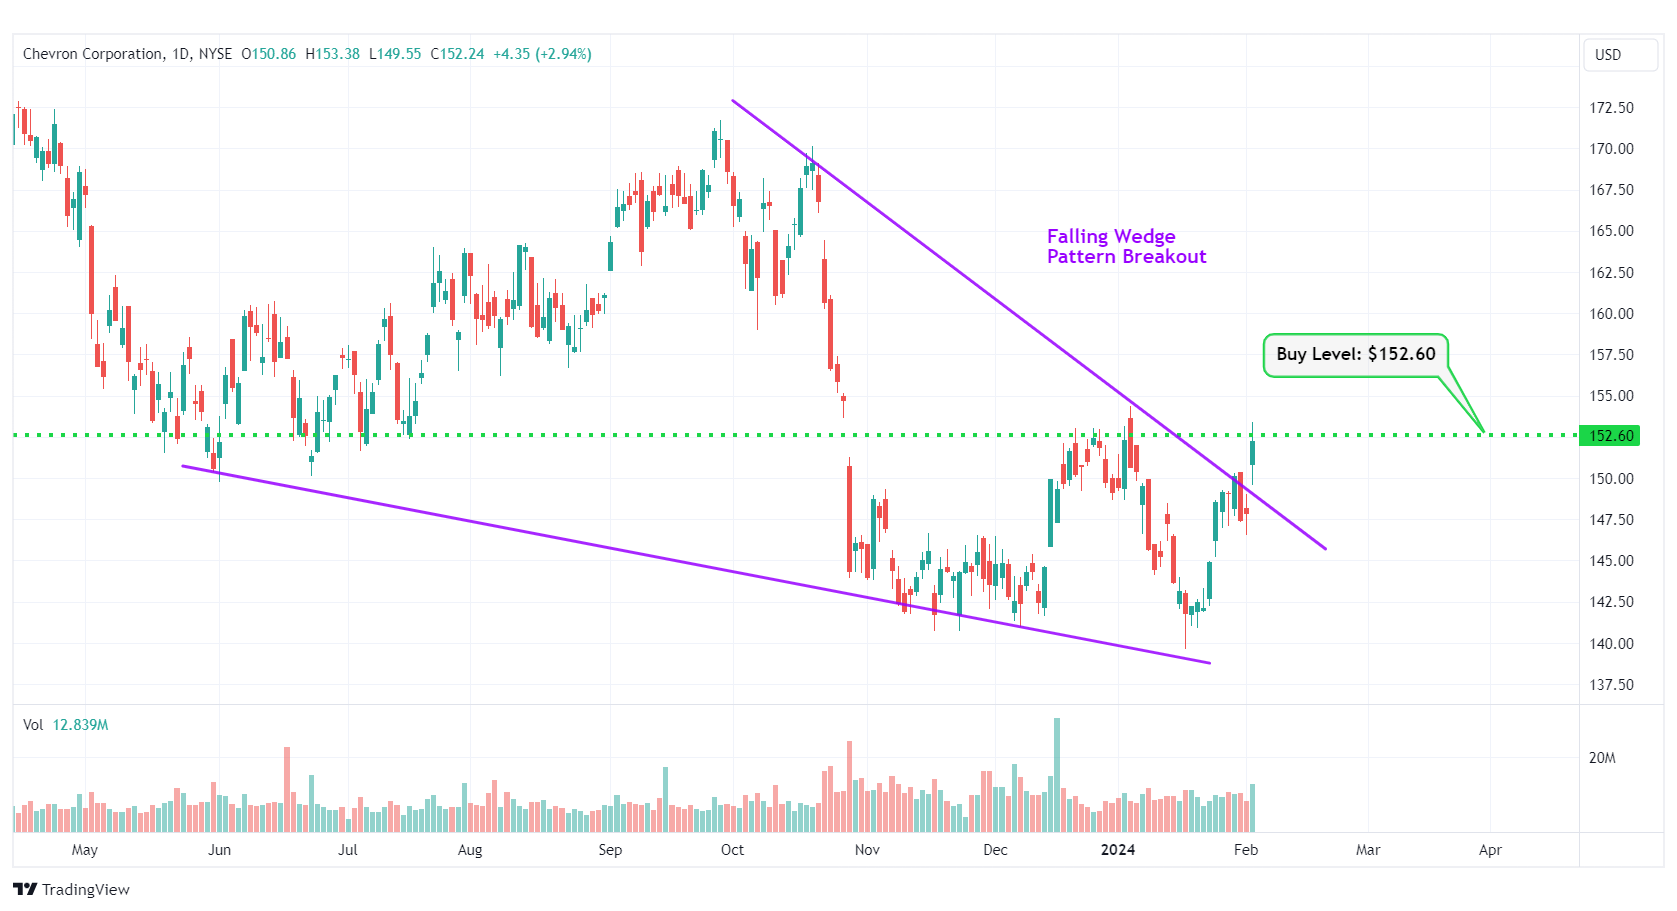
CVX – Falling Wedge Pattern Breakout
Happy Trading!
Trades of The Day Research Team
The company manufacturing Nvidia's AI servers trades under a secret name. AI revenue: $30B this year. Stock price: $8. Click for the hidden identity →
Source: Trades of the Day
