
HomeStreet, Inc. (NASDAQ: HMST) seems to be poised for a price surge as per its latest charts. The company operates as the bank holding company for HomeStreet Bank, which provides commercial, mortgage, and consumer/retail banking services primarily in the Western United States.
The company offers personal and business checking, savings accounts, interest-bearing, money market accounts, and certificates of deposit; credit cards; insurance; and cash management services.
Bullish Indications
#1 Double Bottom Pattern Breakout: As you can see from the daily chart below, the stock has currently broken out of a double bottom pattern with a high volume. This is marked in purple color. A double bottom pattern is a bullish reversal pattern, and a breakout from it indicates that the stock could move upwards.
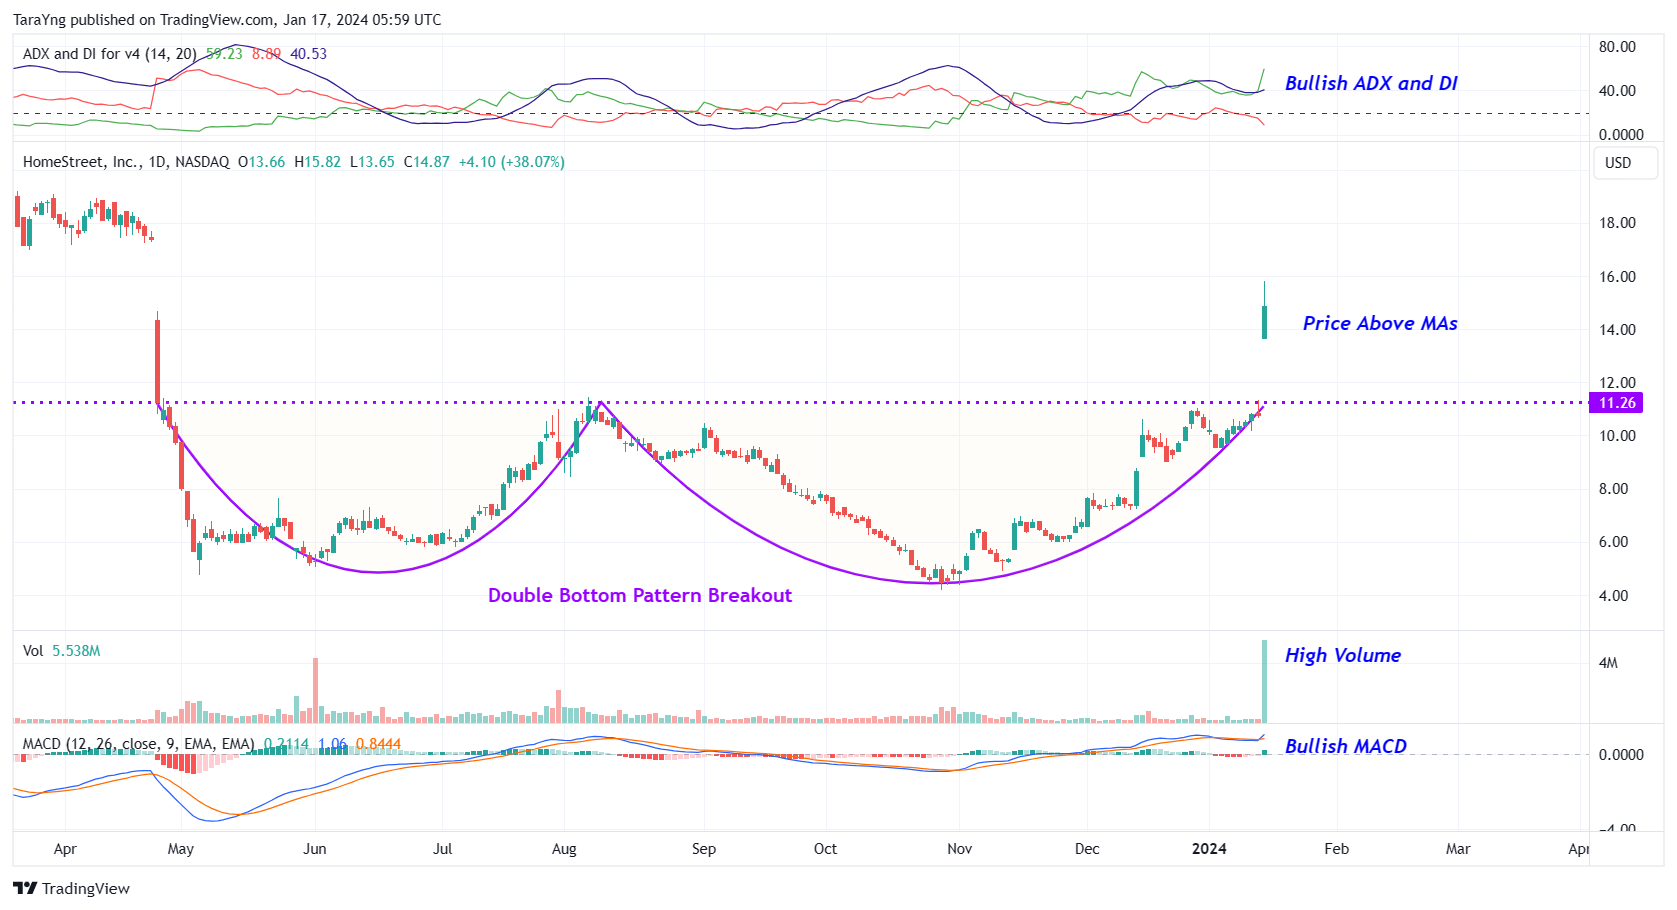
HMST – Daily Chart
#2 Price above MAs: The price is currently above the short-term moving average of 50-day SMA as well as the longer-term moving average of 200-day SMA, indicating that the bulls are still in control. This is a positive indication.
#3 MACD Above Signal Line: In the daily chart, the MACD line (light blue color) is currently above the MACD signal line (orange color) which is typically considered bullish.
#4 Bullish ADX: The ADX indicator shows that the +DI line is currently above the –DI line and the ADX line has started to move up from below the –DI and +DI lines. This indicates possible bullishness.
#5 Above Support Area: As you can see from the weekly chart, the stock has currently moved up from a resistance-turned-support level. This level is marked as a pink color dotted line. This looks like a good area for the stock to move higher. The stock is also trading above its 50-week SMA, indicating that the bulls are gaining control.
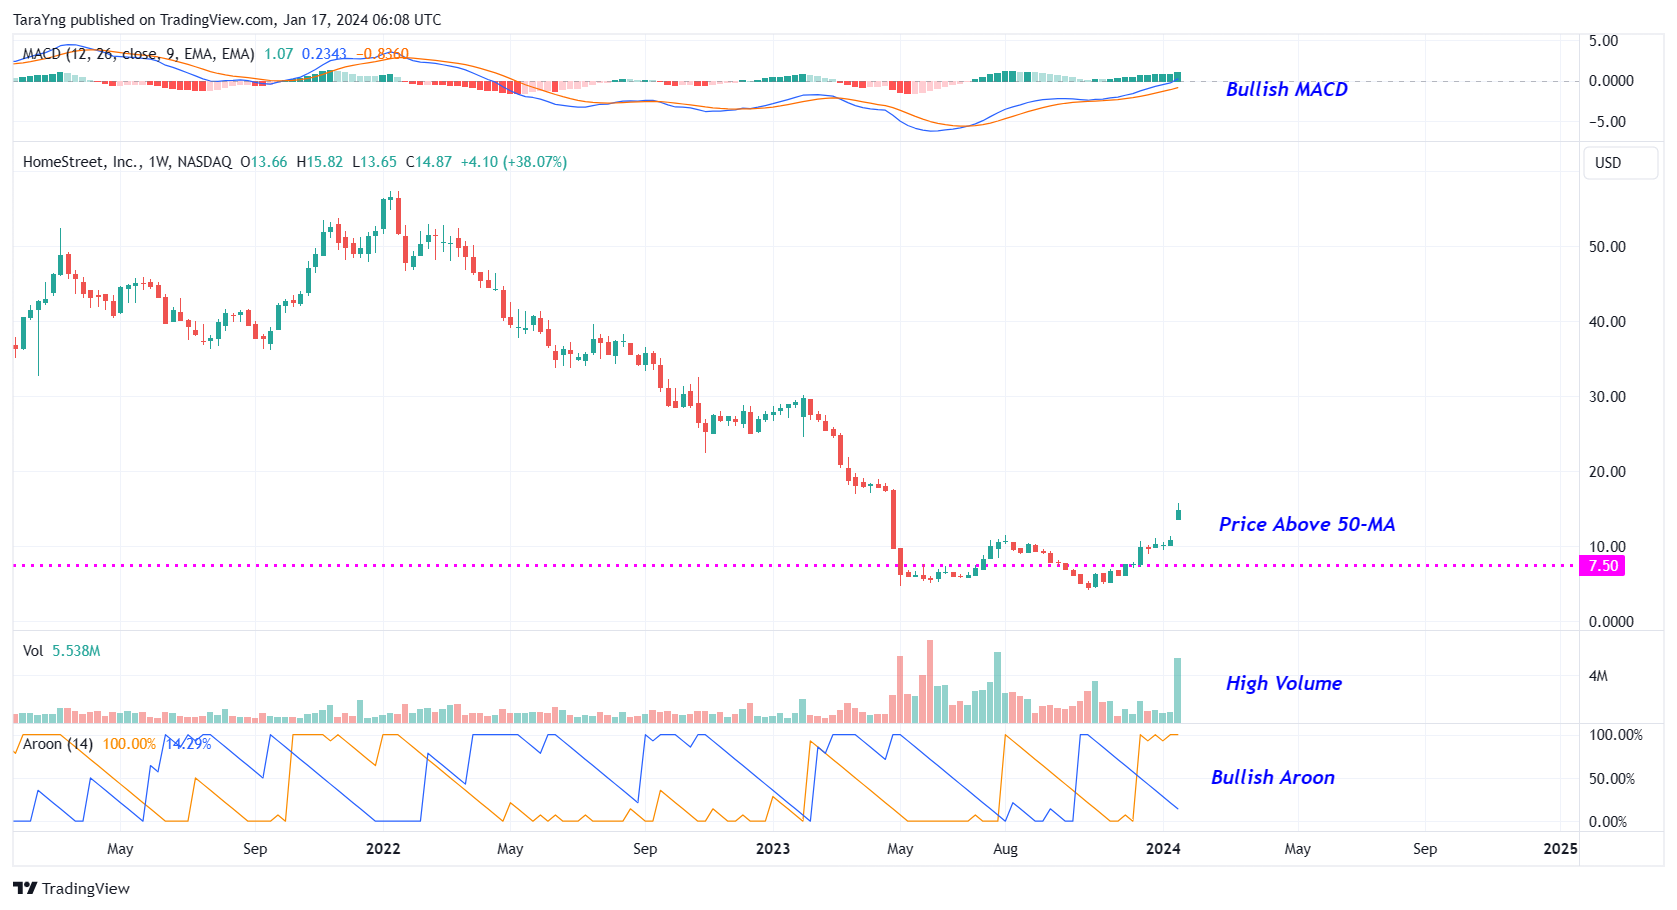
HMST – Weekly Chart
#6 Bullish MACD: The MACD line is above the MACD signal line in the weekly chart as well, indicating bullishness.
#7 Bullish Aroon: The value of Aroon Up (orange line) is above 70 while Aroon Down (blue line) is below 30 in the weekly chart. This indicates possible bullishness.
Recommended Trade (based on the charts)
Buy Levels: If you want to get in on this trade, you can purchase shares of HMST above the price of around $15.30.
TP: Our target prices are $17.50 and $19.50 in the next 3-6 months.
SL: To limit risk, place stop-loss at $14.00. Note that the stop-loss is on a closing basis.
Our target potential upside is 14% to 27% in the next 3 to 6 months.
For a risk of $1.30, our target rewards are $2.20 and $4.20. This is a nearly 1:2 and 1:3 risk-reward trade.
In other words, this trade offers nearly 2x to 3x more potential upside than downside.
Risks to Consider
The stock may reverse its overall trend if it breaks down from the double bottom pattern with a high volume. The sell-off of the stock could also be triggered in case of any negative news, overall weakness in the market, or any regulatory changes in the sector.
Happy Trading!
Tara
The company manufacturing Nvidia's AI servers trades under a secret name. AI revenue: $30B this year. Stock price: $8. Click for the hidden identity →
Source: Trades of the Day
