
Picking a winning trade on a consistent basis is not simply a stroke of luck. It’s the result of calculated screening, planning, and deliberation.
With this in mind, we have started a new weekly series on our top 10 stocks to watch this week — stocks that look poised for a possible breakout in the coming days. Traders should add these stocks to their watchlist now.
The Top 10 Stocks to Watch This Week for Possible Breakouts
| Sl # | Name of the Stock | Stock Ticker | Last Close | Buy Level(s) | Reason |
| 1 | Physicians Realty Trust | NYSE: DOC | $13.76 | $14.00 | Symmetrical Triangle Pattern Breakout |
| 2 | International Business Machines Corp. | NYSE: IBM | $165.80 | $166.00 | Flag Pattern Breakout |
| 3 | Healthpeak Properties Inc. | NYSE: PEAK | $20.84 | $21.20 | Symmetrical Triangle Pattern Breakout |
| 4 | Zeta Global Holdings Corp | NYSE: ZETA | $9.65 | $9.90 | Breakout From Consolidation Area |
| 5 | Energy Fuels Inc. | AMEX: UUUU | $7.66 | $8.00 | Symmetrical Triangle Pattern |
| 6 | Blackrock Inc. | NYSE: BLK | $799.60 | $813.60 | Flag Pattern |
| 7 | T. Rowe Price Group Inc. | NASDAQ: TROW | $110.49 | $111.70 | Symmetrical Triangle Pattern Breakout |
| 8 | Interactive Brokers Group Inc. | NASDAQ: IBKR | $88.36 | $88.90 | Downtrend Channel Breakout |
| 9 | Veeva Systems Inc. | NYSE: VEEV | $208.69 | $210.10 | Symmetrical Triangle Pattern Breakout |
| 10 | Braze Inc. | NASDAQ: BRZE | $53.37 | $55.30 | Flag Pattern |
Important: Typically, these trades offer a risk: reward ratio of 1:2 or 1:3 in the next 6 months, which implies 2x to 3x rewards when compared to risks. So, be sure to set your stop-loss levels and target prices accordingly to manage your risk. In addition, these trade ideas are triggered using daily closing prices, not intra-day pricing. So, if you participate in these trades, make sure that you only buy the stock once its daily close is above the recommended price level.
That said, here are the top 10 stocks to watch for a breakout, in no particular order.
#1 Physicians Realty Trust (NYSE: DOC)
Sector: Real Estate • REIT – Healthcare Facilities
Reason: Symmetrical Triangle Pattern Breakout
A symmetrical triangle is a chart pattern formed by two converging trend lines connecting a series of sequential peaks and troughs. These two lines result in the formation of a triangle that appears to be symmetrical.
A symmetrical triangle pattern is usually formed when there is indecision in the price movements and there is uncertainty among the buyers and sellers. This chart pattern represents a period of consolidation before the price breaks out or breaks down. In case a breakout occurs from the upper trend line, it is a strong bullish indication as it signifies the start of a new bullish trend.
Buy Level(s): The stock has currently broken out of a symmetrical triangle pattern. However, the ideal buy level for DOC is if the stock closes above the immediate resistance level of $14.00. This is marked in the chart below as a green color dotted line.
Daily chart – DOC
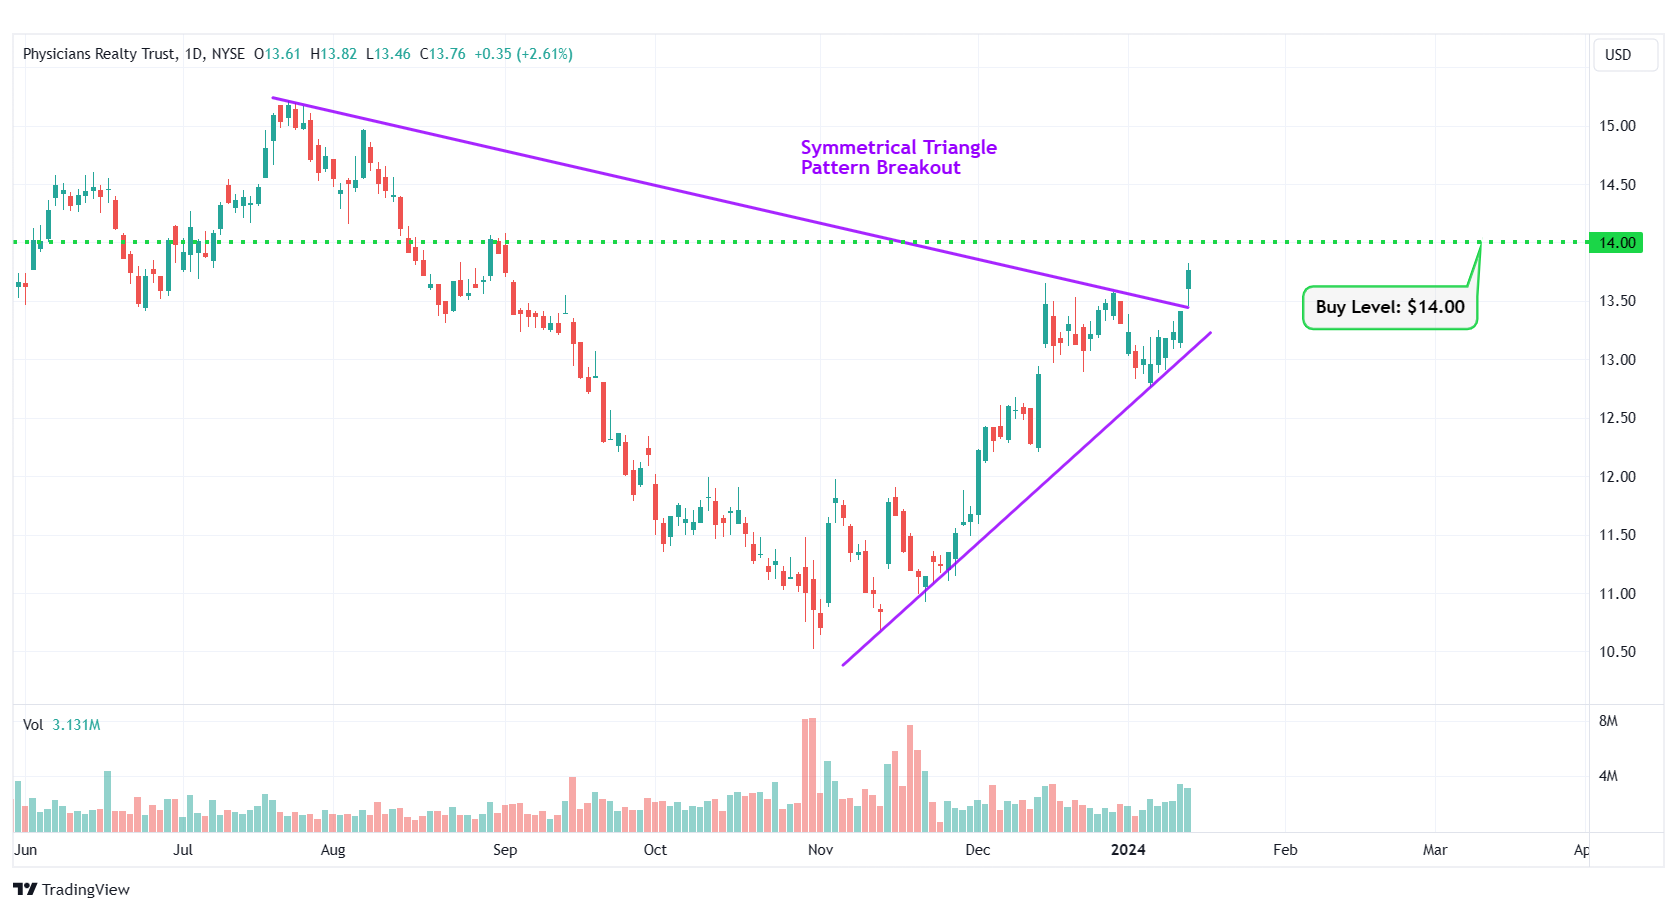
DOC – Symmetrical Triangle Pattern Breakout
#2 International Business Machines Corp. (NYSE: IBM)
Sector: Technology • Information Technology Services
Reason: Breakout From a Flag Pattern
A flag pattern is a short-term continuation pattern that marks a small consolidation before the previous move resumes. The pattern is formed when the market consolidates in a narrow range after a sharp move. For a stock in an uptrend, a breakout from this pattern is typically a strong bullish indication.
Buy Level(s): Although the stock has currently broken out of the flag pattern, the ideal buy level for IBM is above the near-term resistance level of $166.00. This is marked in the chart below as a green color dotted line.
Daily chart – IBM

IBM – Flag Pattern Breakout
#3 Healthpeak Properties Inc. (NYSE: PEAK)
Sector: Real Estate • REIT – Healthcare Facilities
Reason: Symmetrical Triangle Pattern Breakout
A symmetrical triangle is a chart pattern formed by two converging trend lines connecting a series of sequential peaks and troughs. These two lines result in the formation of a triangle that appears to be symmetrical.
A symmetrical triangle pattern is usually formed when there is indecision in the price movements and there is uncertainty among the buyers and sellers. This chart pattern represents a period of consolidation before the price breaks out or breaks down. In case a breakout occurs from the upper trend line, it is a strong bullish indication as it signifies the start of a new bullish trend.
Buy Level(s): The stock has currently broken out of a symmetrical triangle pattern. However, the ideal buy level for PEAK is if the stock closes above the immediate resistance level of $21.20. This is marked in the chart below as a green color dotted line.
Daily chart – PEAK

PEAK – Symmetrical Triangle Pattern Breakout
#4 Zeta Global Holdings Corp (NYSE: ZETA)
Sector: Technology • Software – Application
Reason: Breakout From a Consolidation Area in the Daily Chart
A Consolidation Area is a price action contained between two parallel lines. It is formed by a lower line that connects the lows, and an upper line that joins the highs. A stock usually trades between the two lines of the consolidation area before finally breaking out from the upper rail.
Buy Level(s): Although the stock has currently broken out of a consolidation area, the ideal buy level for ZETA is above the near-term resistance area, which translates to a price of around $9.90. This is marked in the chart below as a green color dotted line.
Daily chart – ZETA
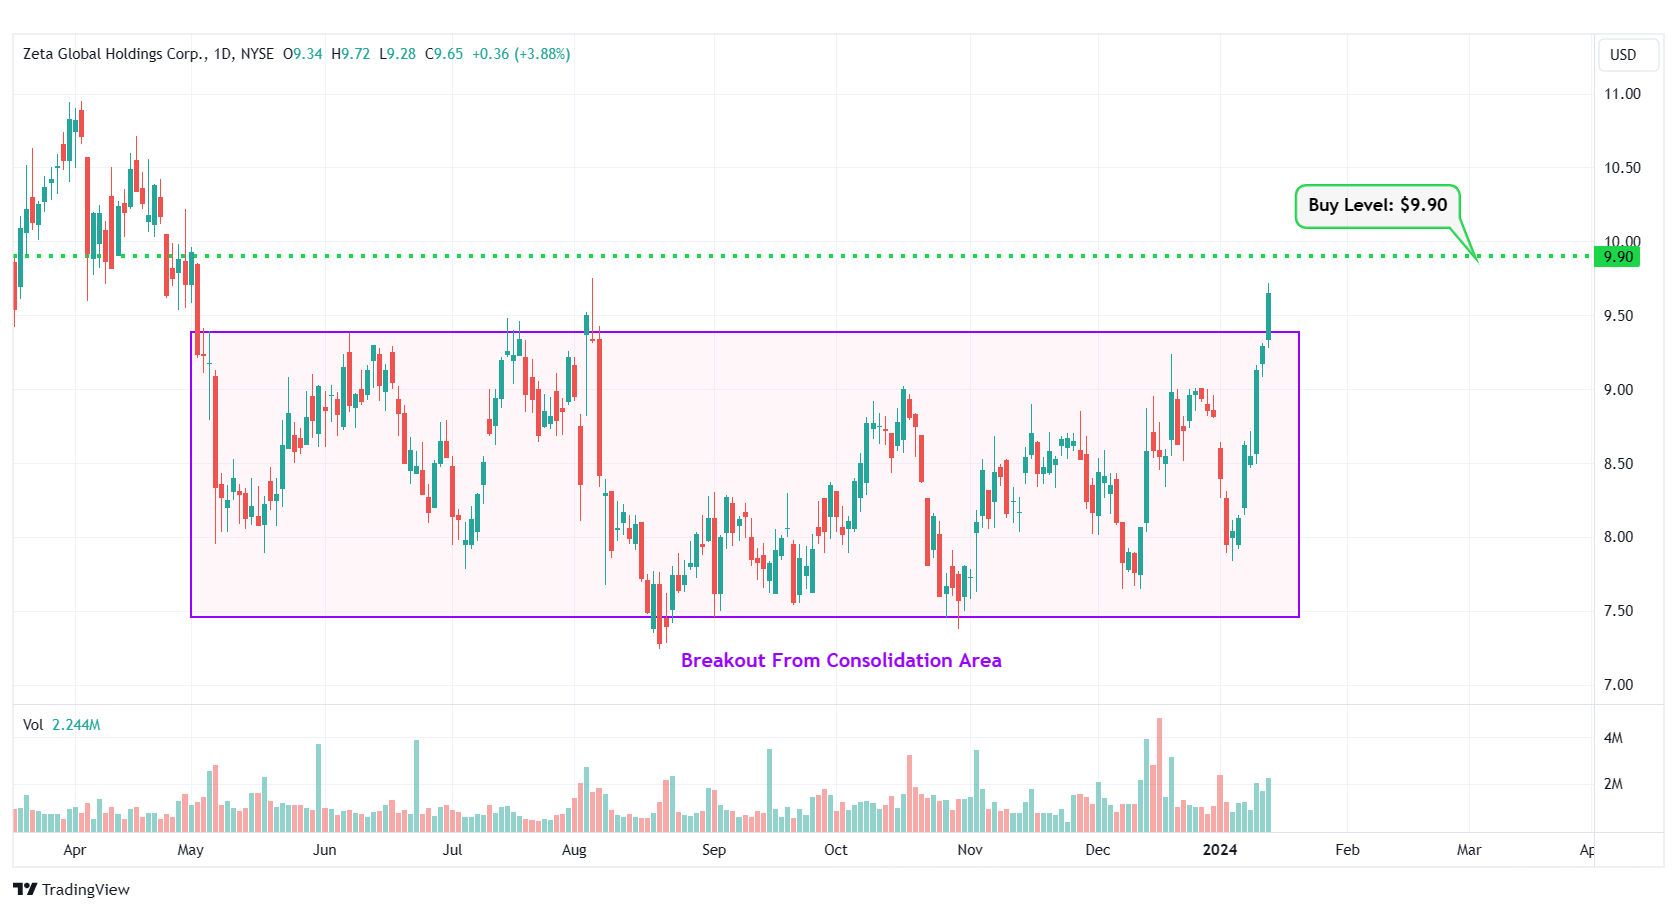
ZETA – Breakout From Consolidation Area
#5 Energy Fuels Inc. (AMEX: UUUU)
Sector: Energy • Uranium
Reason: Formation of a Symmetrical Triangle Pattern
A symmetrical triangle is a chart pattern formed by two converging trend lines connecting a series of sequential peaks and troughs. These two lines result in the formation of a triangle that appears to be symmetrical.
A symmetrical triangle pattern is usually formed when there is indecision in the price movements and there is uncertainty among the buyers and sellers. This chart pattern represents a period of consolidation before the price breaks out or breaks down. In case a breakout occurs from the upper trend line, it is a strong bullish indication as it signifies the start of a new bullish trend.
Buy Level(s): The ideal buy level for UUUU is if the stock has a daily close above the breakout level of the symmetrical triangle pattern, at around $8.00. This is marked in the chart below as a green color dotted line.
Daily chart – UUUU

UUUU – Symmetrical Triangle Pattern
#6 Blackrock Inc. (NYSE: BLK)
Sector: Financial • Asset Management
Reason: Formation of a Flag Pattern
A flag pattern is a short-term continuation pattern that marks a small consolidation before the previous move resumes. The pattern is formed when the market consolidates in a narrow range after a sharp move. For a stock in an uptrend, a breakout from this pattern is typically a strong bullish indication.
Buy Level(s): The ideal buy level for BLK is if the stock breaks out of the flag pattern, at around $813.60. This is marked in the chart below as a green color dotted line.
Daily chart – BLK
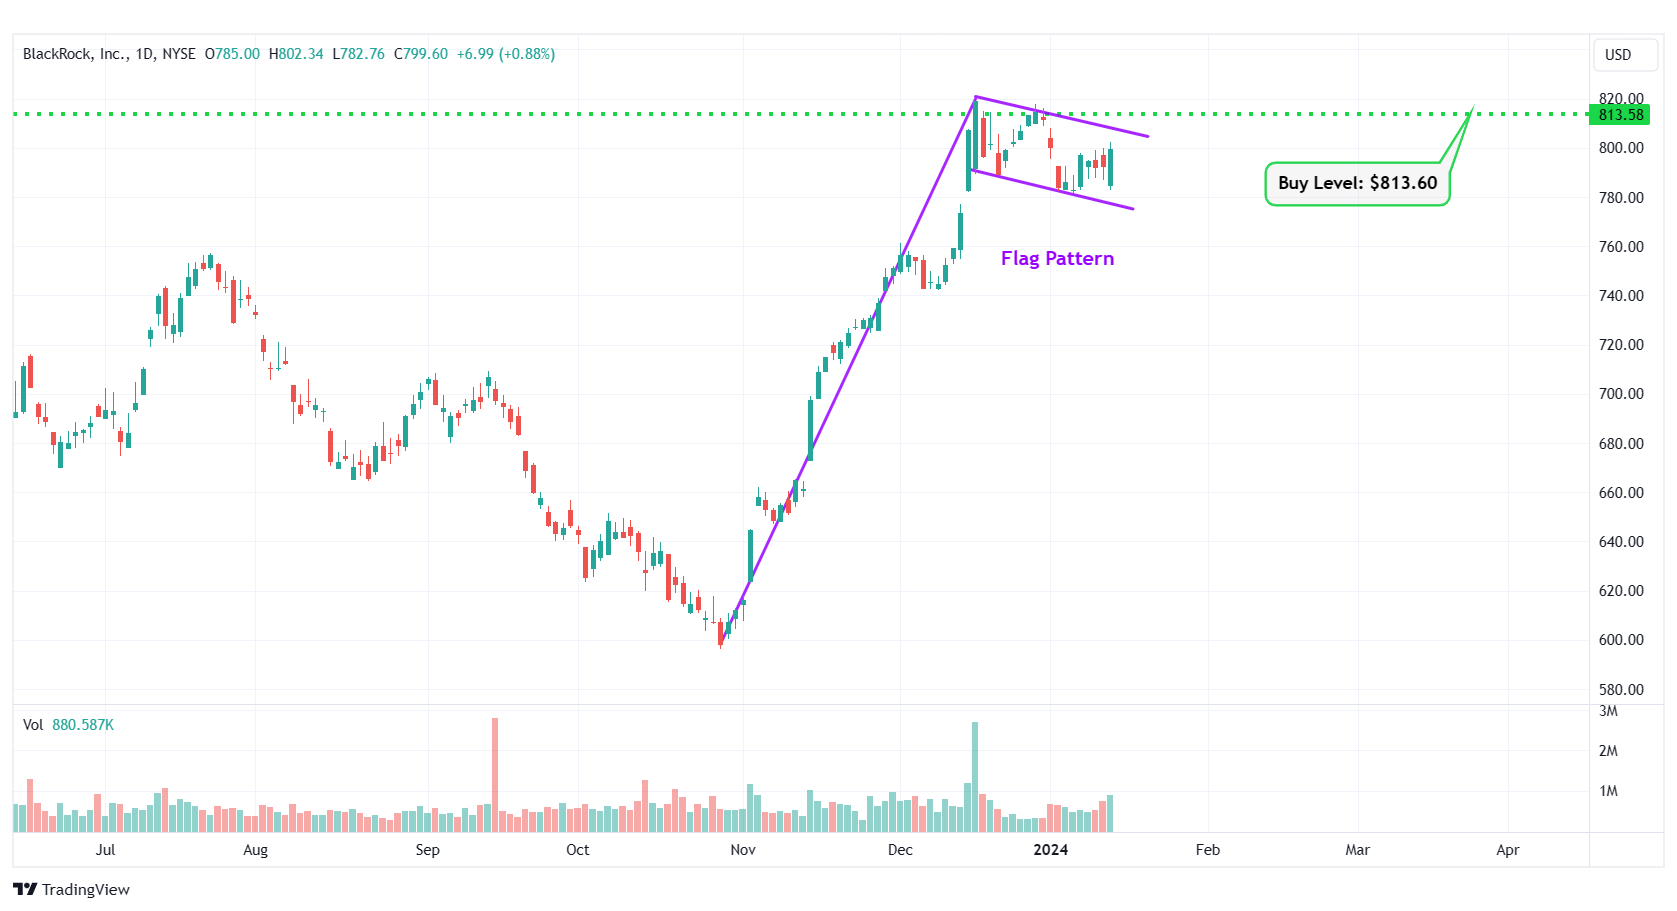
BLK – Flag Pattern
#7 T. Rowe Price Group Inc. (NASDAQ: TROW)
Sector: Financial • Asset Management
Reason: Symmetrical Triangle Pattern Breakout
A symmetrical triangle is a chart pattern formed by two converging trend lines connecting a series of sequential peaks and troughs. These two lines result in the formation of a triangle that appears to be symmetrical.
A symmetrical triangle pattern is usually formed when there is indecision in the price movements and there is uncertainty among the buyers and sellers. This chart pattern represents a period of consolidation before the price breaks out or breaks down. In case a breakout occurs from the upper trend line, it is a strong bullish indication as it signifies the start of a new bullish trend.
Buy Level(s): The stock has currently broken out of a symmetrical triangle pattern. However, the ideal buy level for TROW is if the stock closes above the immediate resistance level of $111.70. This is marked in the chart below as a green color dotted line.
Daily chart – TROW
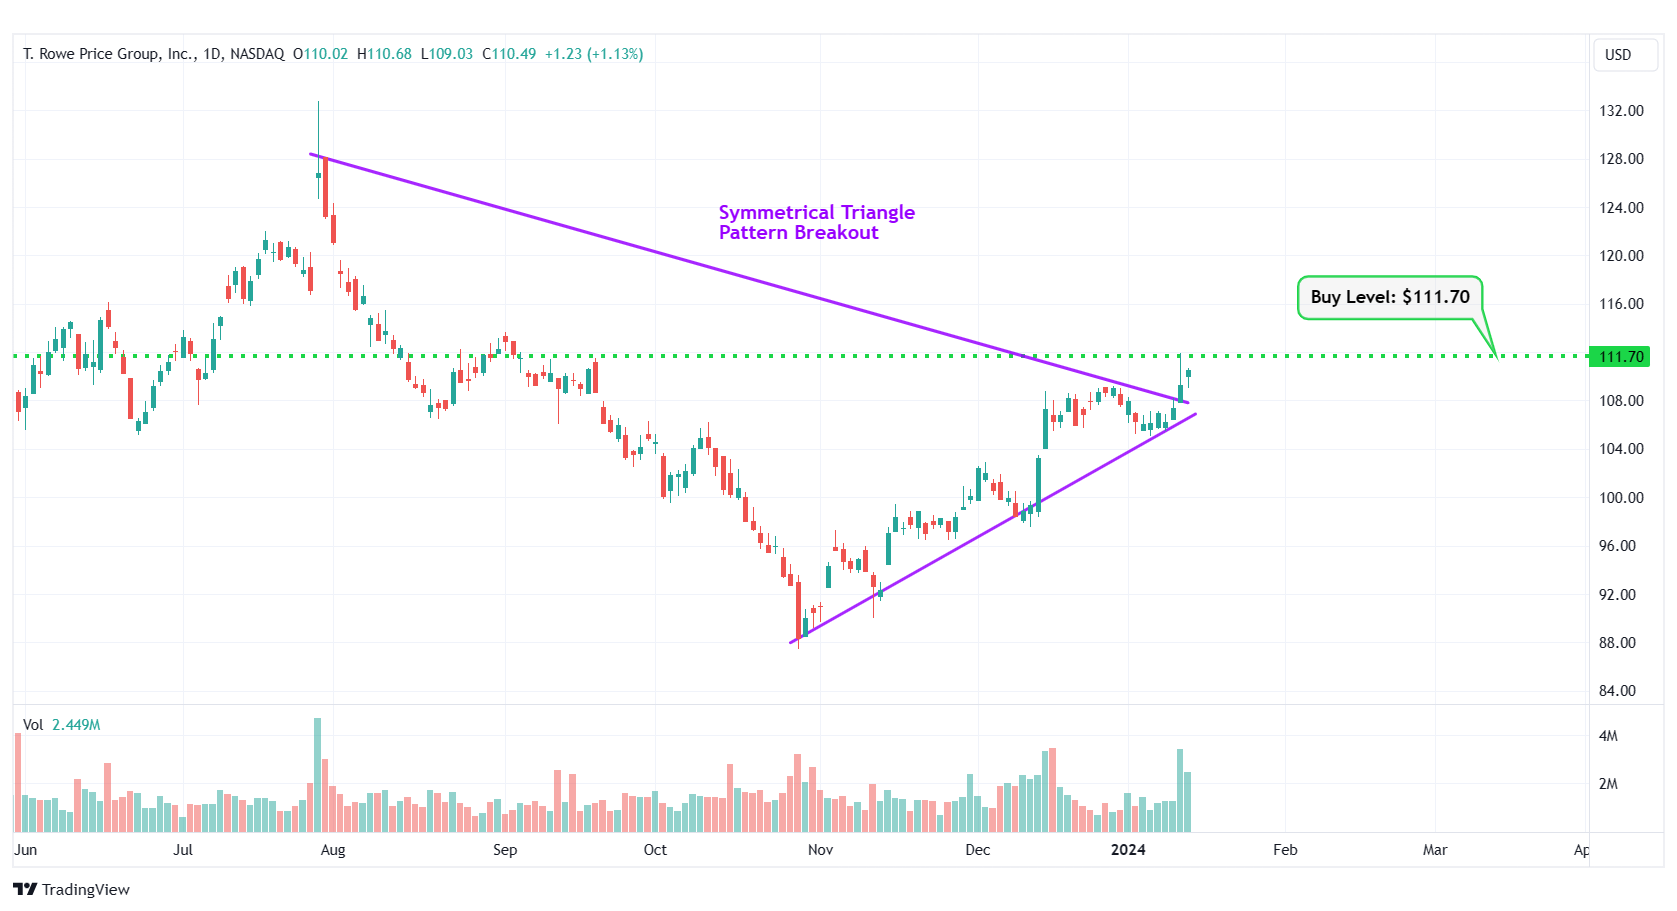
TROW – Symmetrical Triangle Pattern Breakout
#8 Interactive Brokers Group Inc. (NASDAQ: IBKR)
Sector: Financial • Capital Markets
Reason: Downtrend Channel Breakout
A downtrend or descending channel is the price action contained between downward sloping parallel lines. It is formed by two lines that are drawn by connecting the lower highs and lower lows of a stock’s price. Even though this is typically a bearish pattern, a breakout from the upper rail of this pattern is considered a good bullish indication.
Buy Level(s): The daily chart shows that the stock has currently broken out of a downtrend channel. However, there is a near-term resistance level for the stock. Hence, the ideal buy level for IBKR is if the stock has a daily close above $88.90. This is marked in the chart below as a green color dotted line.
Daily chart – IBKR
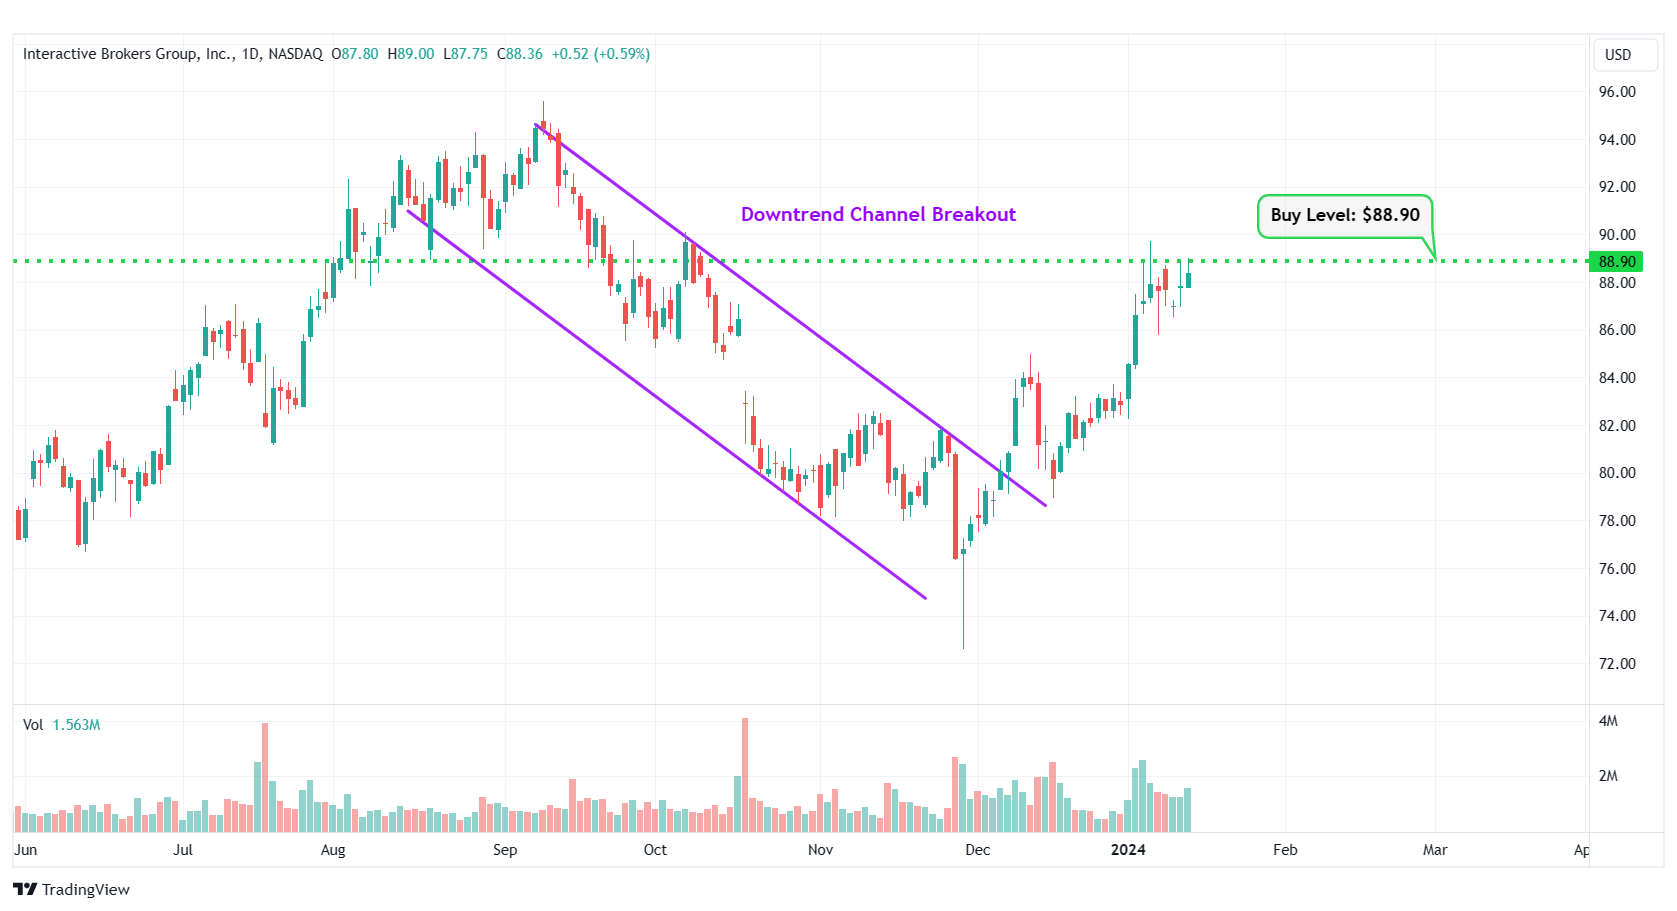
IBKR – Downtrend Channel Breakout
#9 Veeva Systems Inc. (NYSE: VEEV)
Sector: Healthcare • Health Information Services
Reason: Symmetrical Triangle Pattern Breakout
A symmetrical triangle is a chart pattern formed by two converging trend lines connecting a series of sequential peaks and troughs. These two lines result in the formation of a triangle that appears to be symmetrical.
A symmetrical triangle pattern is usually formed when there is indecision in the price movements and there is uncertainty among the buyers and sellers. This chart pattern represents a period of consolidation before the price breaks out or breaks down. In case a breakout occurs from the upper trend line, it is a strong bullish indication as it signifies the start of a new bullish trend.
Buy Level(s): The stock has currently broken out of a symmetrical triangle pattern. However, the ideal buy level for VEEV is if the stock closes above the immediate resistance level of $210.10. This is marked in the chart below as a green color dotted line.
Daily chart – VEEV
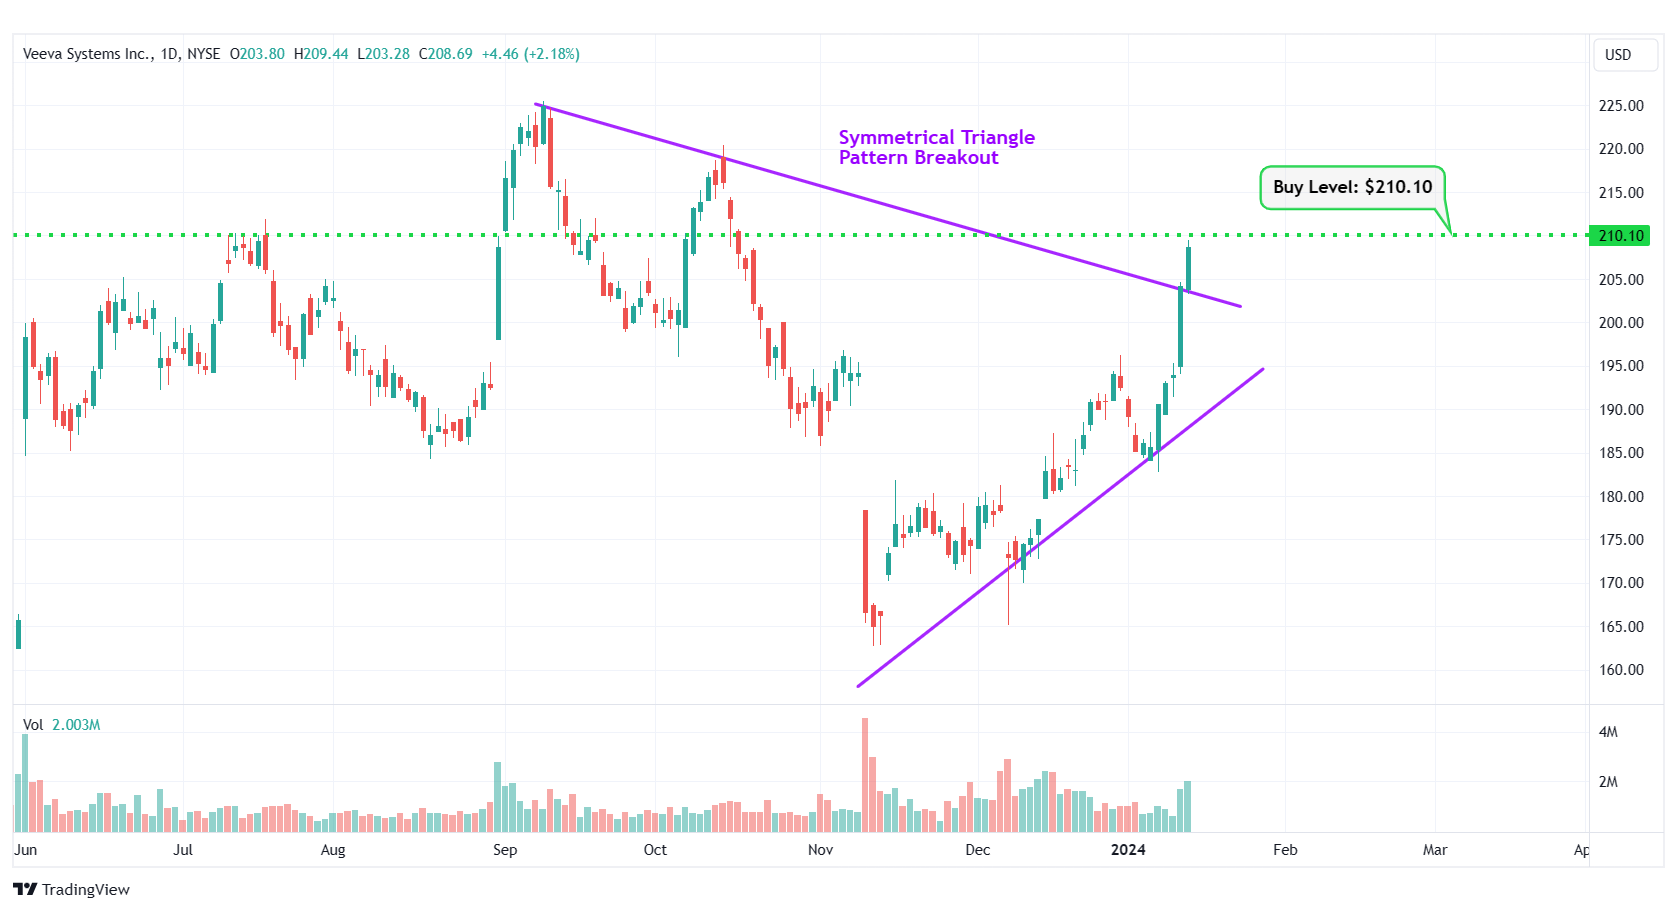
VEEV – Symmetrical Triangle Pattern Breakout
#10 Braze Inc. (NASDAQ: BRZE)
Sector: Technology • Software – Application
Reason: Formation of a Flag Pattern
A flag pattern is a short-term continuation pattern that marks a small consolidation before the previous move resumes. The pattern is formed when the market consolidates in a narrow range after a sharp move. For a stock in an uptrend, a breakout from this pattern is typically a strong bullish indication.
Buy Level(s): The ideal buy level for BRZE is if the stock breaks out of the flag pattern, at around $55.30. This is marked in the chart below as a green color dotted line.
Daily chart – BRZE

BRZE – Flag Pattern
Happy Trading!
Trades of The Day Research Team
The company manufacturing Nvidia's AI servers trades under a secret name. AI revenue: $30B this year. Stock price: $8. Click for the hidden identity →
Source: Trades of the Day
