
Picking a winning trade on a consistent basis is not simply a stroke of luck. It’s the result of calculated screening, planning, and deliberation.
With this in mind, we have started a new weekly series on our top 10 stocks to watch this week — stocks that look poised for a possible breakout in the coming days. Traders should add these stocks to their watchlist now.
The Top 10 Stocks to Watch This Week for Possible Breakouts
| Sl # | Name of the Stock | Stock Ticker | Last Close | Buy Level(s) | Reason |
| 1 | Carlyle Secured Lending, Inc. | NASDAQ: CGBD | $15.65 | $15.80 | Ascending Triangle Pattern |
| 2 | Marvell Technology Inc. | NASDAQ: MRVL | $59.92 | $61.60 | Symmetrical Triangle Pattern |
| 3 | Mitsubishi UFJ Financial Group, Inc. ADR | NYSE: MUFG | $8.85 | $8.90 | Flag Pattern Breakout |
| 4 | Hexcel Corp. | NYSE: HXL | $71.47 | $74.70 | Symmetrical Triangle Pattern |
| 5 | Barclays plc ADR | NYSE: BCS | $8.03 | $8.20 | Downtrend Channel Breakout |
| 6 | Alight Inc. | NYSE: ALIT | $8.73 | $9.00 | Symmetrical Triangle Pattern Breakout |
| 7 | Graphic Packaging Holding Co | NYSE: GPK | $25.74 | $26.00 | Downtrend Channel Breakout |
| 8 | Syndax Pharmaceuticals Inc. | NASDAQ: SNDX | $21.49 | $22.40 | Symmetrical Triangle Pattern Breakout |
| 9 | DLocal Limited | NASDAQ: DLO | $17.67 | $18.50 | Falling Wedge Pattern |
| 10 | Toronto Dominion Bank | NYSE: TD | $86.08 | $86.60 | Symmetrical Triangle Pattern Breakout |
Important: Typically, these trades offer a risk: reward ratio of 1:2 or 1:3 in the next 6 months, which implies 2x to 3x rewards when compared to risks. So, be sure to set your stop-loss levels and target prices accordingly to manage your risk. In addition, these trade ideas are triggered using daily closing prices, not intra-day pricing. So, if you participate in these trades, make sure that you only buy the stock once its daily close is above the recommended price level.
That said, here are the top 10 stocks to watch for a breakout, in no particular order.
#1 Carlyle Secured Lending, Inc. (NASDAQ: CGBD)
Sector: Financial • Asset Management
Reason: Formation of an Ascending Triangle Pattern
An ascending triangle pattern is a bullish pattern formed by drawing a horizontal line along the swing highs, and a rising trendline along the swing lows. These two lines result in the formation of a triangle. A breakout from this pattern is typically a strong bullish indication.
Buy Level(s): The ideal buy level for CGBD is if the stock breaks out of the ascending triangle pattern and has a daily close above the near-term resistance level of $15.80. This is marked in the chart below as a green color dotted line.
Daily chart – CGBD
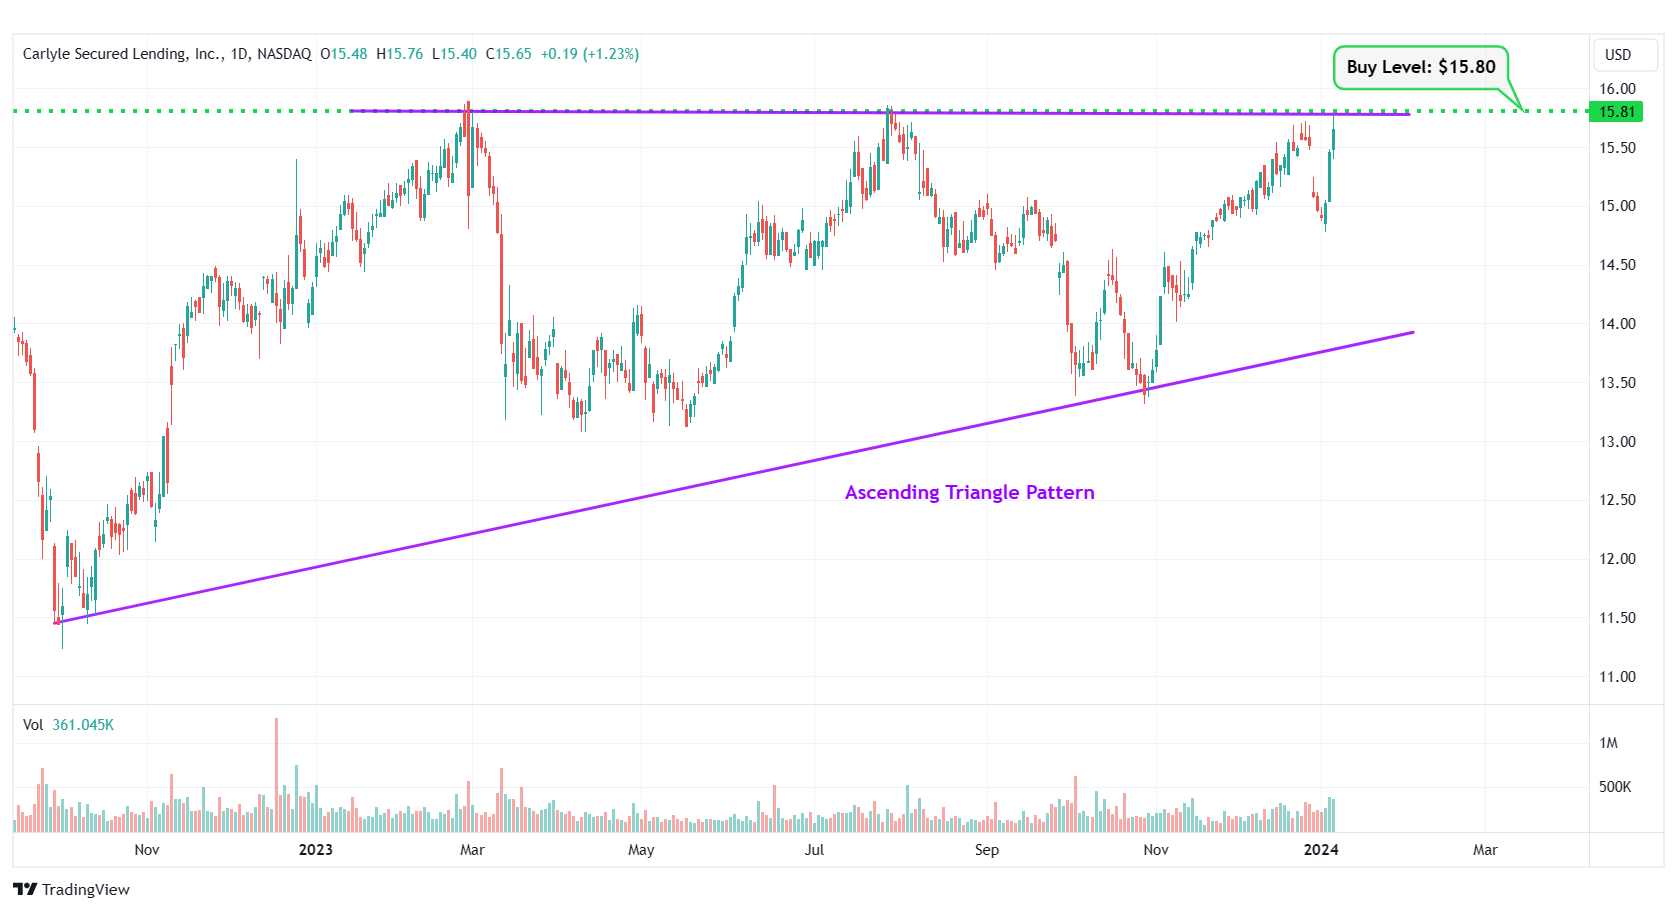
CGBD – Ascending Triangle Pattern
#2 Marvell Technology Inc. (NASDAQ: MRVL)
Sector: Technology • Semiconductors
Reason: Formation of a Symmetrical Triangle Pattern
A symmetrical triangle is a chart pattern formed by two converging trend lines connecting a series of sequential peaks and troughs. These two lines result in the formation of a triangle that appears to be symmetrical.
A symmetrical triangle pattern is usually formed when there is indecision in the price movements and there is uncertainty among the buyers and sellers. This chart pattern represents a period of consolidation before the price breaks out or breaks down. In case a breakout occurs from the upper trend line, it is a strong bullish indication as it signifies the start of a new bullish trend.
Buy Level(s): The ideal buy level for MRVL is if the stock has a daily close above the breakout level of the symmetrical triangle pattern, at around $61.60. This is marked in the chart below as a green color dotted line.
Daily chart – MRVL
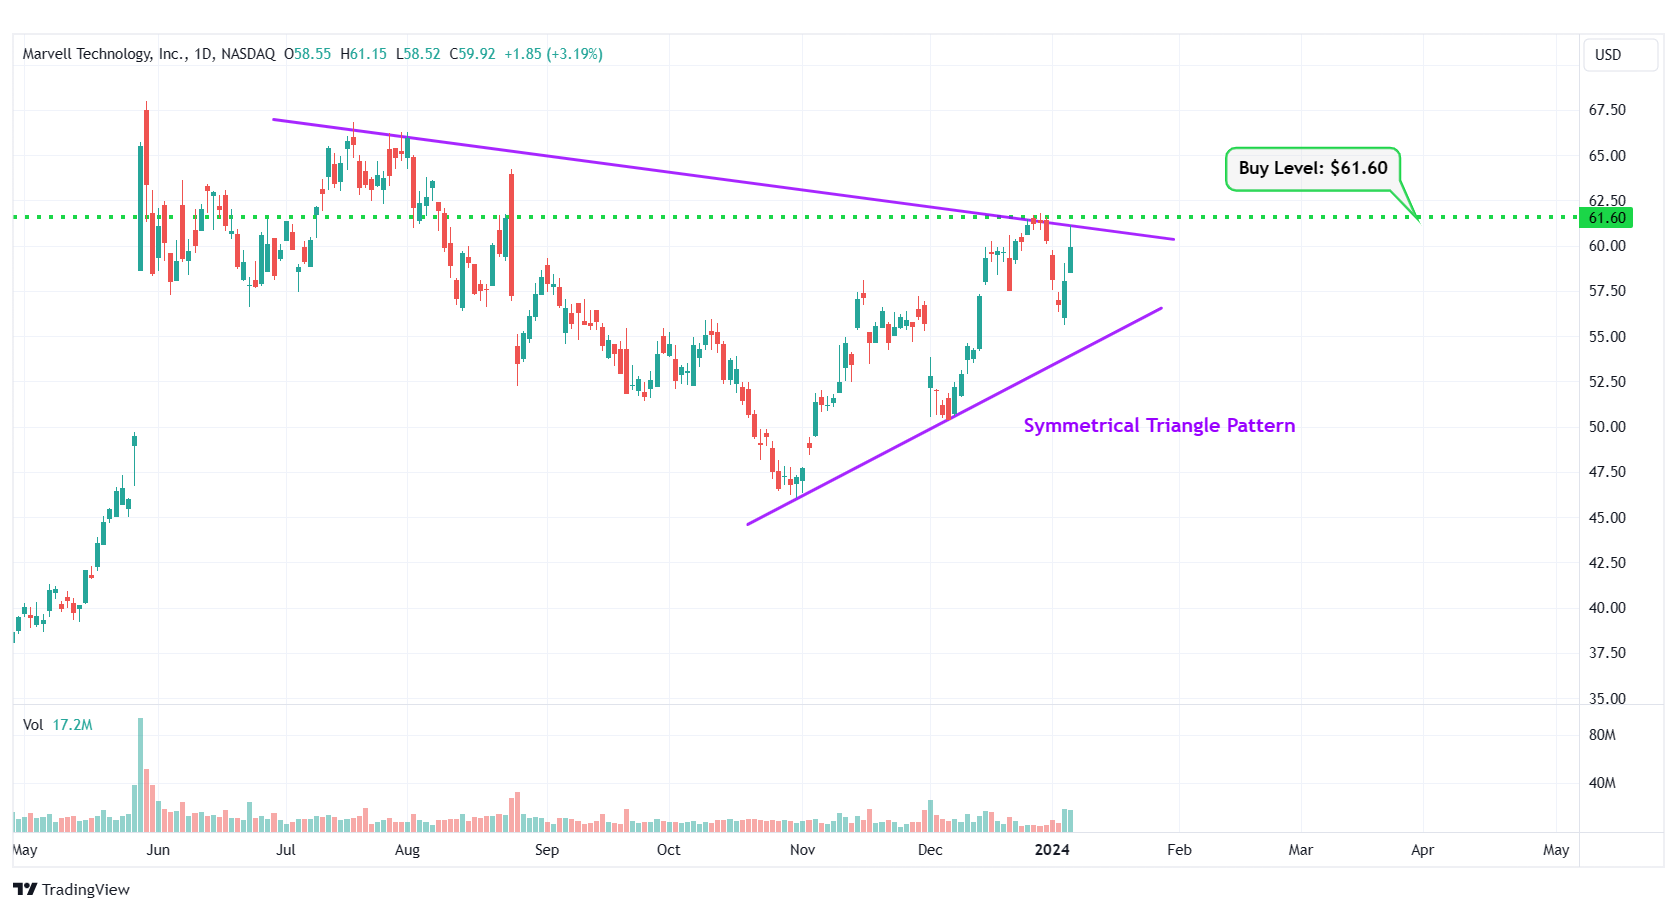
MRVL – Symmetrical Triangle Pattern
#3 Mitsubishi UFJ Financial Group, Inc. ADR (NYSE: MUFG)
Sector: Financial • Banks – Diversified
Reason: Breakout From a Flag Pattern
A flag pattern is a short-term continuation pattern that marks a small consolidation before the previous move resumes. The pattern is formed when the market consolidates in a narrow range after a sharp move. For a stock in an uptrend, a breakout from this pattern is typically a strong bullish indication.
Buy Level(s): Although the stock has currently broken out of the flag pattern, the ideal buy level for MUFG is above the near-term resistance level of $8.90. This is marked in the chart below as a green color dotted line.
Daily chart – MUFG
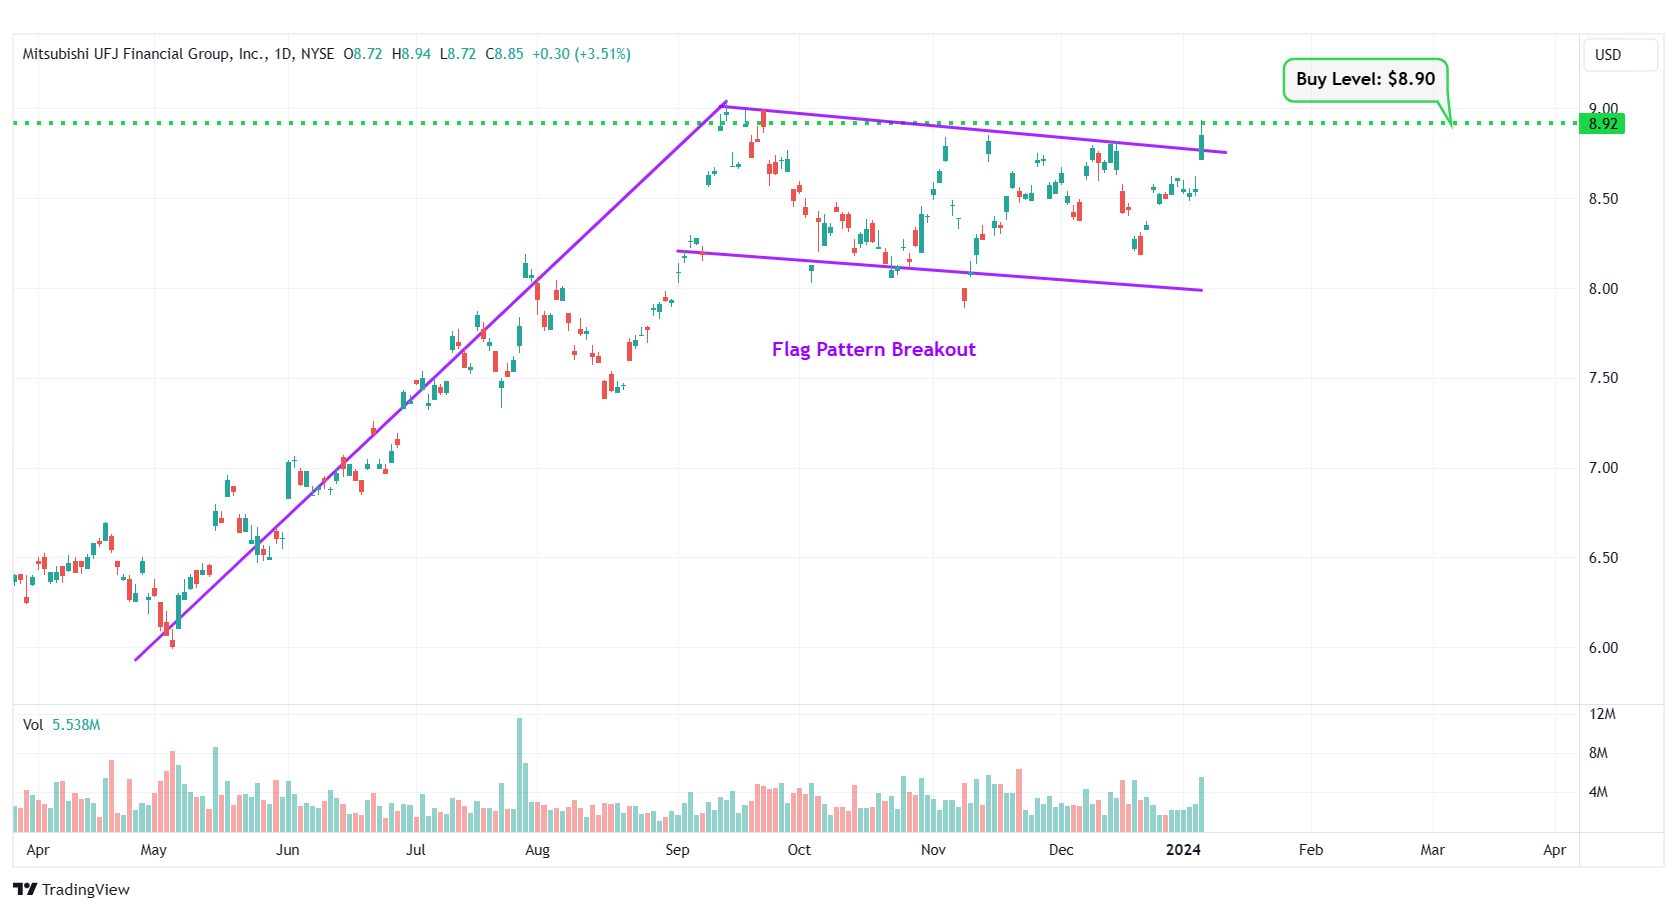
MUFG – Flag Pattern Breakout
#4 Hexcel Corp. (NYSE: HXL)
Sector: Industrials • Aerospace & Defense
Reason: Formation of a Symmetrical Triangle Pattern
A symmetrical triangle is a chart pattern formed by two converging trend lines connecting a series of sequential peaks and troughs. These two lines result in the formation of a triangle that appears to be symmetrical.
A symmetrical triangle pattern is usually formed when there is indecision in the price movements and there is uncertainty among the buyers and sellers. This chart pattern represents a period of consolidation before the price breaks out or breaks down. In case a breakout occurs from the upper trend line, it is a strong bullish indication as it signifies the start of a new bullish trend.
Buy Level(s): The ideal buy level for HXL is if the stock has a daily close above the breakout level of the symmetrical triangle pattern, at around $74.70. This is marked in the chart below as a green color dotted line.
Daily chart – HXL
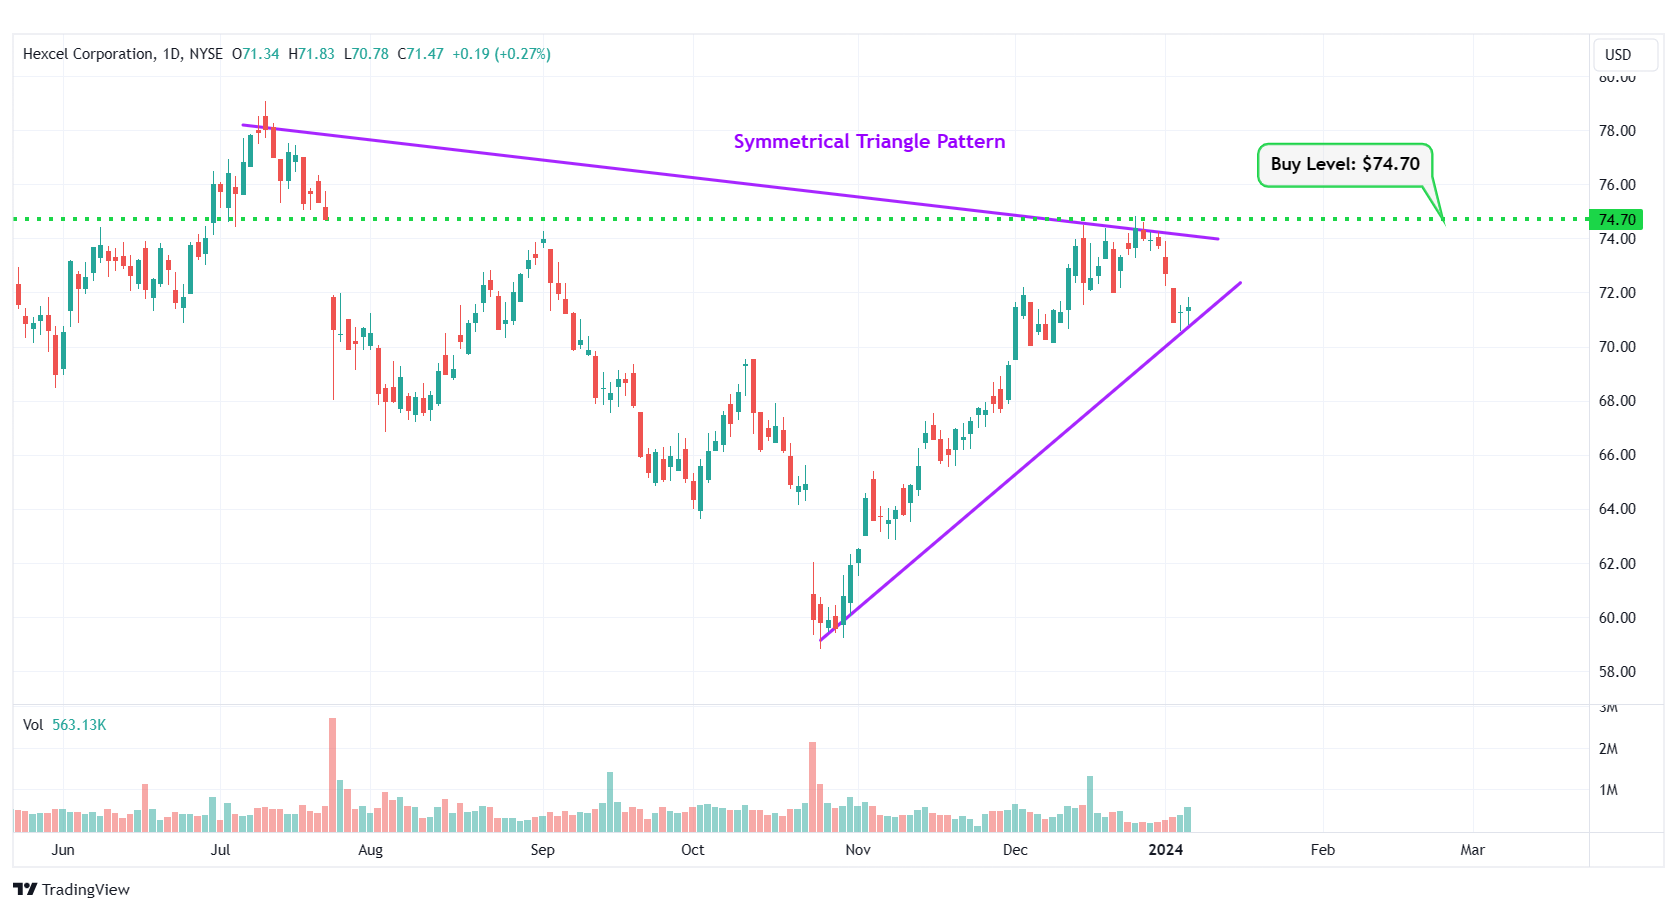
HXL – Symmetrical Triangle Pattern
#5 Barclays plc ADR (NYSE: BCS)
Sector: Financial • Banks – Diversified
Reason: Downtrend Channel Breakout
A downtrend or descending channel is the price action contained between downward sloping parallel lines. It is formed by two lines that are drawn by connecting the lower highs and lower lows of a stock’s price. Even though this is typically a bearish pattern, a breakout from the upper rail of this pattern is considered a good bullish indication.
Buy Level(s): The daily chart shows that the stock has currently broken out of a downtrend channel. However, there is a near-term resistance level for the stock. Hence, the ideal buy level for BCS is if the stock has a daily close above $8.20. This is marked in the chart below as a green color dotted line.
Daily chart – BCS
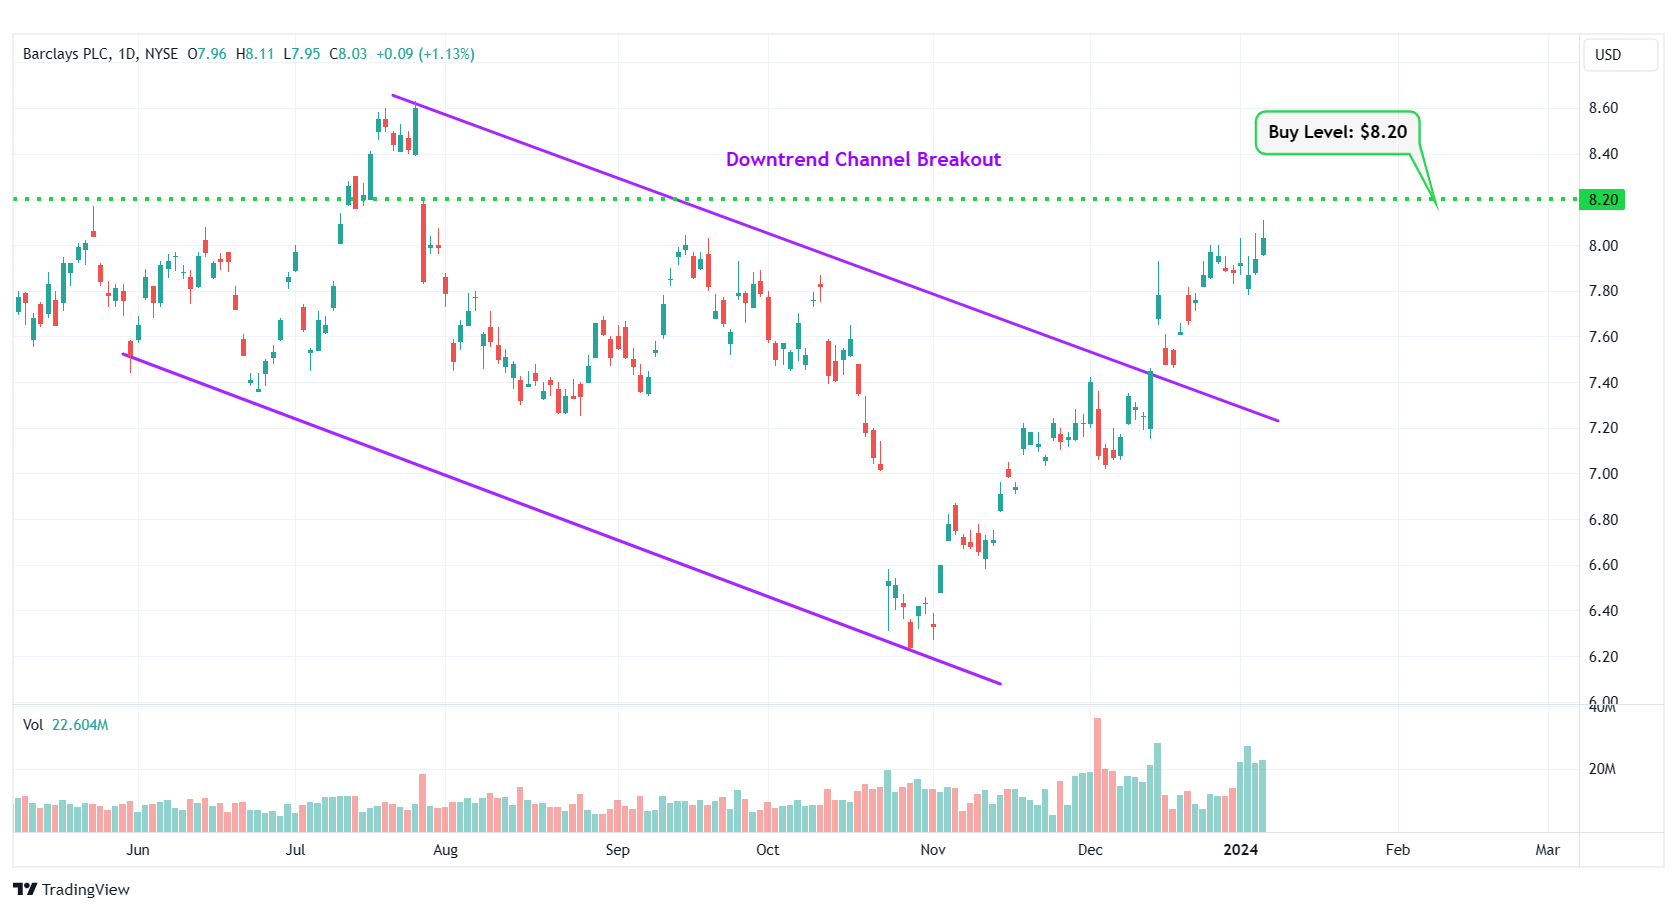
BCS – Downtrend Channel Breakout
#6 Alight Inc. (NYSE: ALIT)
Sector: Technology • Software – Application
Reason: Symmetrical Triangle Pattern Breakout
A symmetrical triangle is a chart pattern formed by two converging trend lines connecting a series of sequential peaks and troughs. These two lines result in the formation of a triangle that appears to be symmetrical.
A symmetrical triangle pattern is usually formed when there is indecision in the price movements and there is uncertainty among the buyers and sellers. This chart pattern represents a period of consolidation before the price breaks out or breaks down. In case a breakout occurs from the upper trend line, it is a strong bullish indication as it signifies the start of a new bullish trend.
Buy Level(s): The stock has currently broken out of a symmetrical triangle pattern. However, the ideal buy level for ALIT is if the stock closes above the immediate resistance level of $9.00. This is marked in the chart below as a green color dotted line.
Daily chart – ALIT
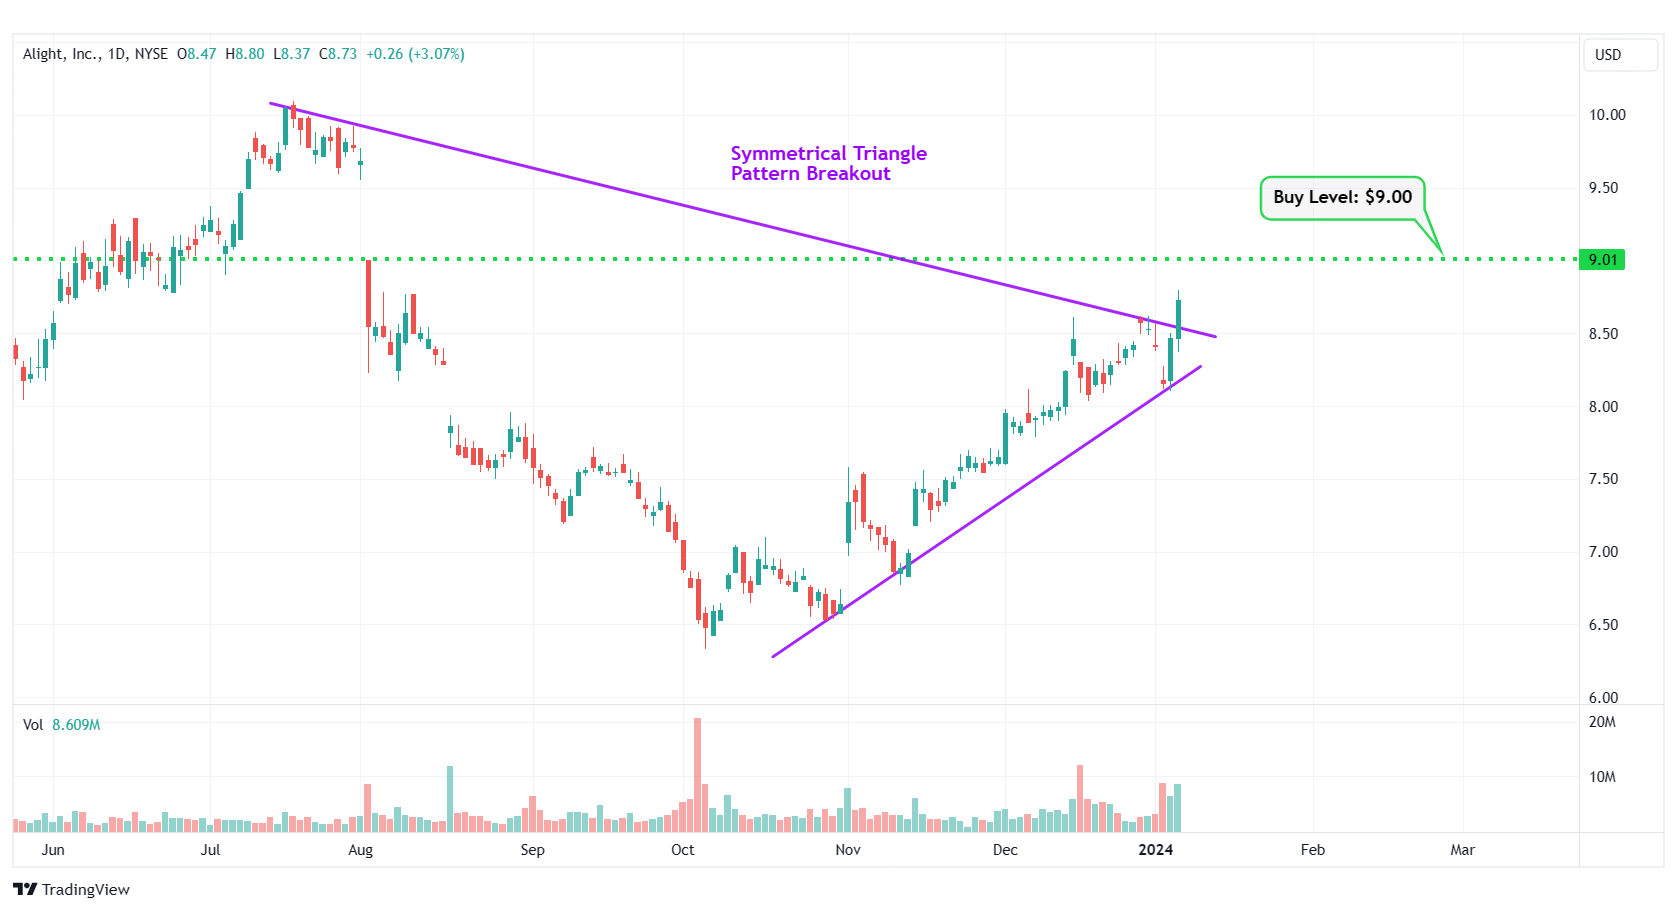
ALIT – Symmetrical Triangle Pattern Breakout
#7 Graphic Packaging Holding Co (NYSE: GPK)
Sector: Consumer Cyclical • Packaging & Containers
Reason: Downtrend Channel Breakout
A downtrend or descending channel is the price action contained between downward sloping parallel lines. It is formed by two lines that are drawn by connecting the lower highs and lower lows of a stock’s price. Even though this is typically a bearish pattern, a breakout from the upper rail of this pattern is considered a good bullish indication.
Buy Level(s): The daily chart shows that the stock has currently broken out of a downtrend channel. However, there is a near-term resistance level for the stock. Hence, the ideal buy level for GPK is if the stock has a daily close above $26.00. This is marked in the chart below as a green color dotted line.
Daily chart – GPK
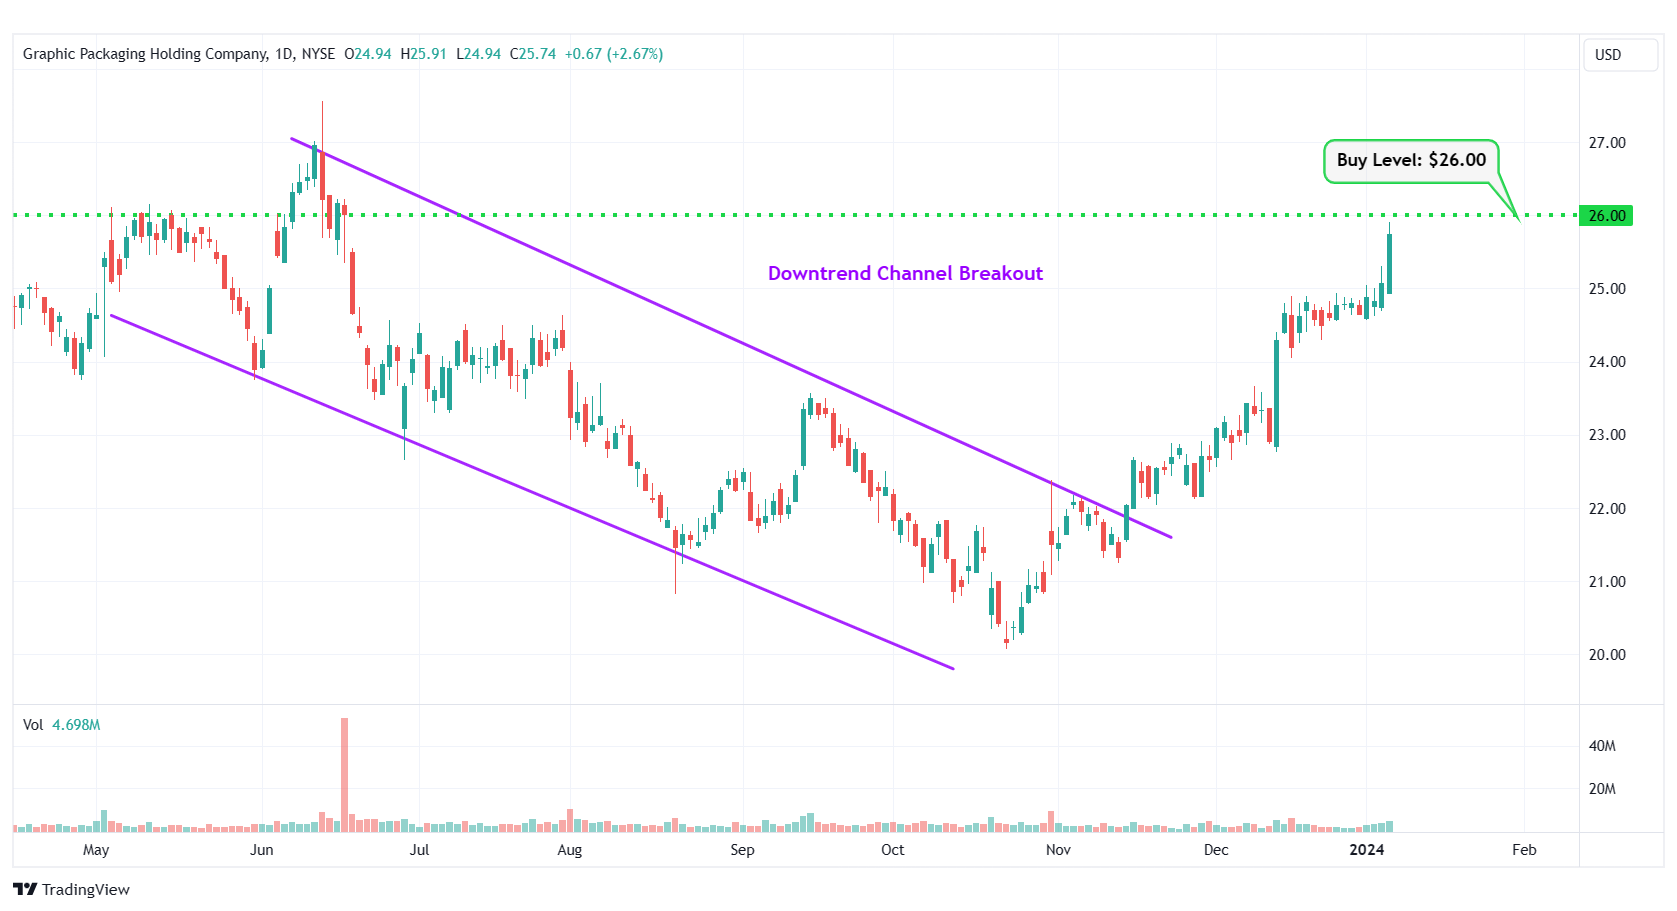
GPK – Downtrend Channel Breakout
#8 Syndax Pharmaceuticals Inc. (NASDAQ: SNDX)
Sector: Healthcare • Biotechnology
Reason: Symmetrical Triangle Pattern Breakout
A symmetrical triangle is a chart pattern formed by two converging trend lines connecting a series of sequential peaks and troughs. These two lines result in the formation of a triangle that appears to be symmetrical.
A symmetrical triangle pattern is usually formed when there is indecision in the price movements and there is uncertainty among the buyers and sellers. This chart pattern represents a period of consolidation before the price breaks out or breaks down. In case a breakout occurs from the upper trend line, it is a strong bullish indication as it signifies the start of a new bullish trend.
Buy Level(s): The stock has currently broken out of a symmetrical triangle pattern. However, the ideal buy level for SNDX is if the stock closes above the immediate resistance level of $22.40. This is marked in the chart below as a green color dotted line.
Daily chart – SNDX
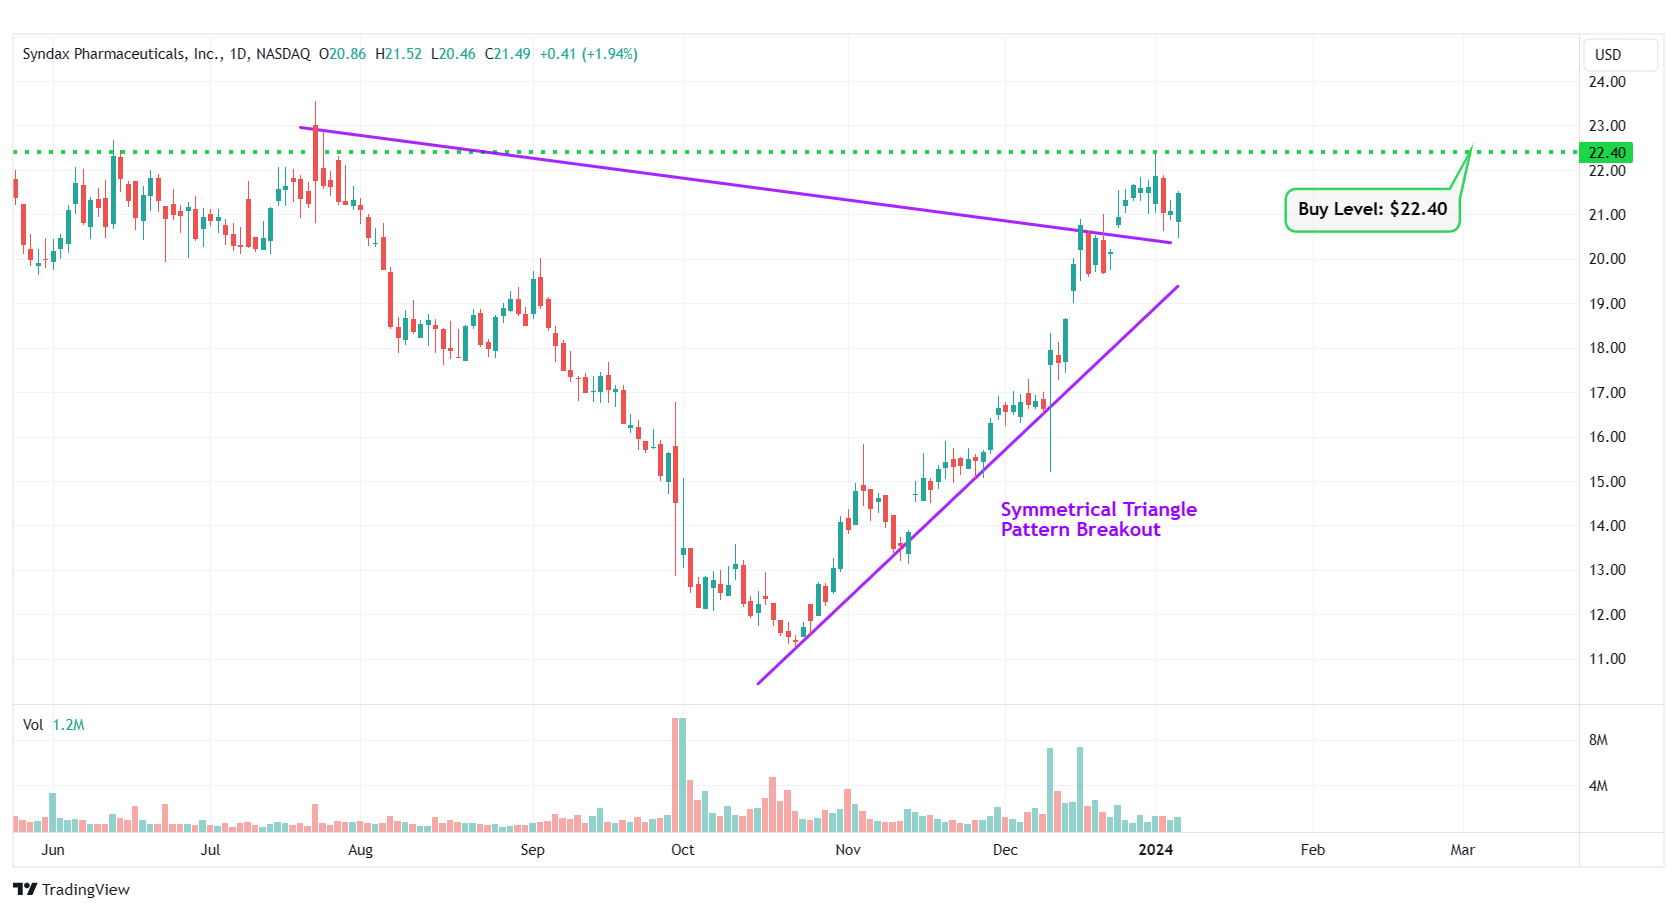
SNDX – Symmetrical Triangle Pattern Breakout
#9 DLocal Limited (NASDAQ: DLO)
Sector: Technology • Software – Infrastructure
Reason: Formation of a Falling Wedge Pattern
A falling wedge pattern is formed by joining two downward-sloping, converging trendlines having a contracting range. The pattern appears to be wide at the top and continues to contract as prices fall. A breakout from a falling wedge pattern can indicate either reversal or continuation depending on where the pattern appeared in the trend.
A stock that has broken out of a falling wedge pattern would have gained momentum and would have the potential to move higher.
Buy Level(s): The ideal buy level for DLO is if the stock breaks out of the falling wedge pattern, at a price of around $18.50. This is marked in the chart below as a green color dotted line.
Daily chart – DLO
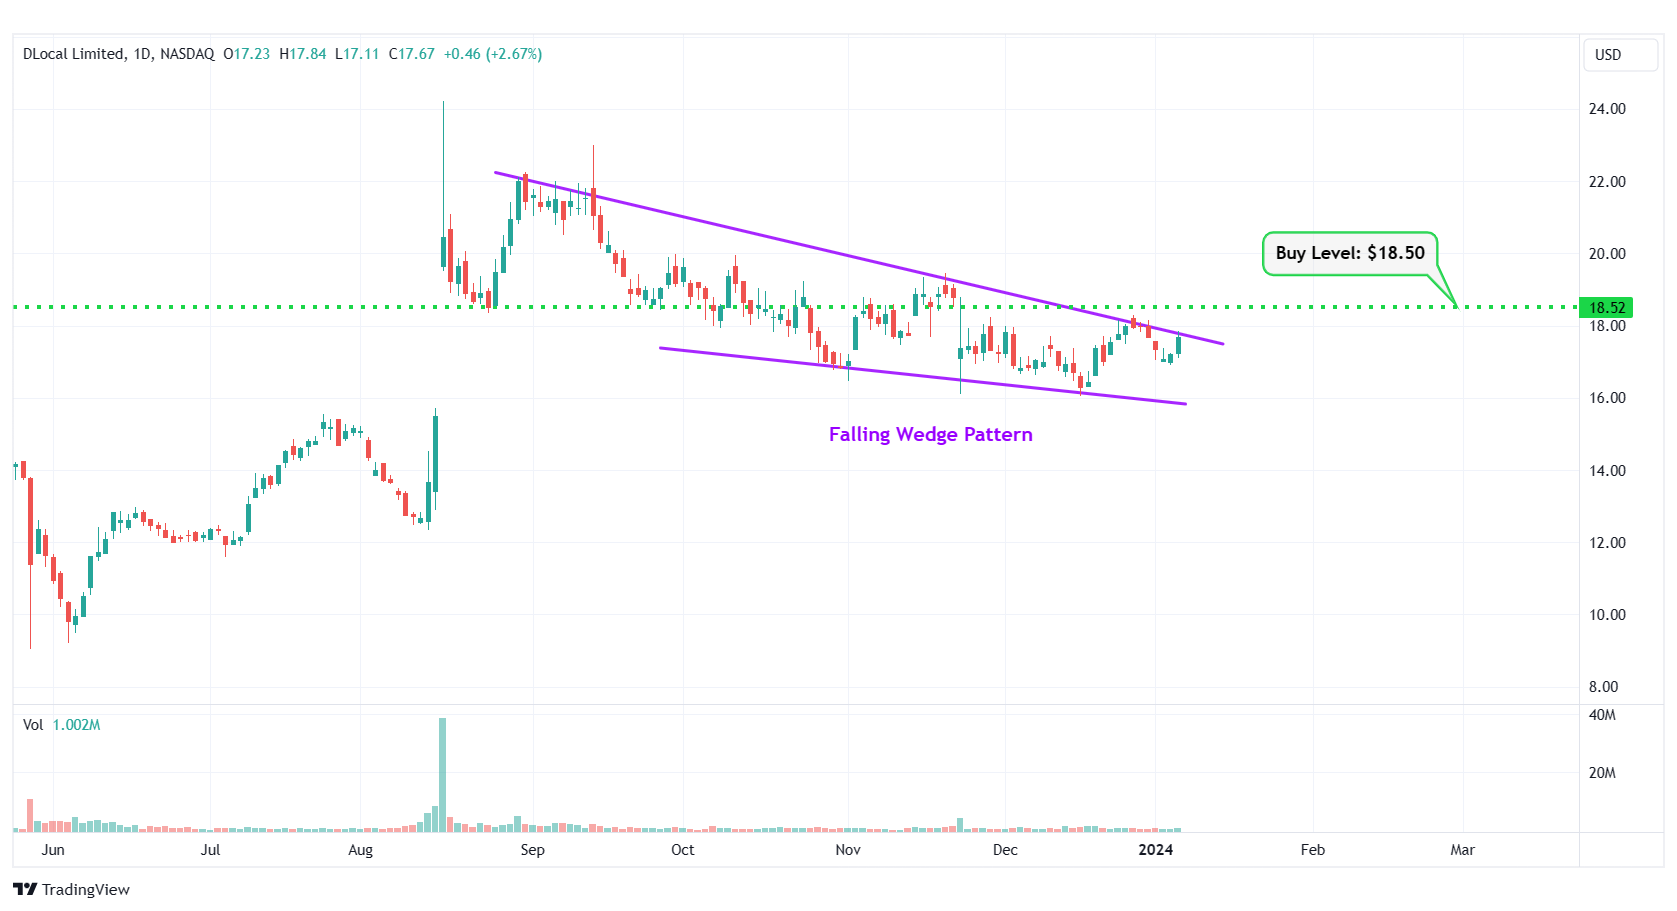
DLO – Falling Wedge Pattern
#10 Toronto Dominion Bank (NYSE: TD)
Sector: Financial • Banks – Diversified
Reason: Symmetrical Triangle Pattern Breakout
A symmetrical triangle is a chart pattern formed by two converging trend lines connecting a series of sequential peaks and troughs. These two lines result in the formation of a triangle that appears to be symmetrical.
A symmetrical triangle pattern is usually formed when there is indecision in the price movements and there is uncertainty among the buyers and sellers. This chart pattern represents a period of consolidation before the price breaks out or breaks down. In case a breakout occurs from the upper trend line, it is a strong bullish indication as it signifies the start of a new bullish trend.
Buy Level(s): The stock has currently broken out of a symmetrical triangle pattern. However, the ideal buy level for TD is if the stock closes above the immediate resistance level of $86.60. This is marked in the chart below as a green color dotted line.
Daily chart – TD
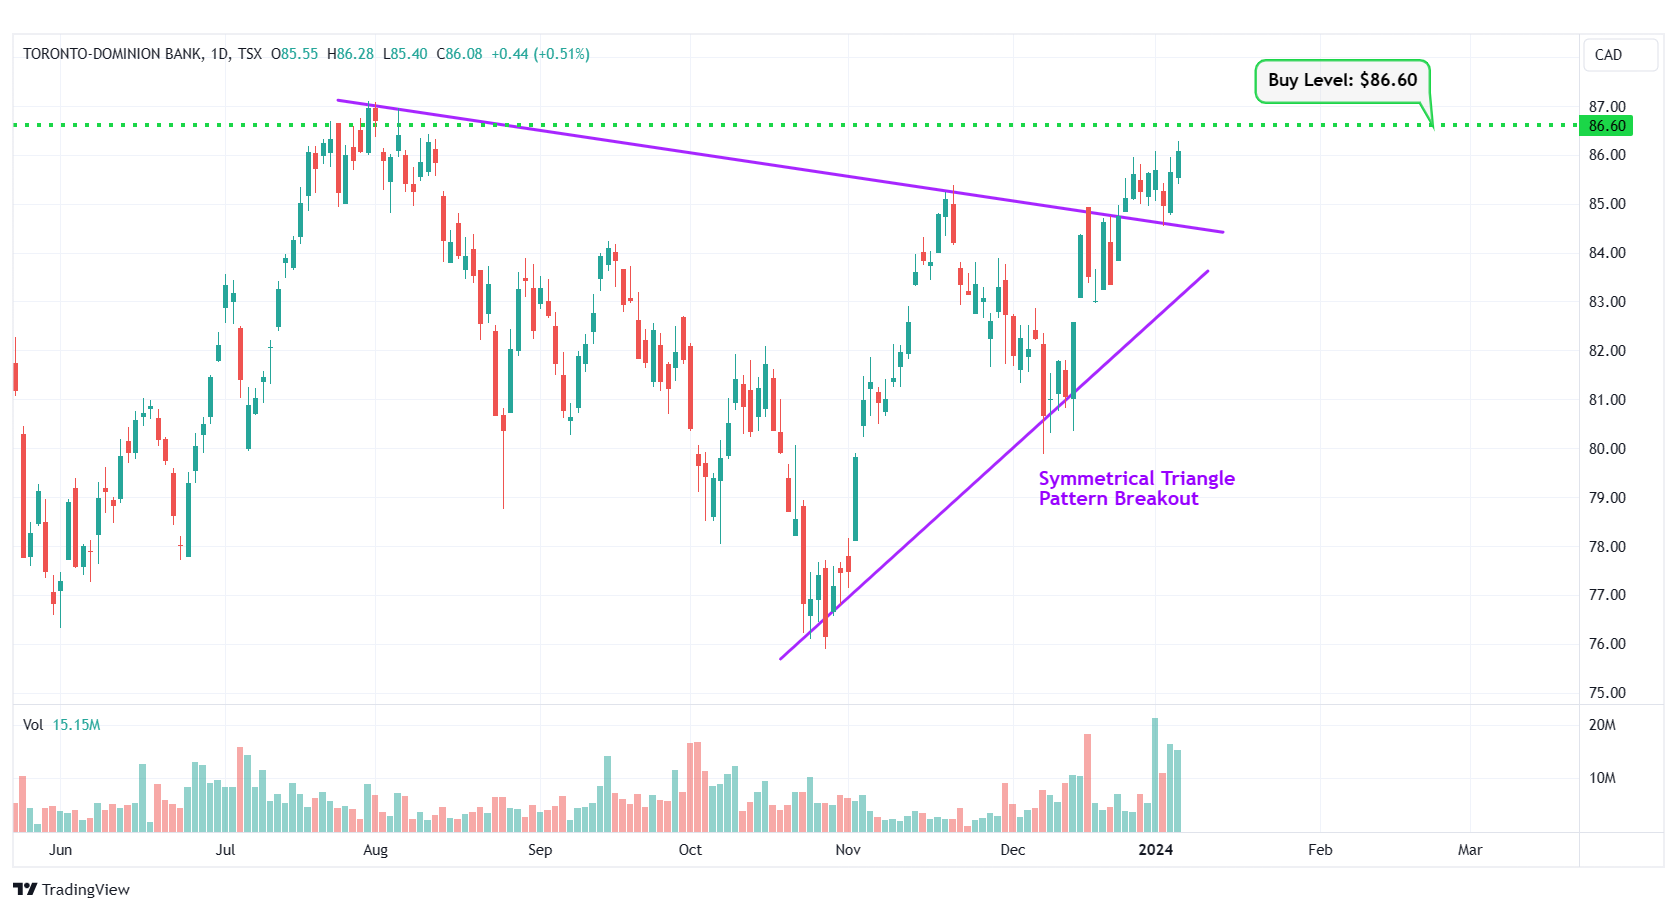
TD – Symmetrical Triangle Pattern Breakout
Happy Trading!
Trades of The Day Research Team
Source: Trades of the Day
