
Picking a winning trade on a consistent basis is not simply a stroke of luck. It’s the result of calculated screening, planning, and deliberation.
With this in mind, we have started a new weekly series on our top 10 stocks to watch this week — stocks that look poised for a possible breakout in the coming days. Traders should add these stocks to their watchlist now.
The Top 10 Stocks to Watch This Week for Possible Breakouts
| Sl # | Name of the Stock | Stock Ticker | Last Close | Buy Level(s) | Reason |
| 1 | Unilever plc ADR | NYSE: UL | $47.93 | $48.80 | Falling Wedge Pattern |
| 2 | Coinbase Global Inc. | NASDAQ: COIN | $115.54 | $117.50 | Ascending Triangle Pattern Breakout |
| 3 | 3D Systems Corp. | NYSE: DDD | $5.38 | $5.80 | Downtrend Channel Breakout |
| 4 | Ecopetrol SA ADR | NYSE: EC | $12.75 | $12.80 | Symmetrical Triangle Pattern Breakout |
| 5 | Irobot Corp | NASDAQ: IRBT | $41.48 | $42.00 | Falling Wedge Pattern Breakout |
| 6 | Albertsons Companies Inc | NYSE: ACI | $21.47 | $21.70 | Downtrend Channel |
| 7 | Marathon Digital Holdings Inc. | NASDAQ: MARA | $11.41 | $11.90 | Symmetrical Triangle Pattern Breakout |
| 8 | Intellia Therapeutics Inc. | NASDAQ: NTLA | $31.03 | $33.20 | Downtrend Channel Breakout |
| 9 | Nordstrom, Inc. | NYSE: JWN | $15.05 | $15.50 | Consolidation Area |
| 10 | MAG Silver Corp. | AMEX: MAG | $10.97 | $11.20 | Downtrend Channel |
Important: Typically, these trades offer a risk: reward ratio of 1:2 or 1:3 in the next 6 months, which implies 2x to 3x rewards when compared to risks. So, be sure to set your stop-loss levels and target prices accordingly to manage your risk. In addition, these trade ideas are triggered using daily closing prices, not intra-day pricing. So, if you participate in these trades, make sure that you only buy the stock once its daily close is above the recommended price level.
That said, here are the top 10 stocks to watch for a breakout, in no particular order.
#1 Unilever plc ADR (NYSE: UL)
Sector: Consumer Defensive • Household & Personal Products
Reason: Formation of a Falling Wedge Pattern
A falling wedge pattern is formed by joining two downward-sloping, converging trendlines having a contracting range. The pattern appears to be wide at the top and continues to contract as prices fall. A breakout from a falling wedge pattern can indicate either reversal or continuation depending on where the pattern appeared in the trend.
A stock that has broken out of a falling wedge pattern would have gained momentum and would have the potential to move higher.
Buy Level(s): The ideal buy level for UL is if the stock breaks out of the falling wedge pattern, at a price of around $48.80. This is marked in the chart below as a green color dotted line.
Daily chart – UL
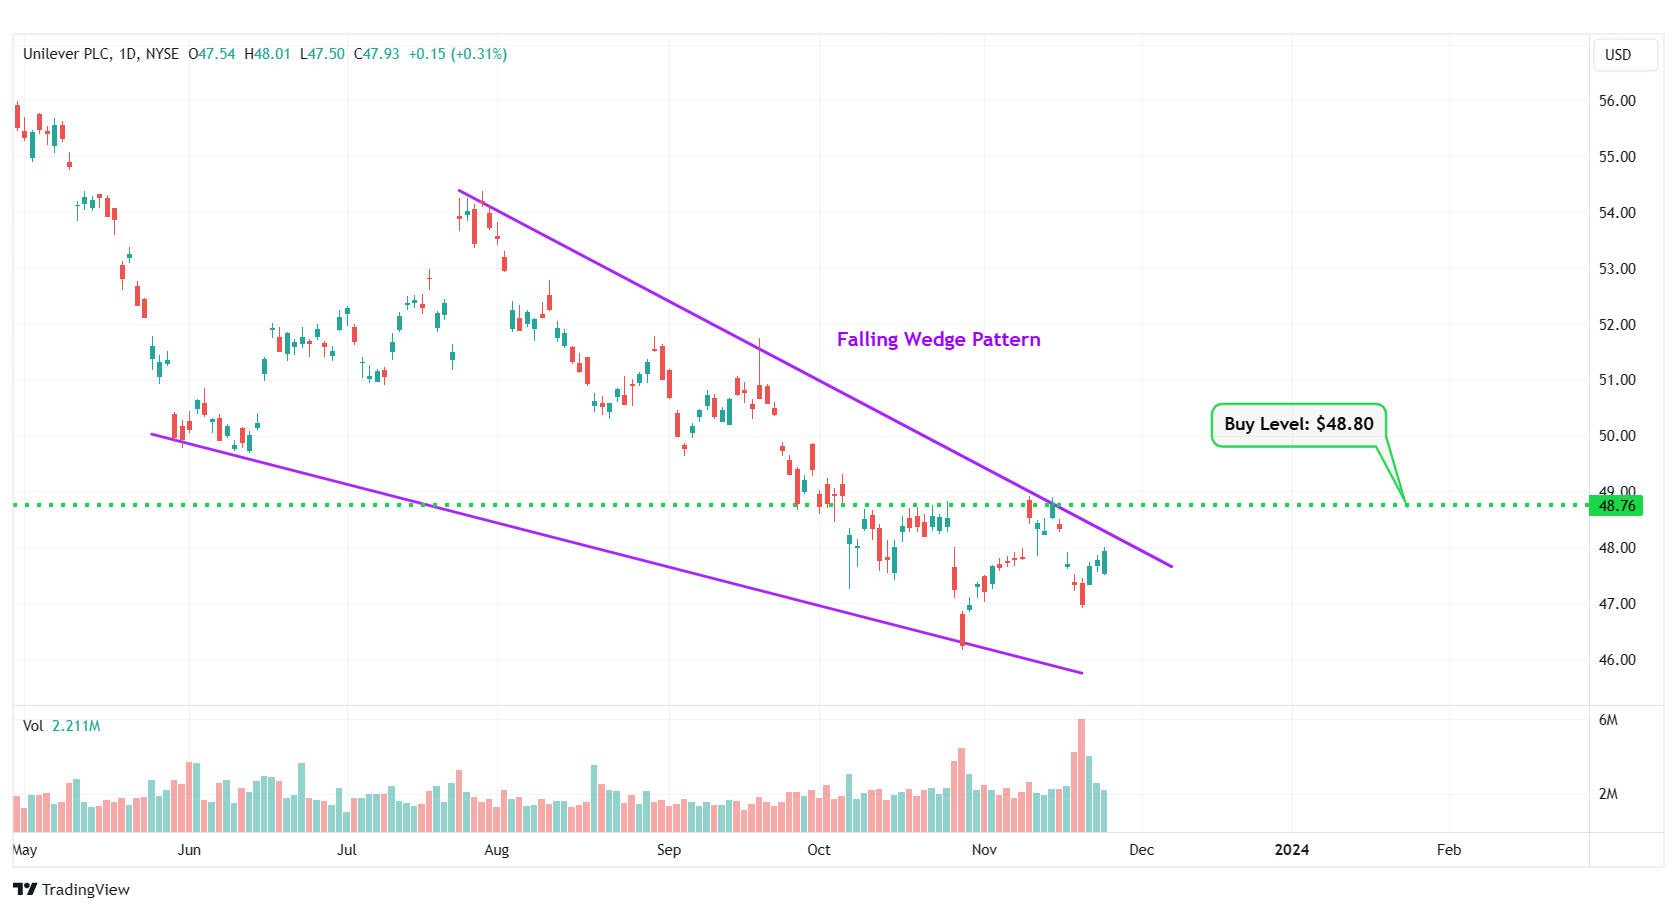
UL – Falling Wedge Pattern
#2 Coinbase Global Inc. (NASDAQ: COIN)
Sector: Financial • Financial Data & Stock Exchanges
Reason: Breakout From an Ascending Triangle Pattern
An ascending triangle pattern is a bullish pattern formed by drawing a horizontal line along the swing highs, and a rising trendline along the swing lows. These two lines result in the formation of a triangle. A breakout from this pattern is typically a strong bullish indication.
Buy Level(s): Although the stock has broken out of the ascending triangle pattern, the ideal buy level for COIN is if the stock has a daily close above the near-term resistance level of $117.50. This is marked in the chart below as a green color dotted line.
Daily chart – COIN
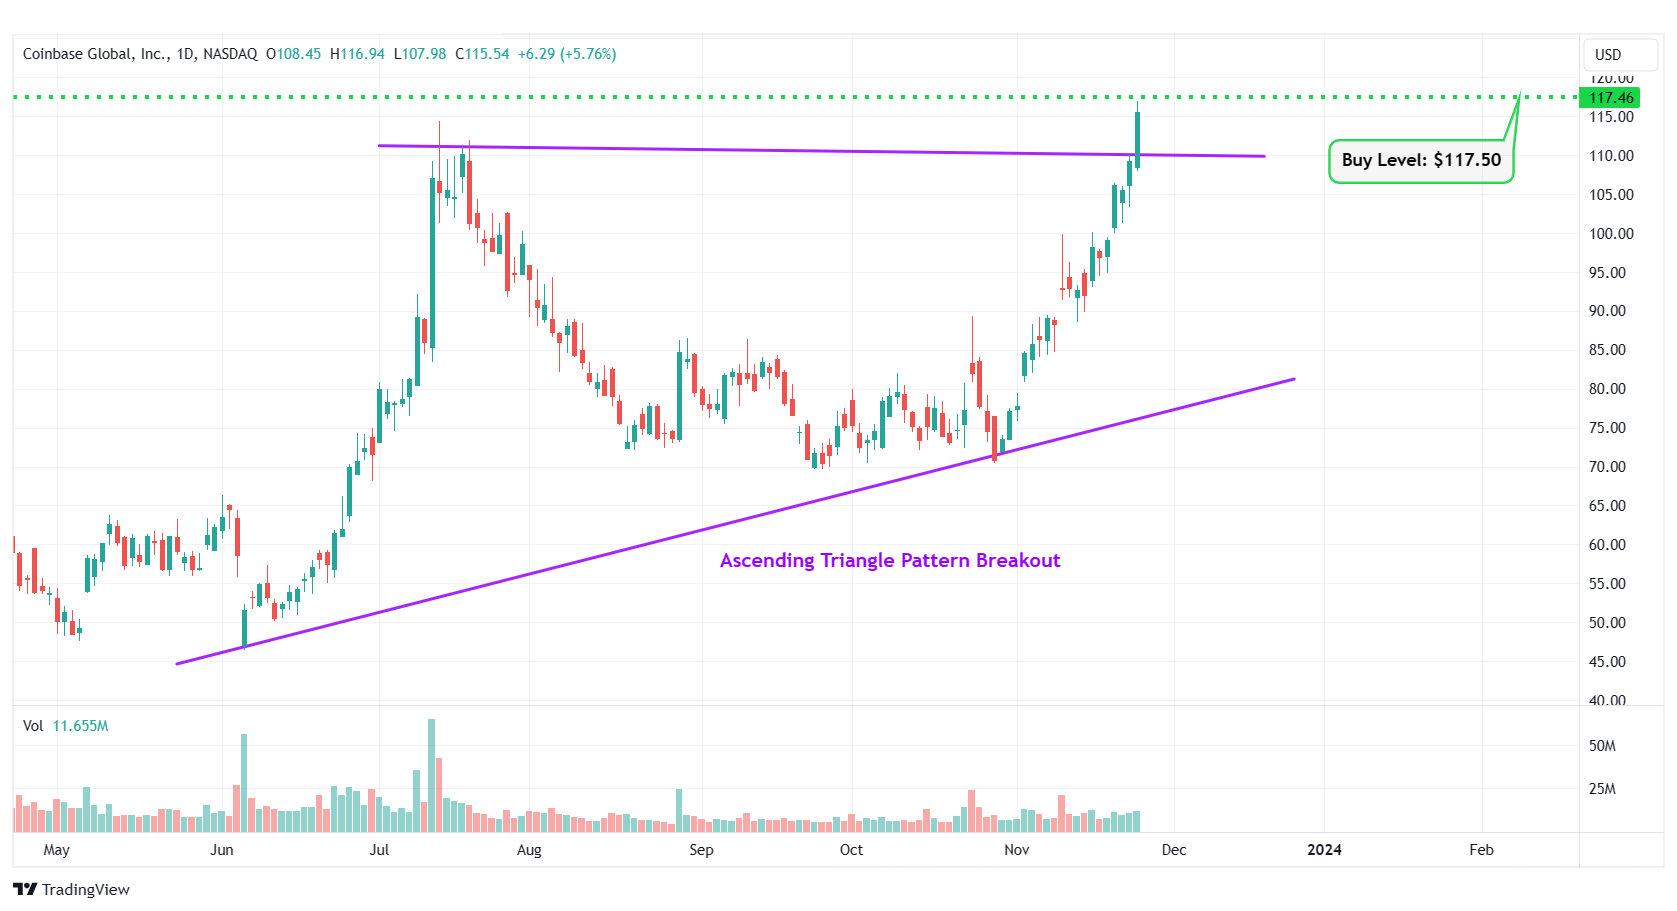
COIN – Ascending Triangle Pattern Breakout
#3 3D Systems Corp. (NYSE: DDD)
Sector: Technology • Computer Hardware
Reason: Downtrend Channel Breakout
A downtrend or descending channel is the price action contained between downward sloping parallel lines. It is formed by two lines that are drawn by connecting the lower highs and lower lows of a stock’s price. Even though this is typically a bearish pattern, a breakout from the upper rail of this pattern is considered a good bullish indication.
Buy Level(s): The daily chart shows that the stock has currently broken out of a downtrend channel. However, there is a near-term resistance level for the stock. Hence, the ideal buy level for DDD is if the stock has a daily close above $5.80. This is marked in the chart below as a green color dotted line.
Daily chart – DDD
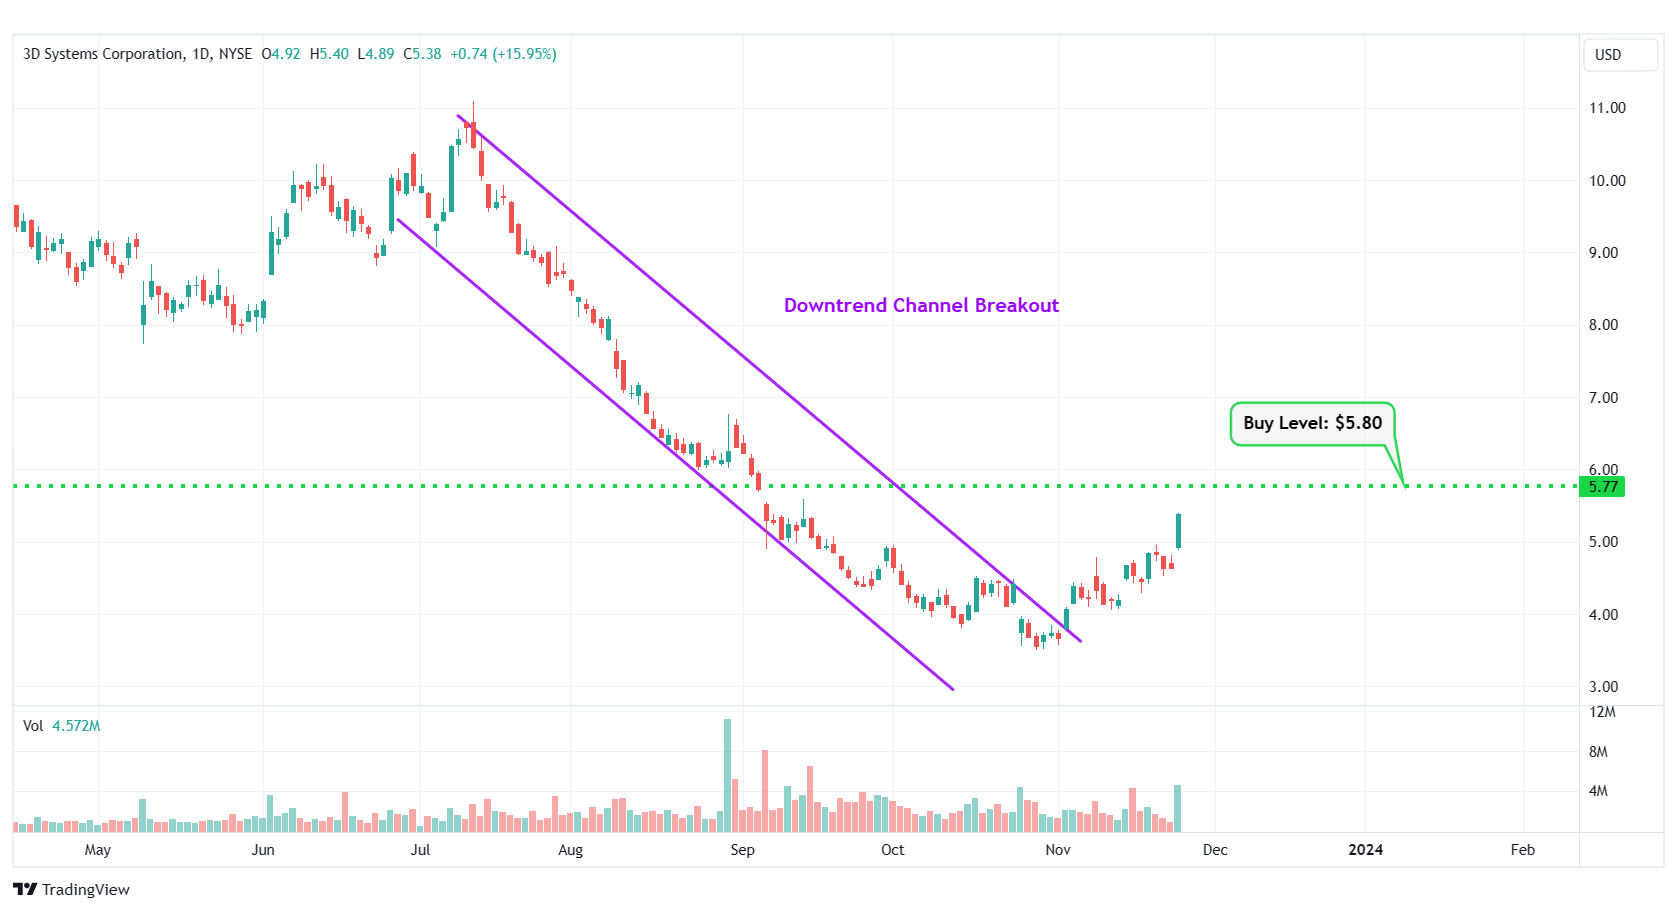
DDD – Downtrend Channel Breakout
#4 Ecopetrol SA ADR (NYSE: EC)
Sector: Energy • Oil & Gas Integrated • Colombia
Reason: Symmetrical Triangle Pattern Breakout
A symmetrical triangle is a chart pattern formed by two converging trend lines connecting a series of sequential peaks and troughs. These two lines result in the formation of a triangle that appears to be symmetrical.
A symmetrical triangle pattern is usually formed when there is indecision in the price movements and there is uncertainty among the buyers and sellers. This chart pattern represents a period of consolidation before the price breaks out or breaks down. In case a breakout occurs from the upper trend line, it is a strong bullish indication as it signifies the start of a new bullish trend.
Buy Level(s): The stock has currently broken out of a symmetrical triangle pattern. However, the ideal buy level for EC is if the stock closes above the immediate resistance level of $12.80. This is marked in the chart below as a green color dotted line.
Daily chart – EC
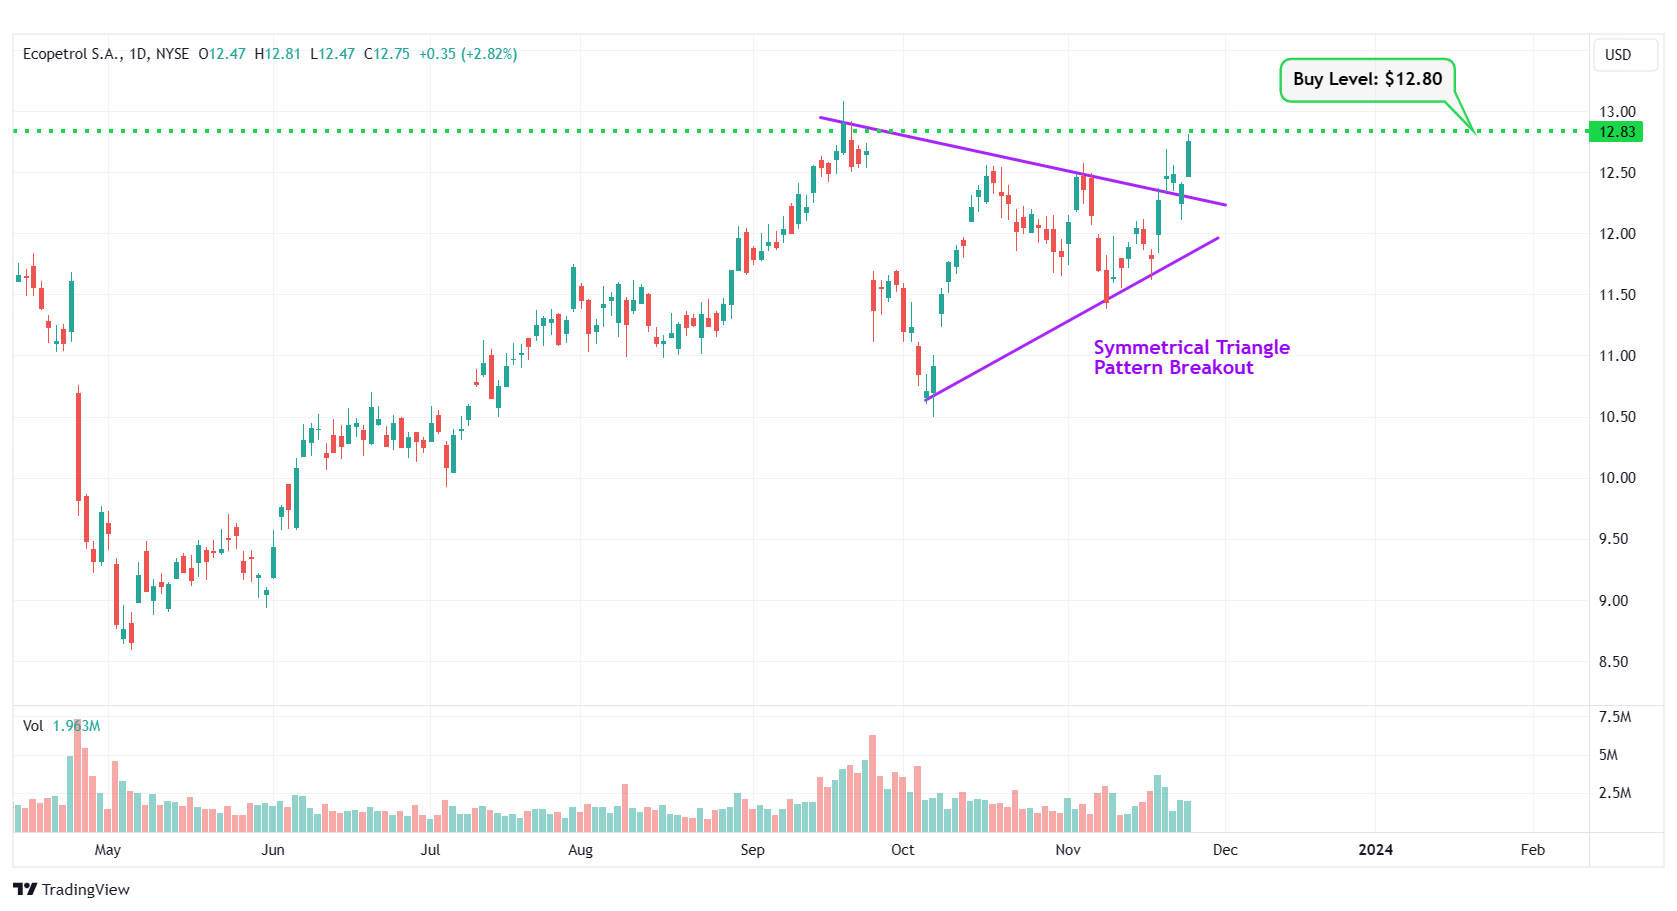
EC – Symmetrical Triangle Pattern Breakout
#5 Irobot Corp (NASDAQ: IRBT)
Sector: Consumer Cyclical • Furnishings, Fixtures & Appliances
Reason: Falling Wedge Pattern Breakout
A falling wedge pattern is formed by joining two downward-sloping, converging trendlines having a contracting range. The pattern appears to be wide at the top and continues to contract as prices fall. A breakout from a falling wedge pattern can indicate either reversal or continuation depending on where the pattern appeared in the trend.
A stock that has broken out of a falling wedge pattern would have gained momentum and would have the potential to move higher.
Buy Level(s): The stock has currently broken out of a falling wedge pattern. However, the ideal buy level for IRBT is above the nearest resistance level of $42.00. This is marked in the chart below as a green color dotted line.
Daily chart – IRBT
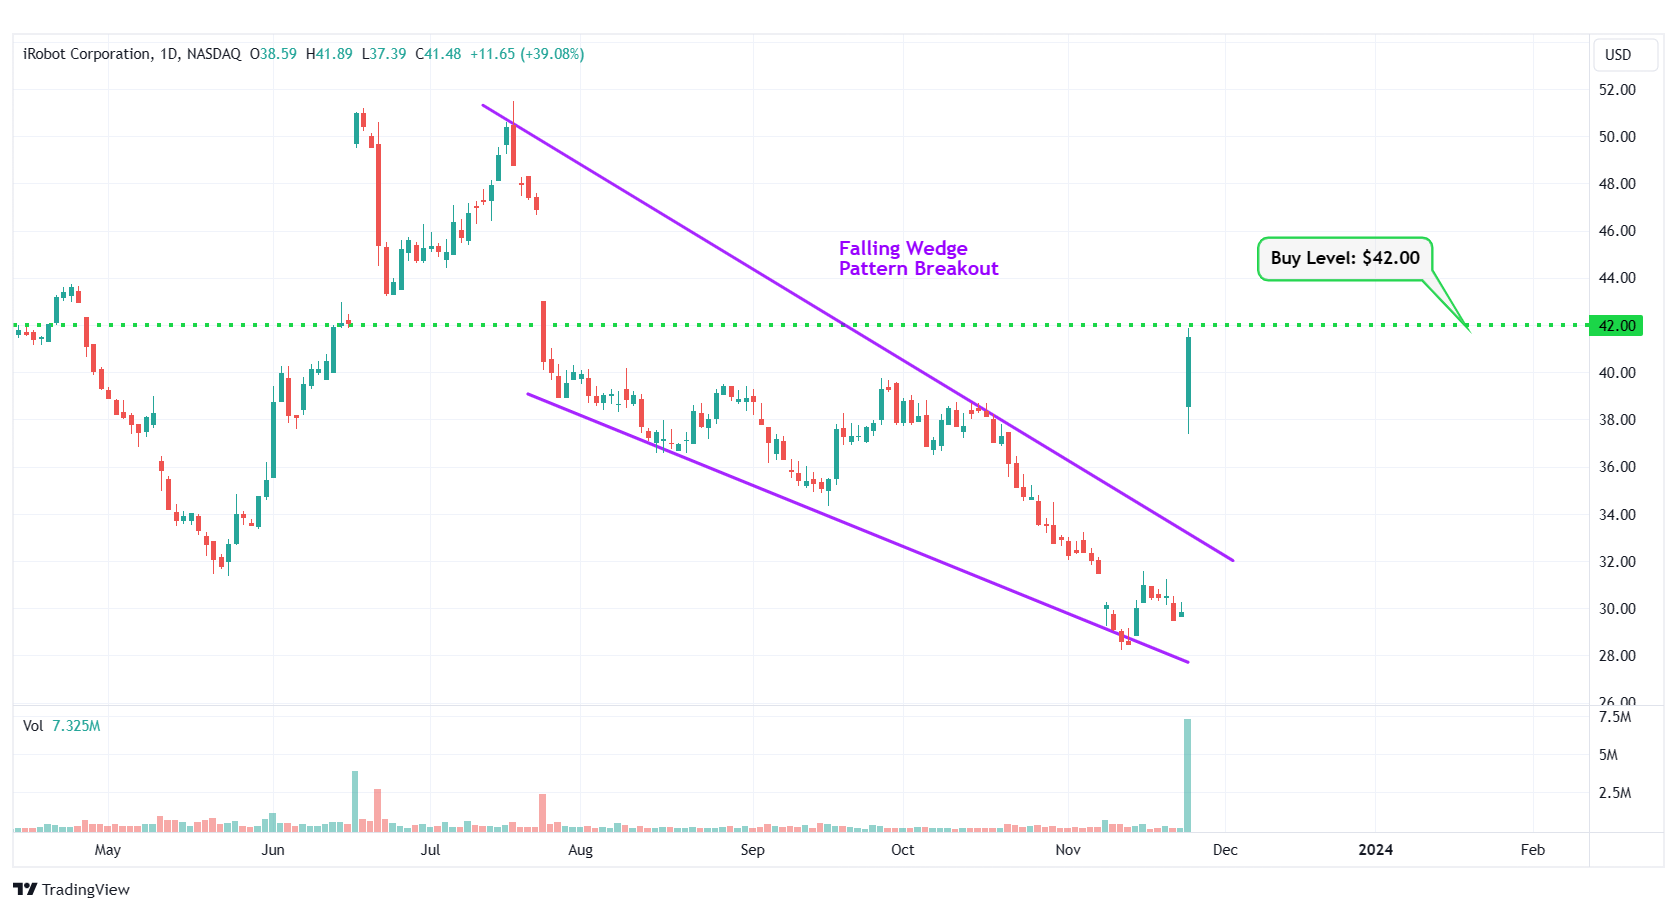
IRBT – Falling Wedge Pattern Breakout
#6 Albertsons Companies Inc. (NYSE: ACI)
Sector: Consumer Defensive • Grocery Stores
Reason: Formation of a Downtrend Channel
A downtrend or descending channel is the price action contained between downward sloping parallel lines. It is formed by two lines that are drawn by connecting the lower highs and lower lows of a stock’s price. Even though this is typically a bearish pattern, a breakout from the upper rail of this pattern is considered a good bullish indication.
Buy Level(s): The daily chart shows that the stock is currently forming a downtrend channel. The ideal buy level for ACI is if the stock breaks out of the downtrend channel and has a daily close above $21.70. This is marked in the chart below as a green color dotted line.
Daily chart – ACI
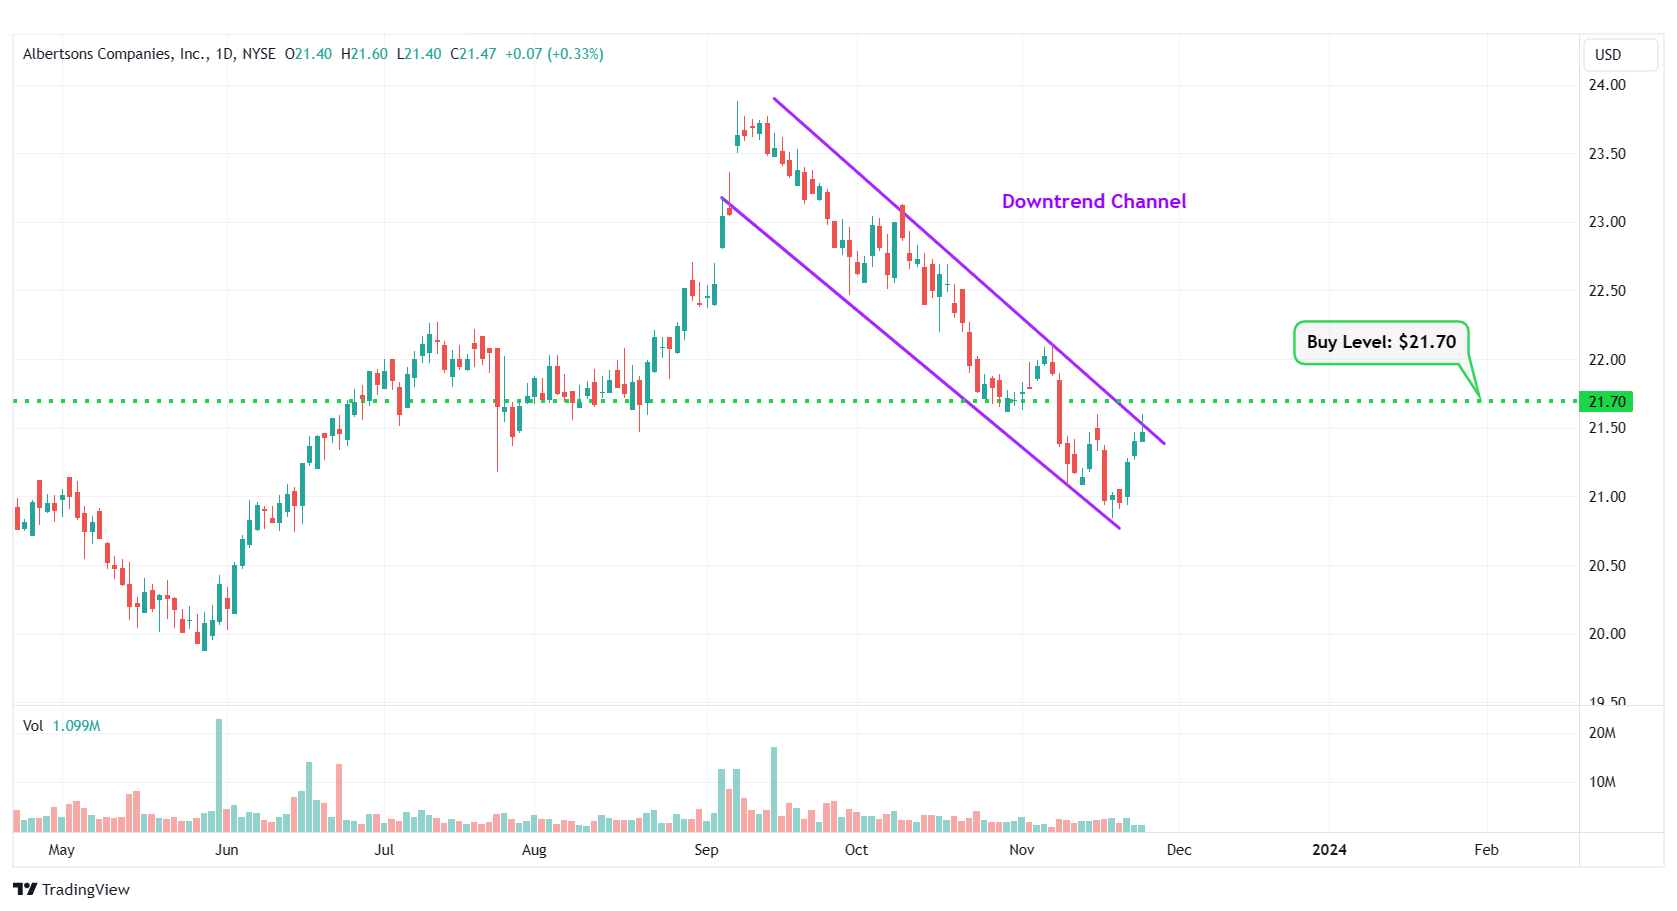
ACI – Downtrend Channel
#7 Marathon Digital Holdings Inc. (NASDAQ: MARA)
Sector: Financial • Capital Markets
Reason: Symmetrical Triangle Pattern Breakout
A symmetrical triangle is a chart pattern formed by two converging trend lines connecting a series of sequential peaks and troughs. These two lines result in the formation of a triangle that appears to be symmetrical.
A symmetrical triangle pattern is usually formed when there is indecision in the price movements and there is uncertainty among the buyers and sellers. This chart pattern represents a period of consolidation before the price breaks out or breaks down. In case a breakout occurs from the upper trend line, it is a strong bullish indication as it signifies the start of a new bullish trend.
Buy Level(s): The stock has currently broken out of a symmetrical triangle pattern. However, the ideal buy level for MARA is if the stock closes above the immediate resistance level of $11.90. This is marked in the chart below as a green color dotted line.
Daily chart – MARA
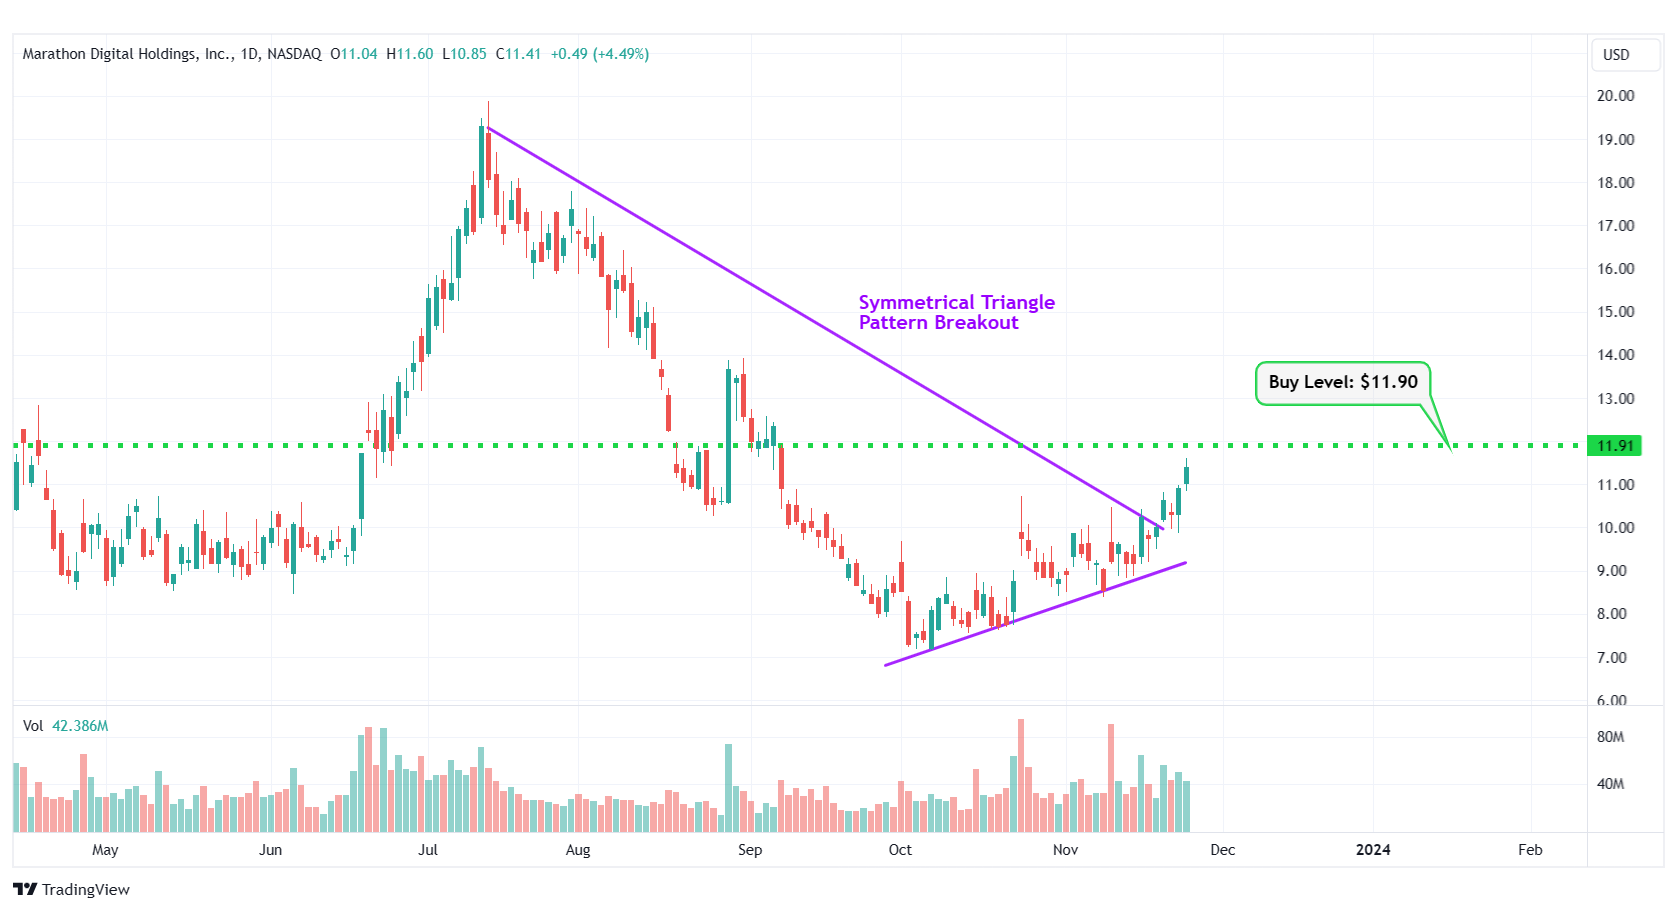
MARA – Symmetrical Triangle Pattern Breakout
#8 Intellia Therapeutics Inc. (NASDAQ: NTLA)
Sector: Healthcare • Biotechnology
Reason: Downtrend Channel Breakout
A downtrend or descending channel is the price action contained between downward sloping parallel lines. It is formed by two lines that are drawn by connecting the lower highs and lower lows of a stock’s price. Even though this is typically a bearish pattern, a breakout from the upper rail of this pattern is considered a good bullish indication.
Buy Level(s): The daily chart shows that the stock has currently broken out of a downtrend channel. However, there is a near-term resistance level for the stock. Hence, the ideal buy level for NTLA is if the stock has a daily close above $33.20. This is marked in the chart below as a green color dotted line.
Daily chart – NTLA
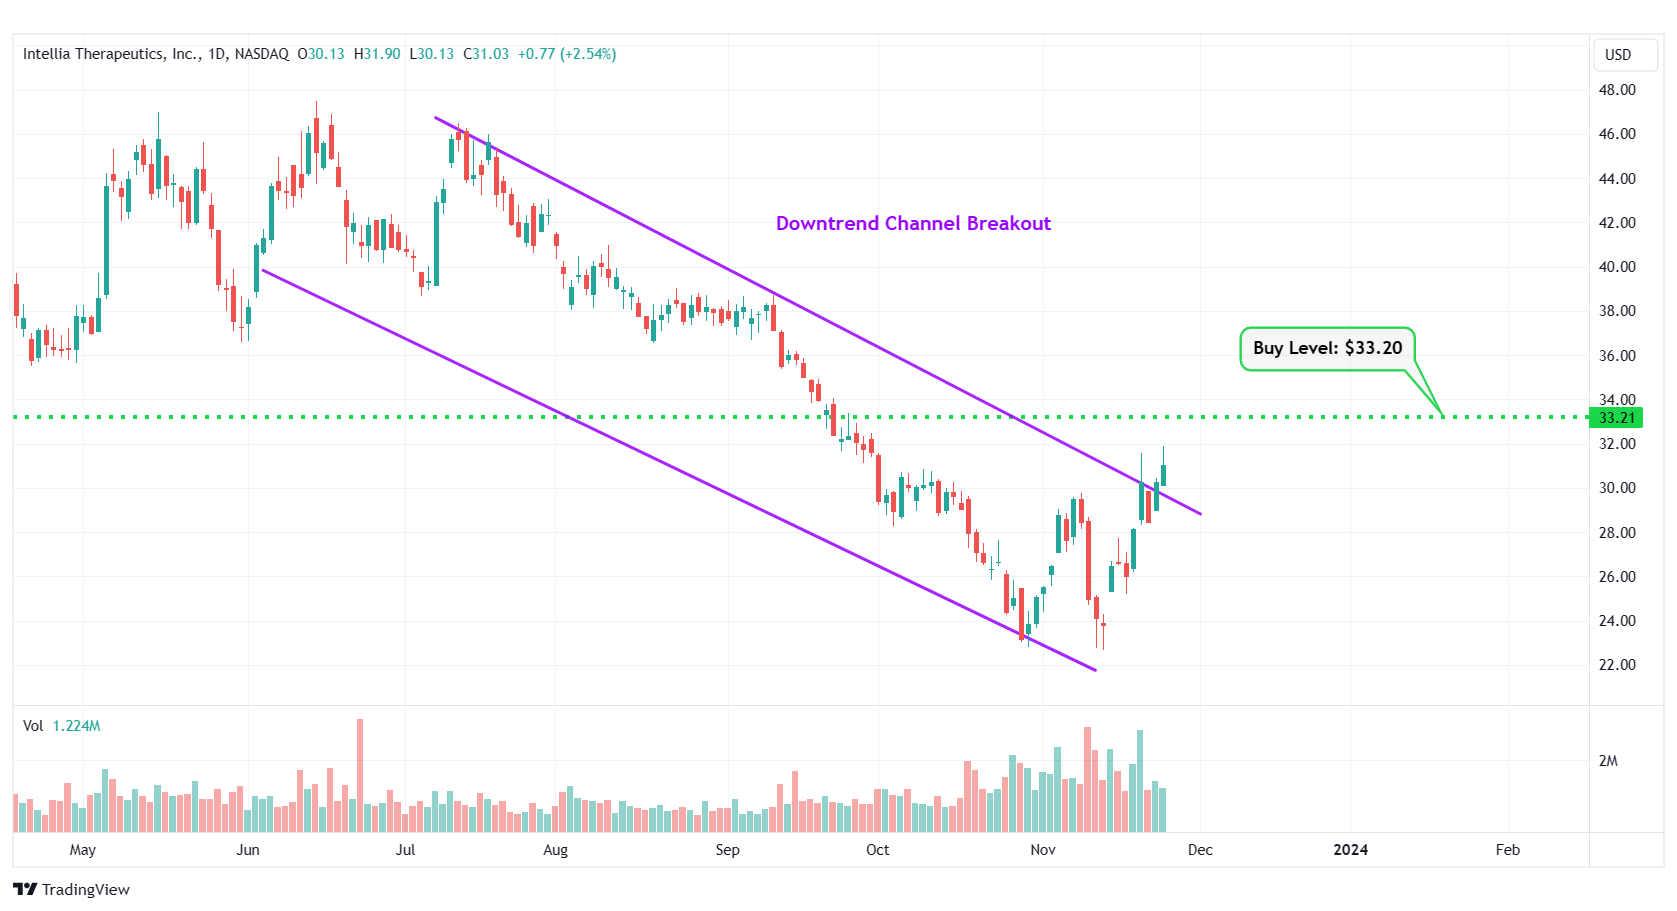
NTLA – Downtrend Channel Breakout
#9 Nordstrom, Inc. (NYSE: JWN)
Sector: Consumer Cyclical • Department Stores
Reason: Formation of a Consolidation Area in the Daily Chart
A Consolidation Area is a price action contained between two parallel lines. It is formed by a lower line that connects the lows, and an upper line that joins the highs. A stock usually trades between the two lines of the consolidation area before finally breaking out from the upper rail.
Buy Level(s): The ideal buy level for JWN is above the breakout level of the consolidation area, at around $15.50. This is marked in the chart below as a green color dotted line.
Daily chart – JWN
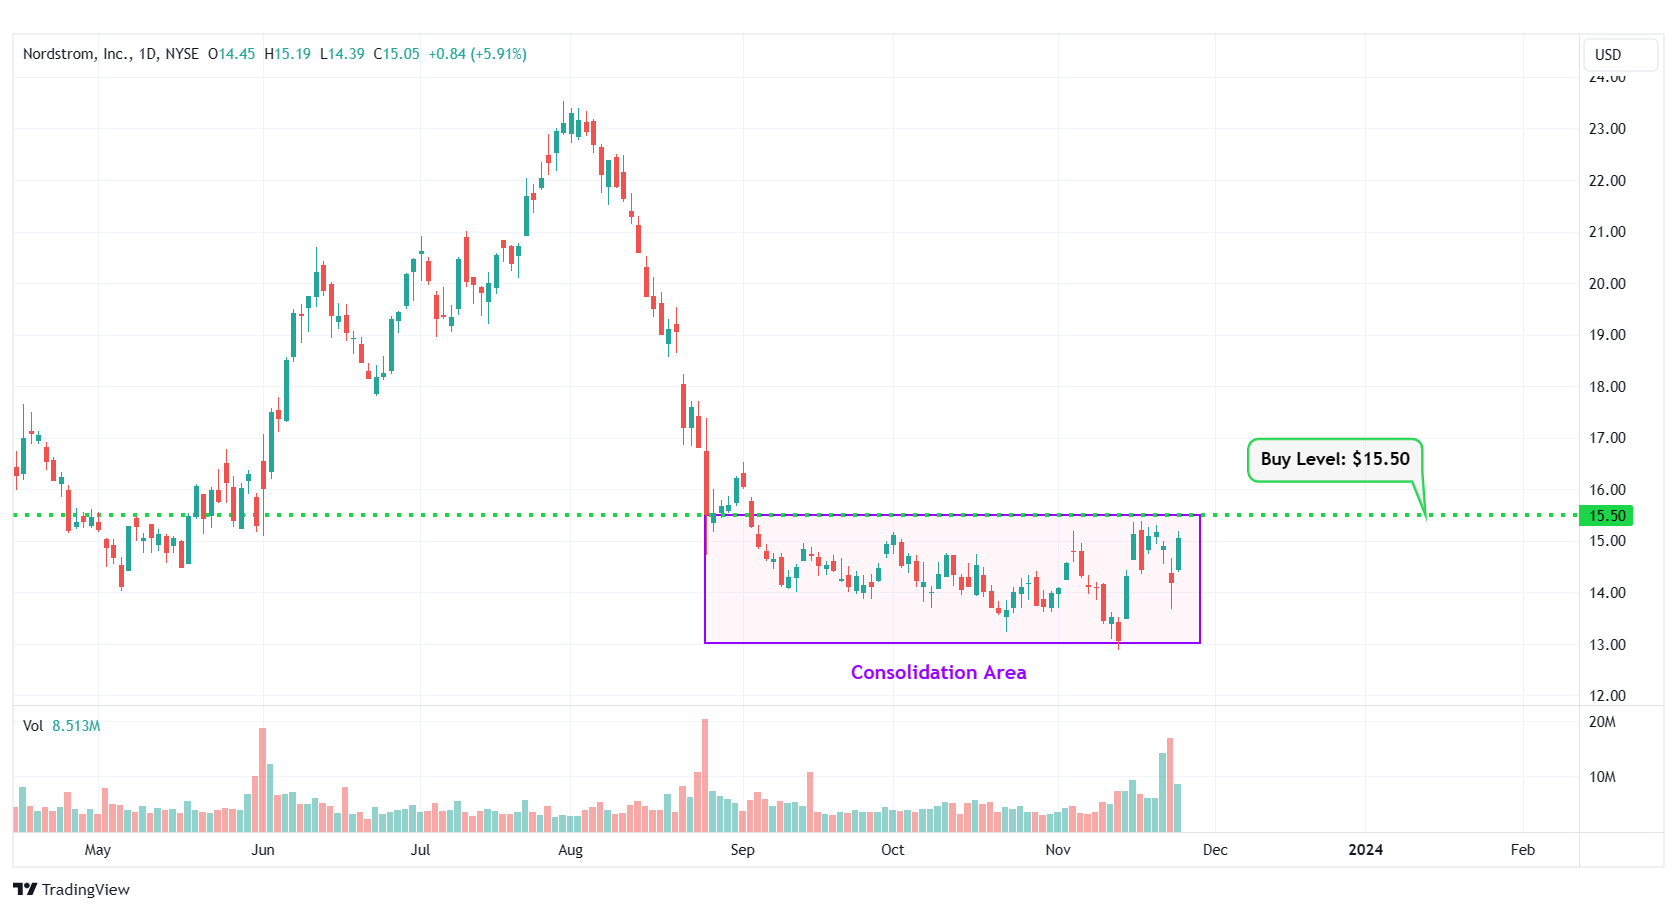
JWN – Consolidation Area
#10 MAG Silver Corp. (AMEX: MAG)
Sector: Basic Materials • Silver
Reason: Formation of a Downtrend Channel
A downtrend or descending channel is the price action contained between downward sloping parallel lines. It is formed by two lines that are drawn by connecting the lower highs and lower lows of a stock’s price. Even though this is typically a bearish pattern, a breakout from the upper rail of this pattern is considered a good bullish indication.
Buy Level(s): The daily chart shows that the stock is currently forming a downtrend channel. The ideal buy level for MAG is if the stock breaks out of the downtrend channel and has a daily close above $11.20. This is marked in the chart below as a green color dotted line.
Daily chart – MAG
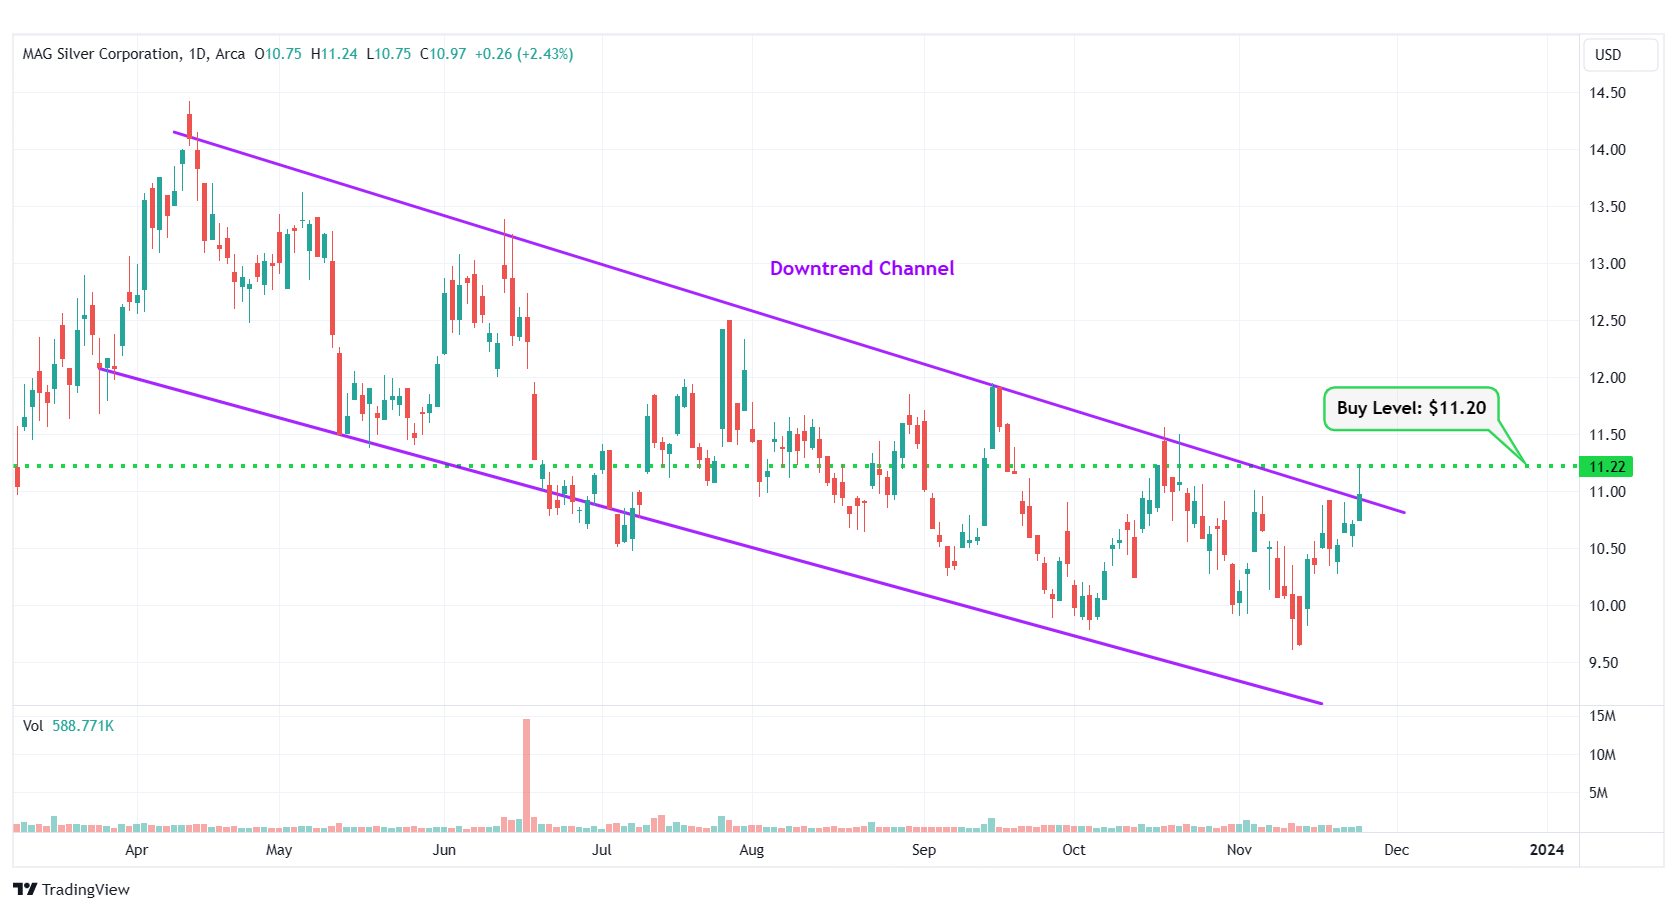
MAG – Downtrend Channel
Happy Trading!
Trades of The Day Research Team
Legendary fund manager Louis Navellier – a man Forbes calls "the king of quants" – is going "ALL-IN" on this game-changing AI technology. He says, "This is the culmination of everything you've been reading about AI for the last 60 years."Get the details...
Source: Trades of the Day
