
“You have to be in the market on its best-performing days because, if you miss them, it will gut your portfolio returns.”
For countless investors, this is a core market belief. It drives the takeaway, “you can’t time the market.”
But is it true?
At first glance it appears so. Yesterday, I saw the latest article making this point.
From CNBC:
The S&P 500 is up 14% this year, but just eight days explain most of the gains.
If you want a simple indication of why market timing is not an effective investment strategy, take a look at the data on the S&P 500 year to date.
Nicholas Colas at DataTrek notes that there have only been 11 more up days than down days this year (113 up, 102 down) and yet the S&P 500 is higher by 14% year to date.
After digging into the data, the article concludes:
…had you not been in the markets on those eight days, your returns would be considerably worse…
This is not only true for 2023: it is true for every year.
Yes, it is true…it’s also misleading and incomplete.
In fact, I’d argue there should be a different takeaway:
The reality is you can time the market… in fact, you’d better learn how… and maybe, counterintuitively, you might want to miss these “best days in the market” after all.
***The myth of “missing the best days”
Meb Faber, the CEO of Cambria Investments, is a close friend. He’s also a widely respected quantitative analyst who lives and breathes historical market data.
About a decade ago, Meb tackled this idea of “missing the best days.” At first glance, he found the conclusion holds up – if you miss these best days, the impact on your portfolio is brutal.
In his research, Meb focused on what he calls “outlier days.” These are best 1% of all days in the market. Here’s what he found, supportive of “stay in the market”:
If you missed the best 1% of all days your return gets crushed from 4.86% down to -7.08% per annum.
So, long live “buy and hold,” right?
Well, hold on.
This is where so much research stops, including yesterday’s piece from CNBC. But there’s another layer of analysis we must include if we’re being intellectually honest.
***What is the “best days” research missing?
Well, how about “the worst days?”
Seems like cherry-picking to exclude the worst days if the takeaway is “stay invested because market-timing doesn’t work.”
To begin, what would happen if our focus wasn’t on “catching the big up days” but instead, was on “missing the big down days”?
Back to Meb:
…If you miss the worst 1% of all days, your returns explode to 19.09% a year.
That’s a resounding vote for defense instead of offense if I’ve ever seen it.
And now, what if we missed both the top 1% of biggest up-days and the top 1% of biggest down-days?
Here’s Meb:
Take special note that if you miss both the best and worst 1% of days, your return is higher than buy-and-hold.
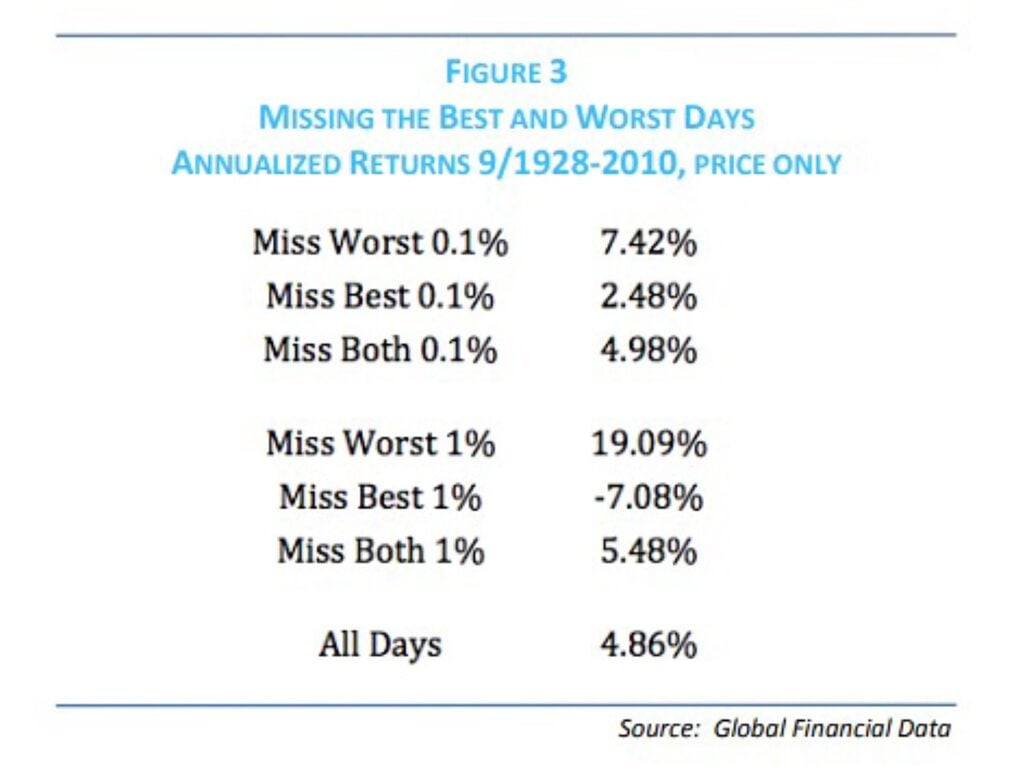 Source: Meb Faber; Global Financial Data
With this updated analysis, things look a bit different. Maybe “buy and hold” isn’t always the best market approach.
This prompts a critical question…
Is there a way to increase the likelihood of being in the market for a 1%-up days while missing the 1% down days?
***How emotion factors into our analysis
Humans are terrible investors thanks to our emotions.
A few successive days of crashing market prices often triggers terror, resulting in panicked selling. But just a few days later, after a robust mean-reversion rally has prices soaring, we’re foaming at the mouth with greed, buying hand-over-fist.
It turns out that most of our extreme emotions – which drive the 1% outlier days, both up and down – tend to occur in close proximity. There’s one caveat though: According to Meb’s research, they usually happen in a downtrend.
My personal hunch is that this is because we’re more sensitive to losing money than making it. So, when prices are falling, we’re more emotional, prone to greater reactivity than proactivity.
In any case, back to Meb:
The vast majority, roughly 60-80%, of the best and worst days occur after the market has already started declining.
The simple reason is that markets are more volatile when they are declining, and when the really volatile events and days occur, they tend to cluster together.
***Let’s look at an example from earlier this year of how this clustering often works
The CNBC article above detailed the eight best-performing days in the S&P in 2023. Three of the eight happened in March – 3/3, 3/14, and 3/16.
So, let’s pull back and get some broader context. Was the market soaring during this stretch?
Not so much. It had been in a downtrend.
Below, we circle these three “up” days in green, but also draw you attention to some pretty brutal “down” days in red.
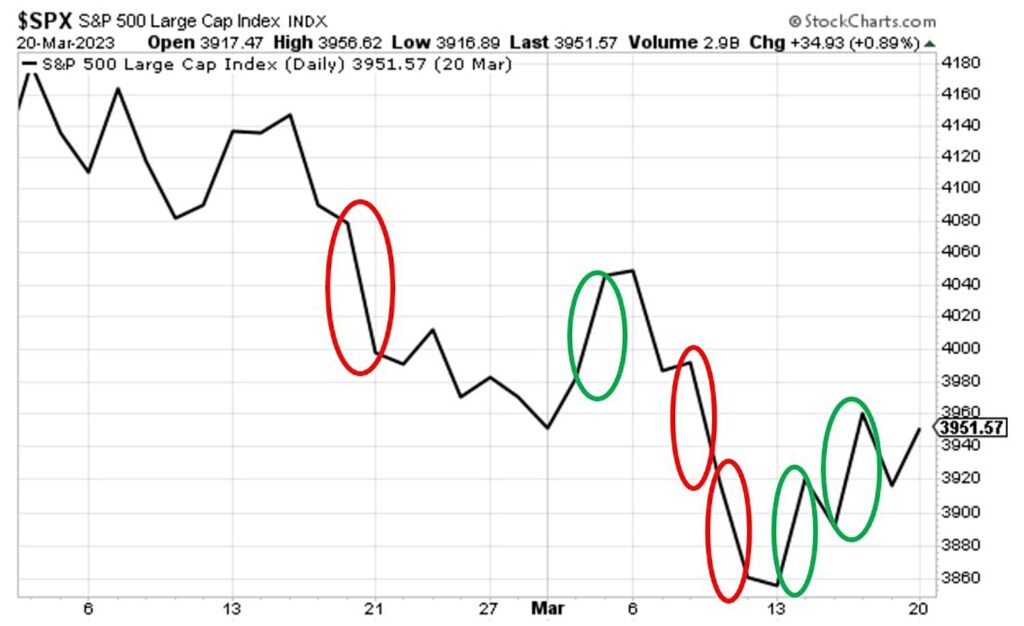 Source: StockCharts.com
Remember, Meb’s research found that missing both the best and worst days provided a better outcome than just sitting through this volatility as a buy-and-hold investor.
In other words, investors would have been better off getting out of the market completely during this stretch.
But wait – isn’t that code for “timing the market?” And that’s impossible, right?
***How a market-timing trader might have handled last March
There’s no one “right” way to trade.
You have your choice of indicators, ratios, charts, asset classes, time periods, you name it.
But one tool that many traders love is a moving average (MA). As the name suggests, this is simply the average of some prior number of days’ worth of market prices. There are long-term moving averages (like 200 days) and there are ultra-short moving averages (some day-traders use moving averages down to the minute).
Let’s look at the S&P earlier this year with a 20-day MA overlay. This is a common time frame for swing traders.
We’ll have one basic market-timing rule. We’re invested when the S&P’s price is above the 20-day MA and we sell when the price falls below it.
Here’s how this basic market-timing technique would have handled not just this stretch in March, but from January to late-April.
(Notice the whipsaw in March, which would have been annoying for sure. But had we followed this basic trading rule, it still would have been profitable.)
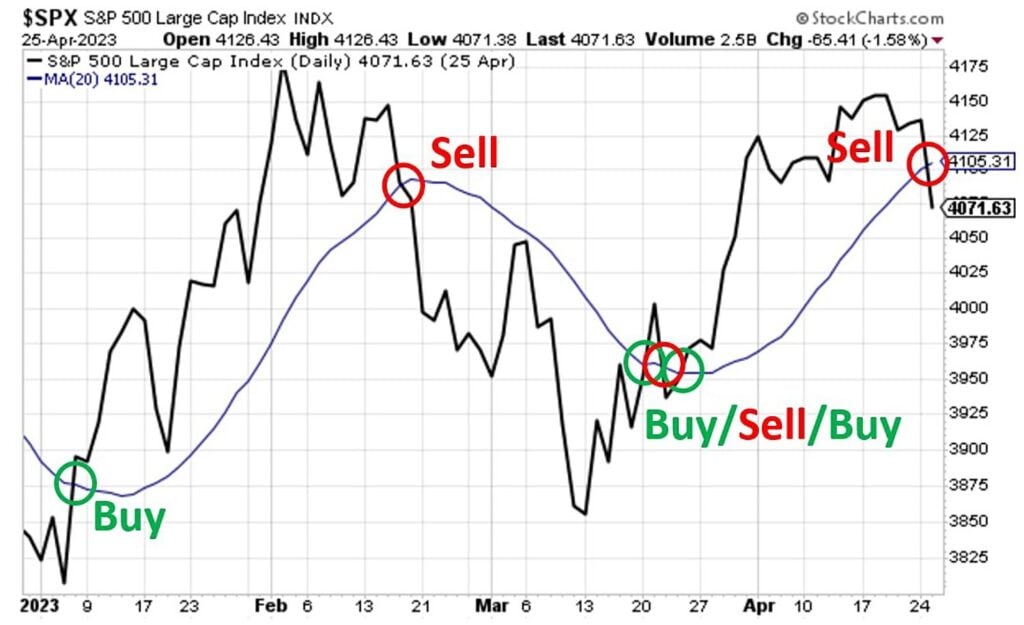 Source: StockCharts.com
***How would this market-timing approach compare to buy-and-hold?
Let’s assume a $10,000 investment.
With buy-and-hold, we buy on January 1st and sell on April 25th (April 25 is relevant only because of the 20-day MA we’re discussing).
This period includes not only the three best days in March, but also a “best” day from January (1/6). So, our buy-and-hold portfolio is benefiting from literally 50% of 2023’s eight biggest up days.
As you can see below, our $10,000 portfolio returns 6.05%, giving us $605 in profit.
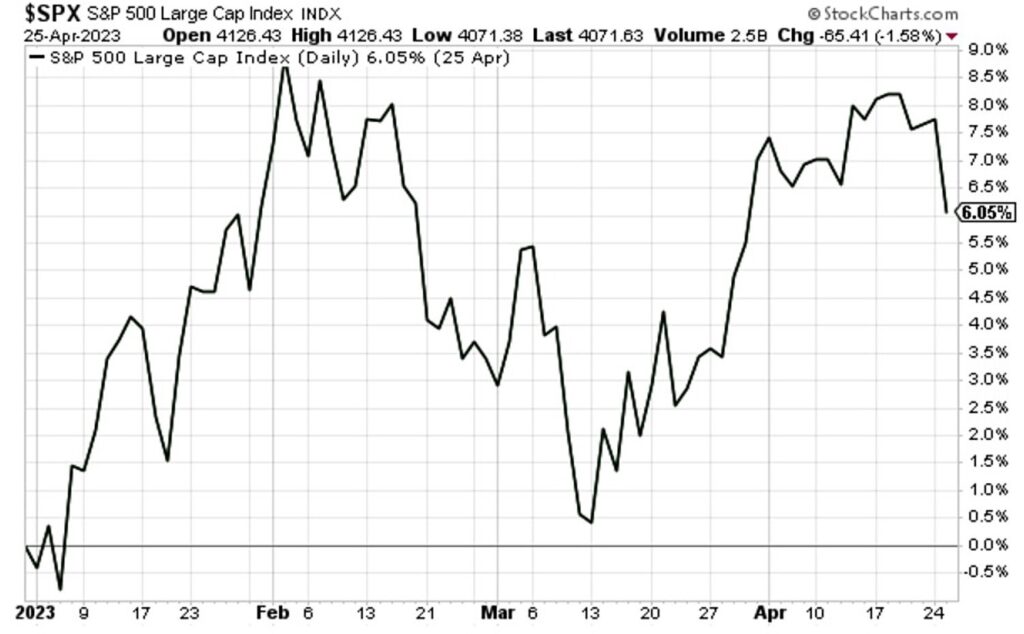 Source: StockCharts.com
And what about our simple market-timing strategy?
Well, we put $10,000 into the market on January 6th when we climb above the 20-day MA and sell on February 20th when we fall below the 20-day MA.
This is a 7.12% return, giving us $712 in profit.
 Source: StockCharts.com
We then step away from the market, not getting in again until March 24th (we’re going to ignore the whipsaw action because it doesn’t materially change our conclusion).
So, we invest our new, higher lump sum of $10,712 on March 24th, holding until our sell-signal triggers on April 25th. This is a 3.11% return.
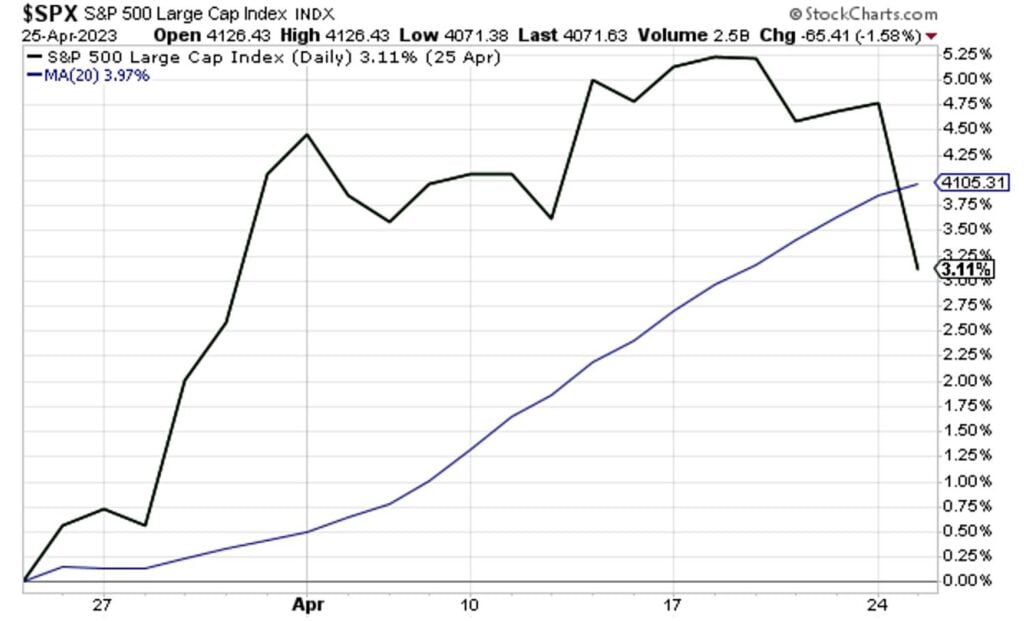 Source: StockCharts.com
This gives us another profit of $333.
Here’s the direct comparison of both trades:
Buy-and-hold: $605 profit.
Market timing: $1,045 profit ($712 on the first trade and $333 on the second trade).
So, market-timing topped buy-and-hold by 73%.
Perhaps this is a reason to learn how to trade?
To be clear, market timing doesn’t always outperform so wonderfully. There are false buy signals… false sell signals… whipsawing price action… and it can be hard on the emotions, to name just a few of the challenges.
But the idea that you can’t time the market just doesn’t hold water.
In fact, as regular Digest readers know, we believe we’re entering a market environment in which sideways volatility could be the norm rather than steady gains. If that’s the case, then knowing how to trade becomes critical since a buy-and-hold approach may have a tougher time.
***Before we sign off, one final illustration of the benefits of trading
In our October 9th Digest, we profiled a handful of stocks that appeared oversold and potentially ripe for a trade based on our analysis of their Relative Strength Index and MACD charts.
To be fair, our takeaway wasn’t that each one of those stocks was a “buy” on that exact day. But they were close enough to be on our radar, in the discussion. So, for convenience, let’s just look at what these stocks have done since that Digest.
For context, since October 9th, the day of that Digest, the S&P has climbed 1.6% as I write Thursday morning.
And here’s the performance of our highlighted stocks from smallest to greatest return:
- Realty Income: 1.9 %
- XLU, the Utilities Select Sector ETF: 6.0%
- Coca-Cola: 6.6%
- Dollar General: 15.6%
One more – we put Verizon on your radar on 10/25. It’s up 4.5%, and recently went ex-dividend, offering an annual yield of 7.4%.
Tying everything together, yes, the “best days” market narrative holds some truth, but it’s a cherry-picked truth. And if the conclusion that the financial talking heads want to draw is “you can’t beat buy-and-hold,” well, ignore them.
There will always be a place for buy-and-hold. But you’ll do yourself, and your portfolio, an enormous favor by adding “opportunistic trading” to your toolkit today.
Have a good evening,
Jeff Remsburg
Legendary fund manager Louis Navellier – a man Forbes calls "the king of quants" – is going "ALL-IN" on this game-changing AI technology. He says, "This is the culmination of everything you've been reading about AI for the last 60 years."Get the details...
Source: Investor Place
