

We recently started a series called “Penny Stock of the Day”. These ideas are geared towards traders with an extremely high risk appetite.
Our Penny Stock of the Day is chosen by screening for stocks under $5 and then applying technical analysis on the shortlisted set of penny stocks showing unusual volume. When making these trades, please make sure to pay vigilant attention to pricing moves and have a strict stop loss in place to avoid significant losses.
Penny Stock of the Day: Compass, Inc. (NYSE: COMP)
Today’s penny stock pick is the technology-enabled real estate brokerage services company, Compass, Inc. (NYSE: COMP).
Compass, Inc. operates a cloud-based platform that provides an integrated suite of software for customer relationship management, marketing, client service, operations, and other functionality, as well as brokerage and adjacent services in the real estate industry. The company offers mobile apps that allow agents to manage their business anywhere as well as designs consumer-grade interfaces, and automated workflows for agent-client interactions.
Website: https://www.compass.com
Latest 10-k report: https://investors.compass.com/financials/sec-filings/sec-filings-details/default.aspx?FilingId=16450831
Analyst Consensus: As per TipRanks Analytics, based on 7 Wall Street analysts offering 12-month price targets for COMP in the last 3 months, the stock has an average price target of $495.72, which is nearly 11115% upside from current levels.
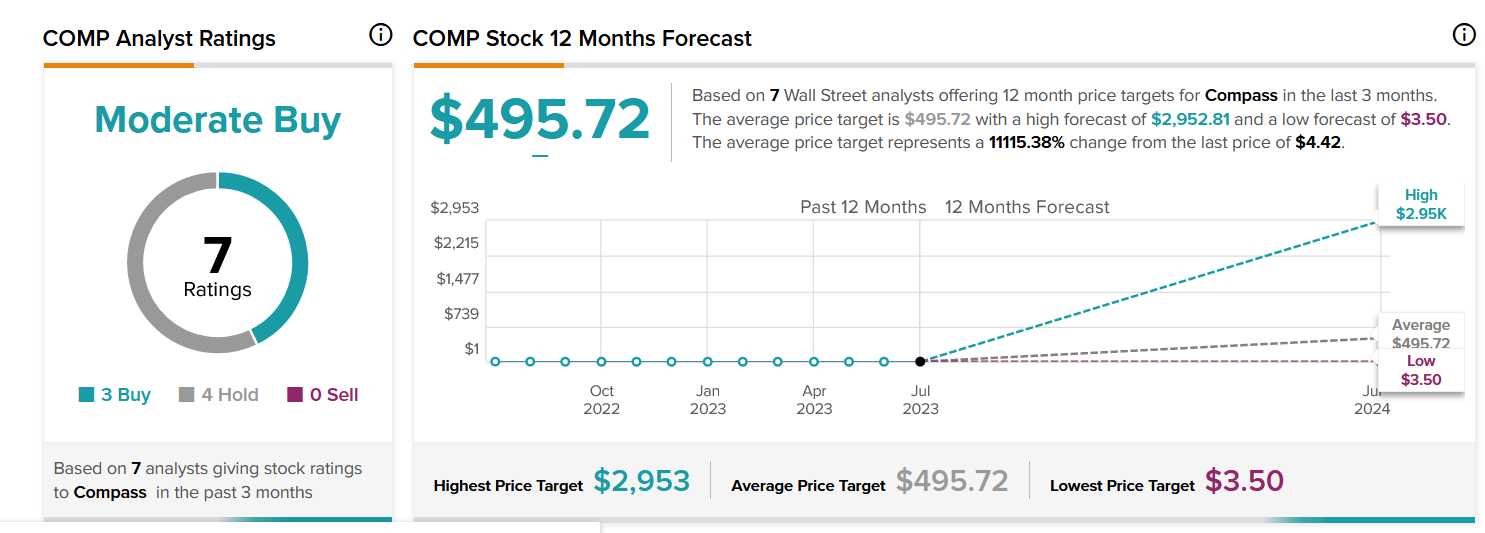
Analysts | Source: TipRanks.com
Potential Catalysts / Reasons for the Hype:
- Ongoing real estate boom in New York City and surrounding areas.
- The company reported strong first-quarter results and indicated that it will be free cash flow positive for the year.
On analyzing the company’s stock charts, there seem to be multiple bullish indications…
Bullish Indications
#1 Symmetrical Triangle Pattern Breakout: The daily chart shows that the stock has currently broken out a symmetrical triangle pattern, which is marked as purple color lines. A symmetrical triangle pattern represents a period of consolidation before the price breaks out. This is typically formed when there is indecision in the price movements and uncertainty among the buyers and sellers. Once a breakout from the upper trend line occurs, it usually signifies the start of a new bullish trend.

COMP – Daily Chart
#2 Bullish ADX and DI: The ADX indicator shows bullishness as the +DI line is above the -DI line, and the ADX line is currently moving higher from below the +DI and -DI lines.
#3 Price above MAs: The stock is currently above its 50-day and 200-day SMA, indicating that the bulls have currently gained control.
#4 MACD above Signal Line: In the daily chart, the MACD (light blue color) is currently above the MACD signal line (orange color). This indicates a possible bullish setup.
#5 Bullish Aroon: The value of Aroon Up (orange line) is above 70 while Aroon Down (blue line) is below 30. This indicates bullishness.
#6 Above Support Area: The weekly chart shows that the stock is currently trading above a support area, which is marked as a pink color dotted line. This looks like a good area for the stock to move higher. The stock is also trading above its 50-week SMA, indicating that the bulls are gaining control.
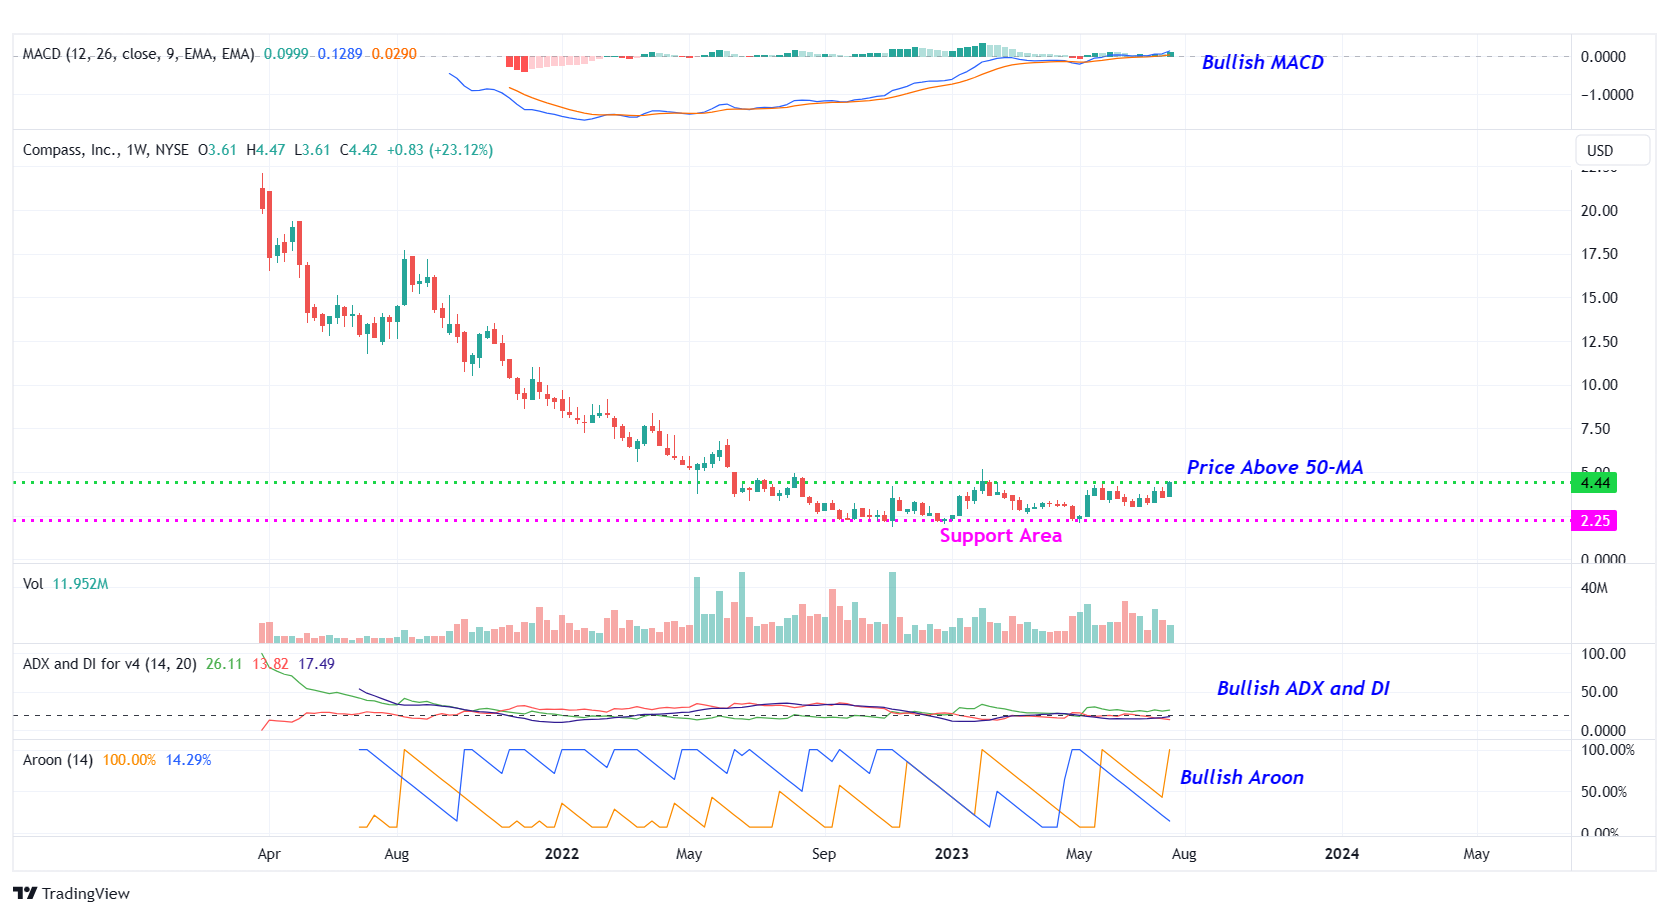
COMP – Weekly Chart
#7 MACD above Signal Line: In the weekly chart, the MACD (light blue color) is currently above the MACD signal line (orange color). This indicates a possible bullish setup.
Recommended Trade (based on the charts)
Buy Levels: If you want to get in on this trade, the ideal buy level for COMP is above the price of $4.45.
Target Prices: Our first target is $5.20. If it closes above that level, the second target price is $6.00.
Stop Loss: To limit risk, place a stop loss below $4.00. Note that the stop loss is on a closing basis.
Our target potential upside is 17% to 35%.
For a risk of $0.45, our first target reward is $0.75, and the second target reward is $1.55. This is a nearly 1:2 and 1:3 risk-reward trade.
In other words, this trade offers 2x to 3x more potential upside than downside.
Potential Risks / Red Flags:
- The company has a history of increasing net losses. The company reported a net loss of $601.5 million for 2022 and $494.1 million for 2021.
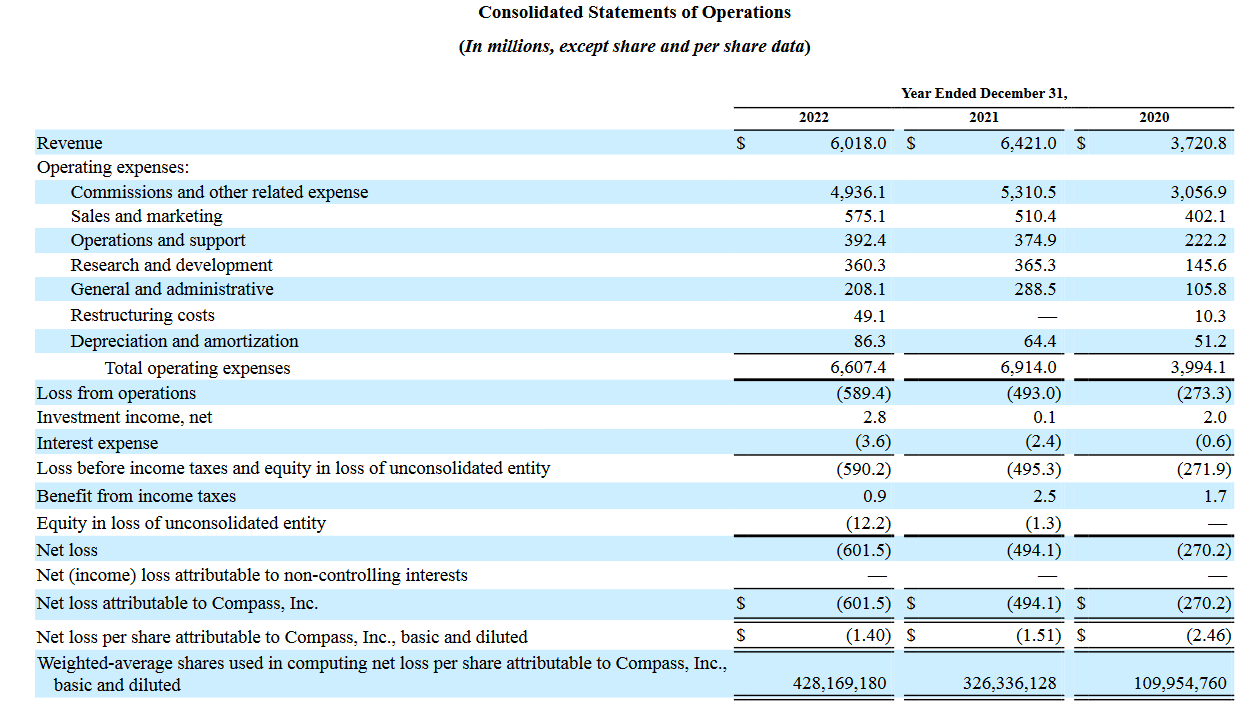
COMP – Consolidated Statements of Operations
- The company’s material portion of real estate brokerage offices and agents are concentrated in certain geographic areas, such as Southern California, Northern California, and the tri-state area. Therefore, any adverse economic, real estate, or business conditions in these geographic areas and/or impacting high-end markets could have a material adverse effect on its operating results.
- Corporate Insiders Sold Shares Worth $55.4M in the Last 3 Months.
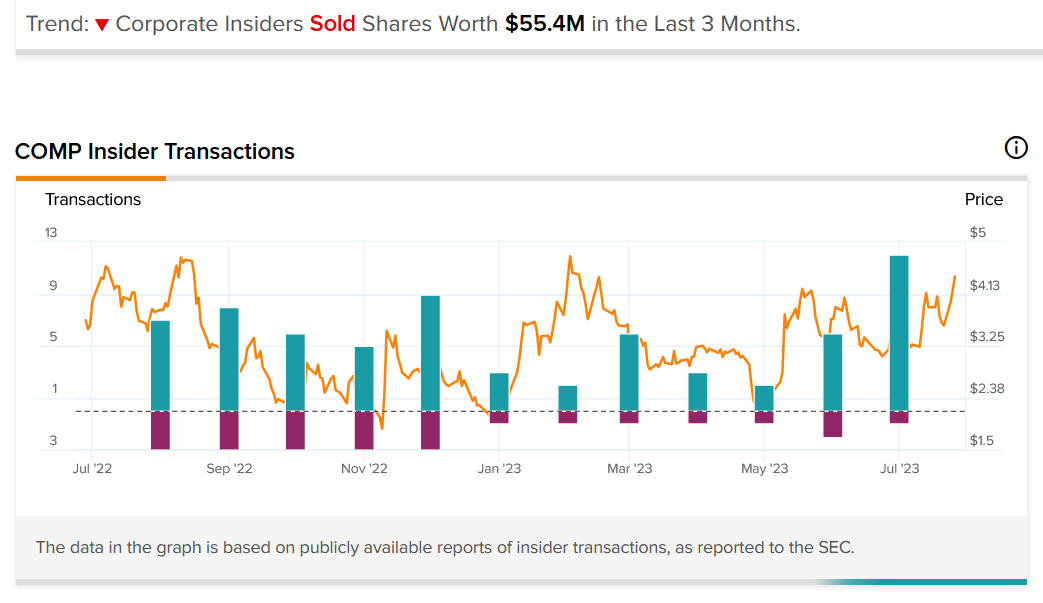
Insiders | Source: TipRanks.com
- The company was formerly known as Urban Compass, Inc. and changed its name to Compass, Inc. in January 2021.
- Hedge Funds Decreased Holdings by 1.5M Shares Last Quarter.
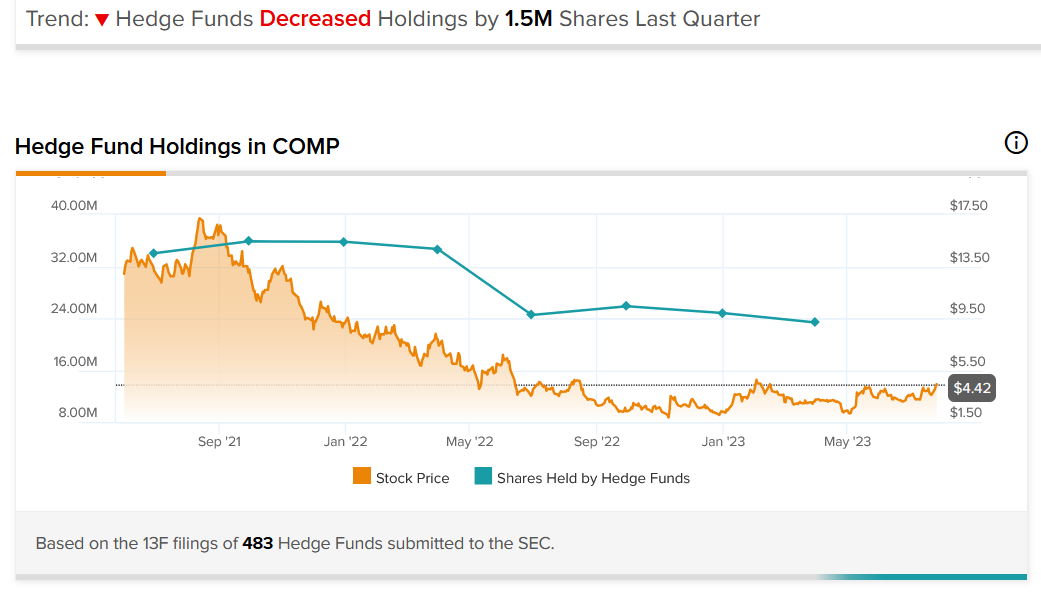
Hedge Funds | Source: TipRanks.com
- Despite being a loss-making company, the executives are being paid significant compensation.
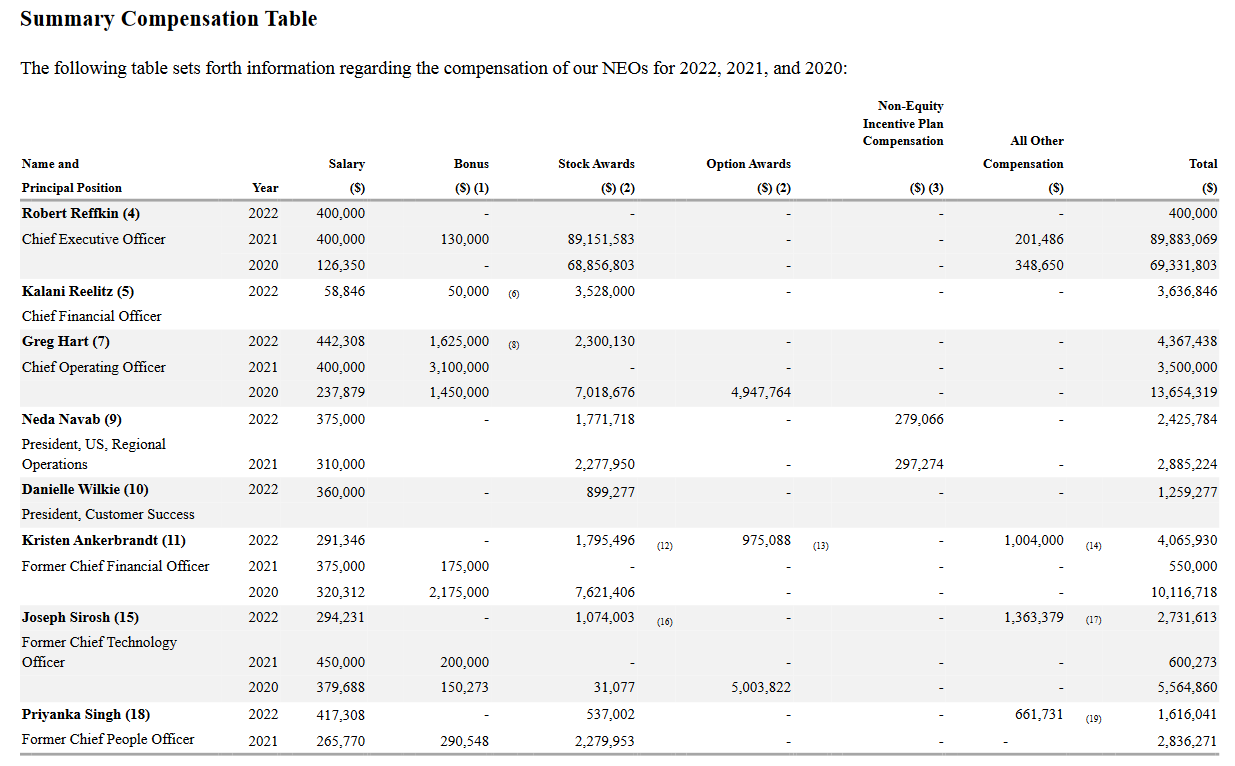
COMP – Executive Compensation
As you can see, today’s featured penny stock offers big upside potential… but it also comes with a number of risks and red flags. As always, when dealing with penny stocks, we advise caution before entering into such high-risk ventures. Remember to think before you trade… understand the risks… and if you decide to trade, stick to your stop-losses!
Happy Trading!
Trades of the Day Research Team
READ BEFORE TRADING PENNY STOCKS: The allure of penny stocks lies in their potential to deliver massive gains in a short period of time. However, in exchange for that opportunity, most penny stocks carry tremendous risk. They can be extremely volatile and are susceptible to “pump and dump” schemes and fraud.
Unlike regular stocks, the financial condition of most penny stock companies can be extremely difficult to analyze, as the majority of such stocks are traded on over-the-counter (OTC) exchanges, which are typically less transparent and less regulated than the major exchanges. In fact, in the penny stock space, it’s often easier to spot warning signs and red flags than it is to identify a sound investment. Nevertheless, we do our best to identify short-term trade opportunities in this exciting space because we know some of our readers are looking for high-risk, high-reward ideas. We just urge you to make sure you fully understand the risks before making any of these trades.
Source: Trades Of The Day
