
We recently started a series called “Penny Stock of the Day”. These ideas are geared towards traders with an extremely high risk appetite.
Our Penny Stock of the Day is chosen by screening for stocks under $5 and then applying technical analysis on the shortlisted set of penny stocks showing unusual volume. When making these trades, please make sure to pay vigilant attention to pricing moves and have a strict stop loss in place to avoid significant losses.
Penny Stock of the Day: fuboTV Inc. (NYSE: FUBO)
Today’s penny stock pick is the operator of streaming platform, fuboTV Inc. (NYSE: FUBO).
fuboTV Inc. operates a live TV streaming platform for live sports, news, and entertainment content in the United States and internationally. Its fuboTV platform allows customers to access content through streaming devices, as well as on SmartTVs, computers, mobile phones, and tablets.
Website: https://www.fubo.tv
Latest 10-k report: https://ir.fubo.tv/financials/sec-filings/sec-filings-details/default.aspx?FilingId=16436465
Analyst Consensus: As per TipRanks Analytics, based on 7 Wall Street analysts offering 12-month price targets for FUBO in the last 3 months, the stock has an average price target of $3.26, which is nearly 75% upside from current levels.
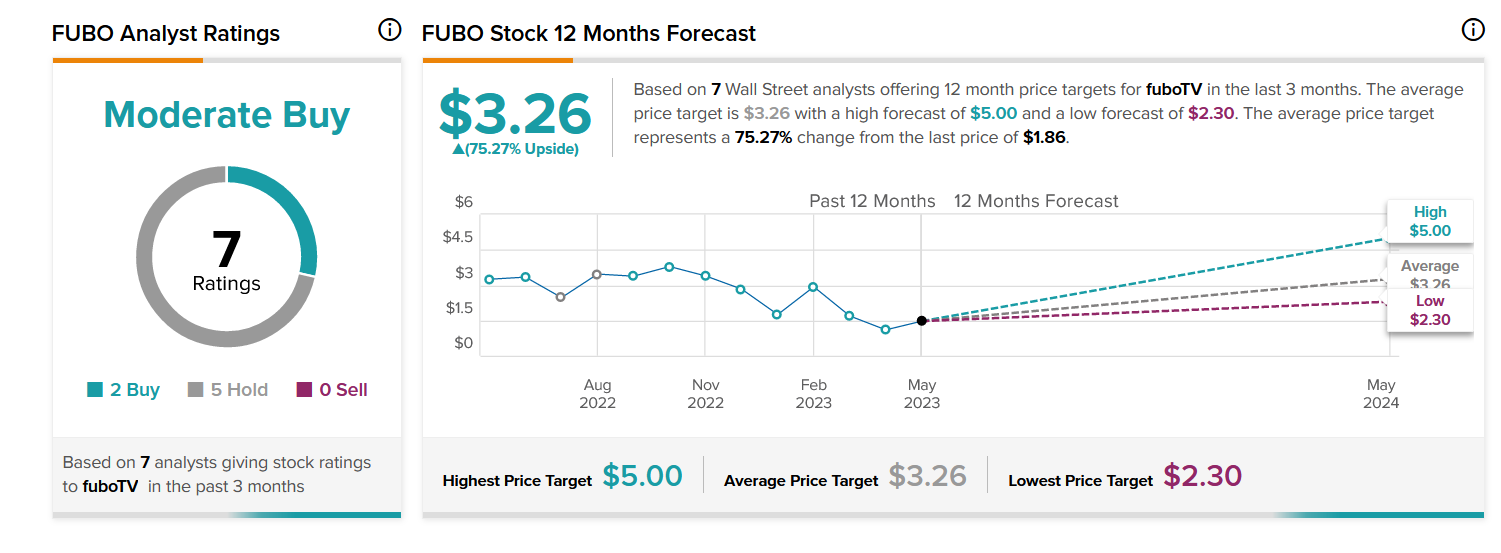
Analysts | Source: TipRanks.com
Potential Catalysts / Reasons for the Hype:
- The company recently reported a first-quarter beat and raised its outlook. First-quarter FY23 sales growth was reported at 34% year-on-year to $324.4 million, beating the consensus of $303.39 million. FUBO raised its FY23 revenue outlook to $1.264 billion-$1.298 billion, above the Street view of $1.25 billion.
- Corporate Insiders Bought Shares Worth $32.4K in the Last 3 Months.
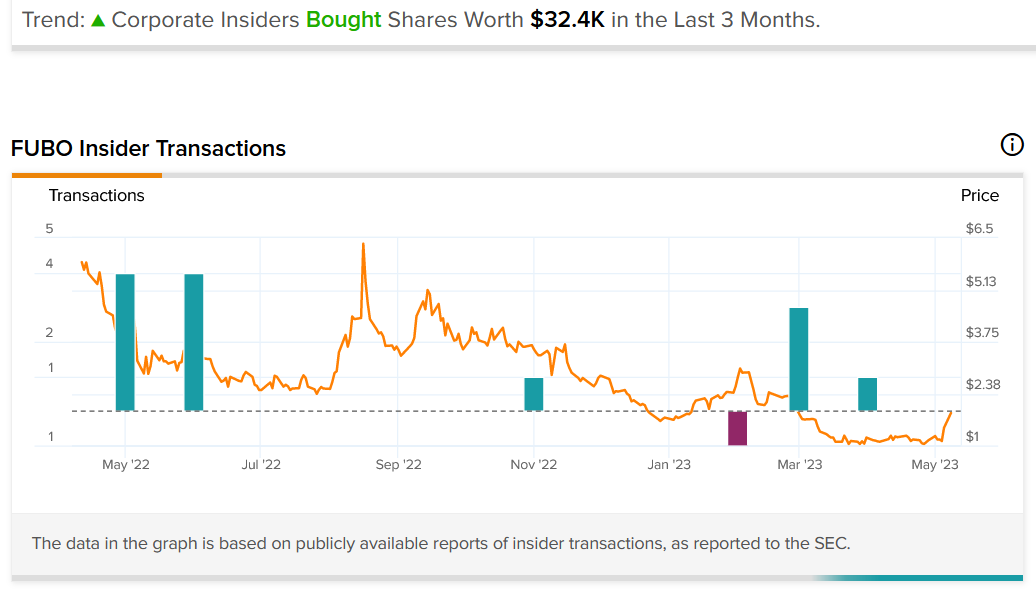
Insiders | Source: TipRanks.com
- Hedge Funds Increased Holdings by 69.8K Shares Last Quarter.
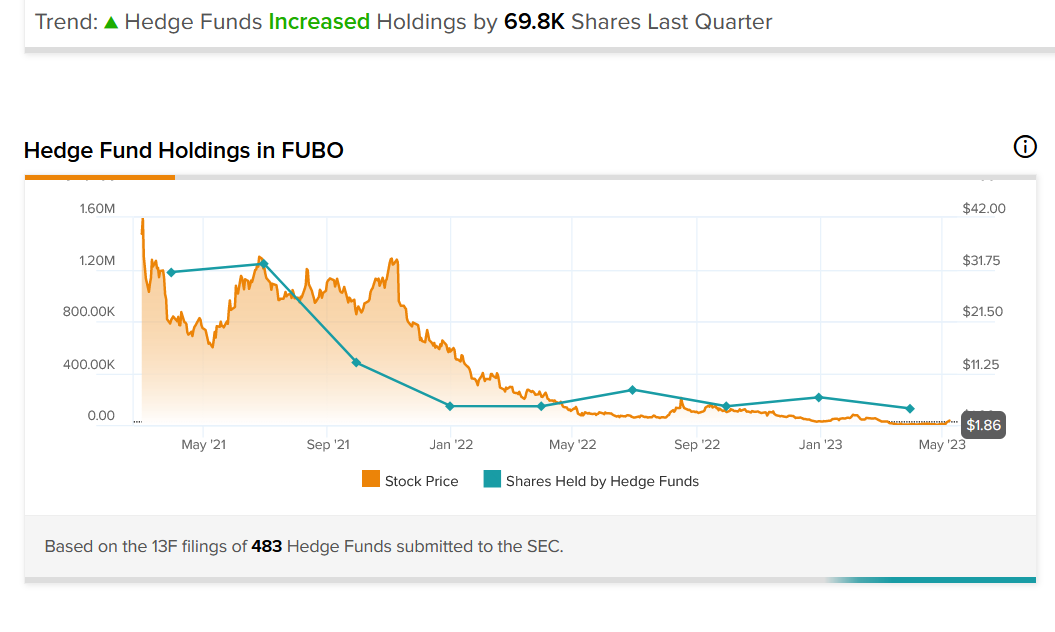
Hedge Funds | Source: TipRanks.com
On analyzing the company’s stock charts, there seem to be multiple bullish indications…
Bullish Indications
#1 Falling Wedge Pattern Breakout: The daily chart shows that the stock has been forming a falling wedge pattern for the past several months. These are marked as purple color lines. It has typically taken support at the bottom of the wedge before bouncing back. The stock has currently broken out from the falling wedge pattern. Once the stock breaks out of the falling wedge pattern, it could move higher.
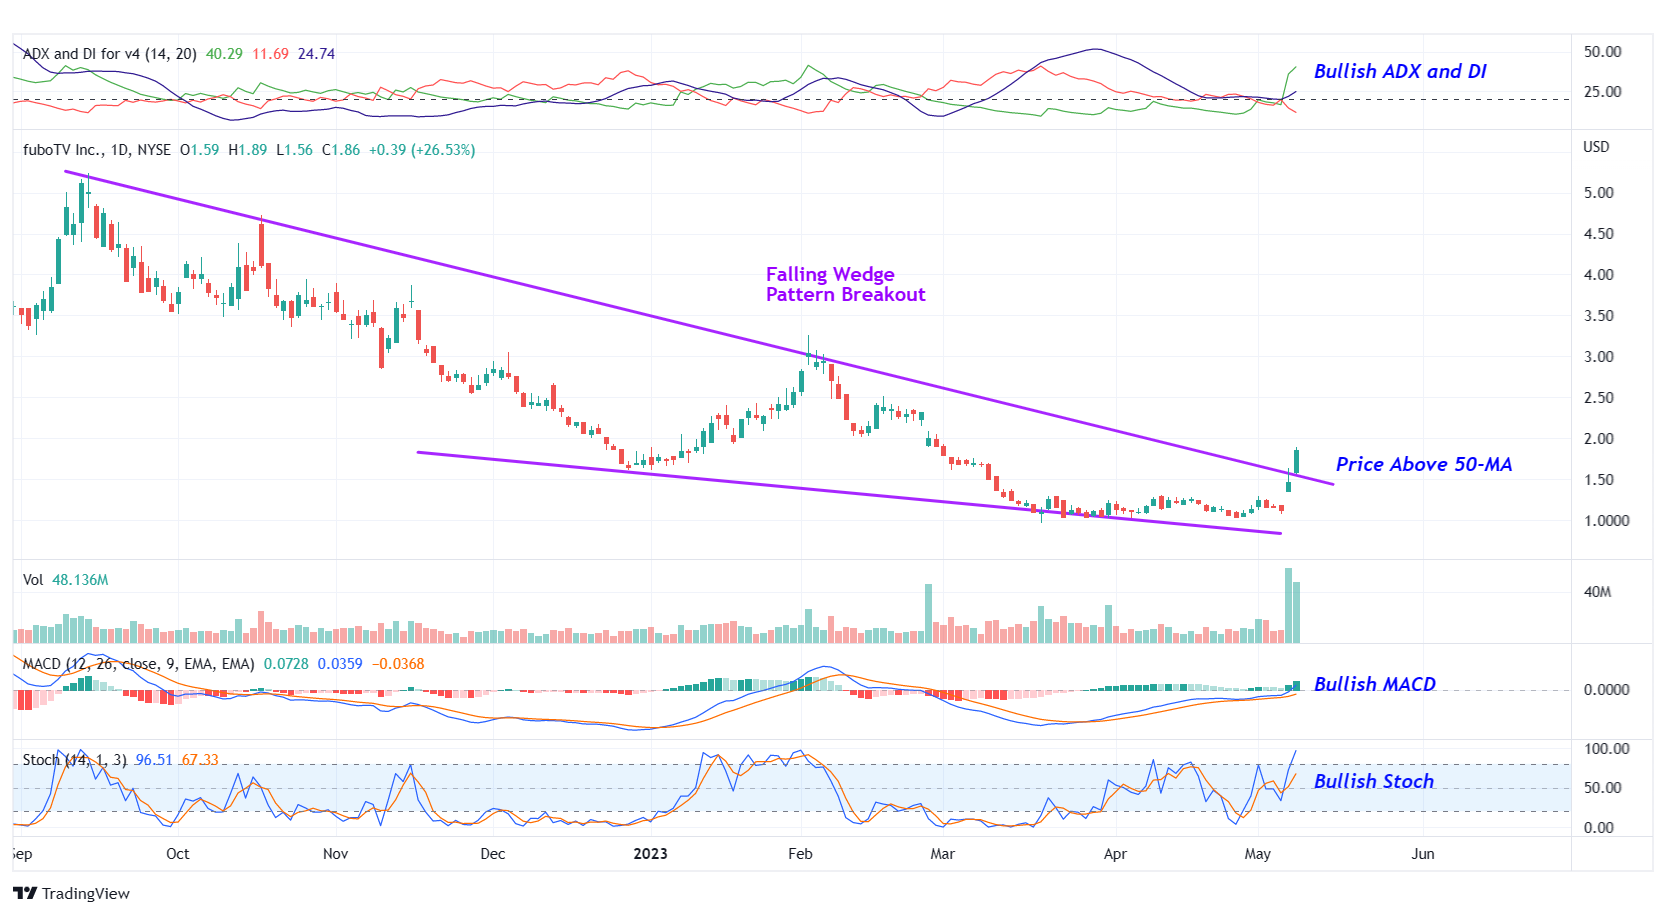
FUBO – Daily Chart
#2 Bullish ADX and DI: The ADX indicator shows bullishness as the +DI line is above the -DI line, and the ADX line is currently moving higher from below the +DI and -DI lines.
#3 Price above MA: The stock is currently above its 50-day SMA, indicating that the bulls have currently gained control.
#4 Bullish Stoch: The %K line of the stochastic is above the %D line, and has also moved higher from oversold levels, indicating possible bullishness.
#5 MACD above Signal Line: In the daily chart, the MACD (light blue color) is currently above the MACD signal line (orange color). This indicates a possible bullish setup.
#6 Above Support Area: The weekly chart shows that the stock is currently trading above a support area, which is marked as a pink color dotted line. This looks like a good area for the stock to move higher.
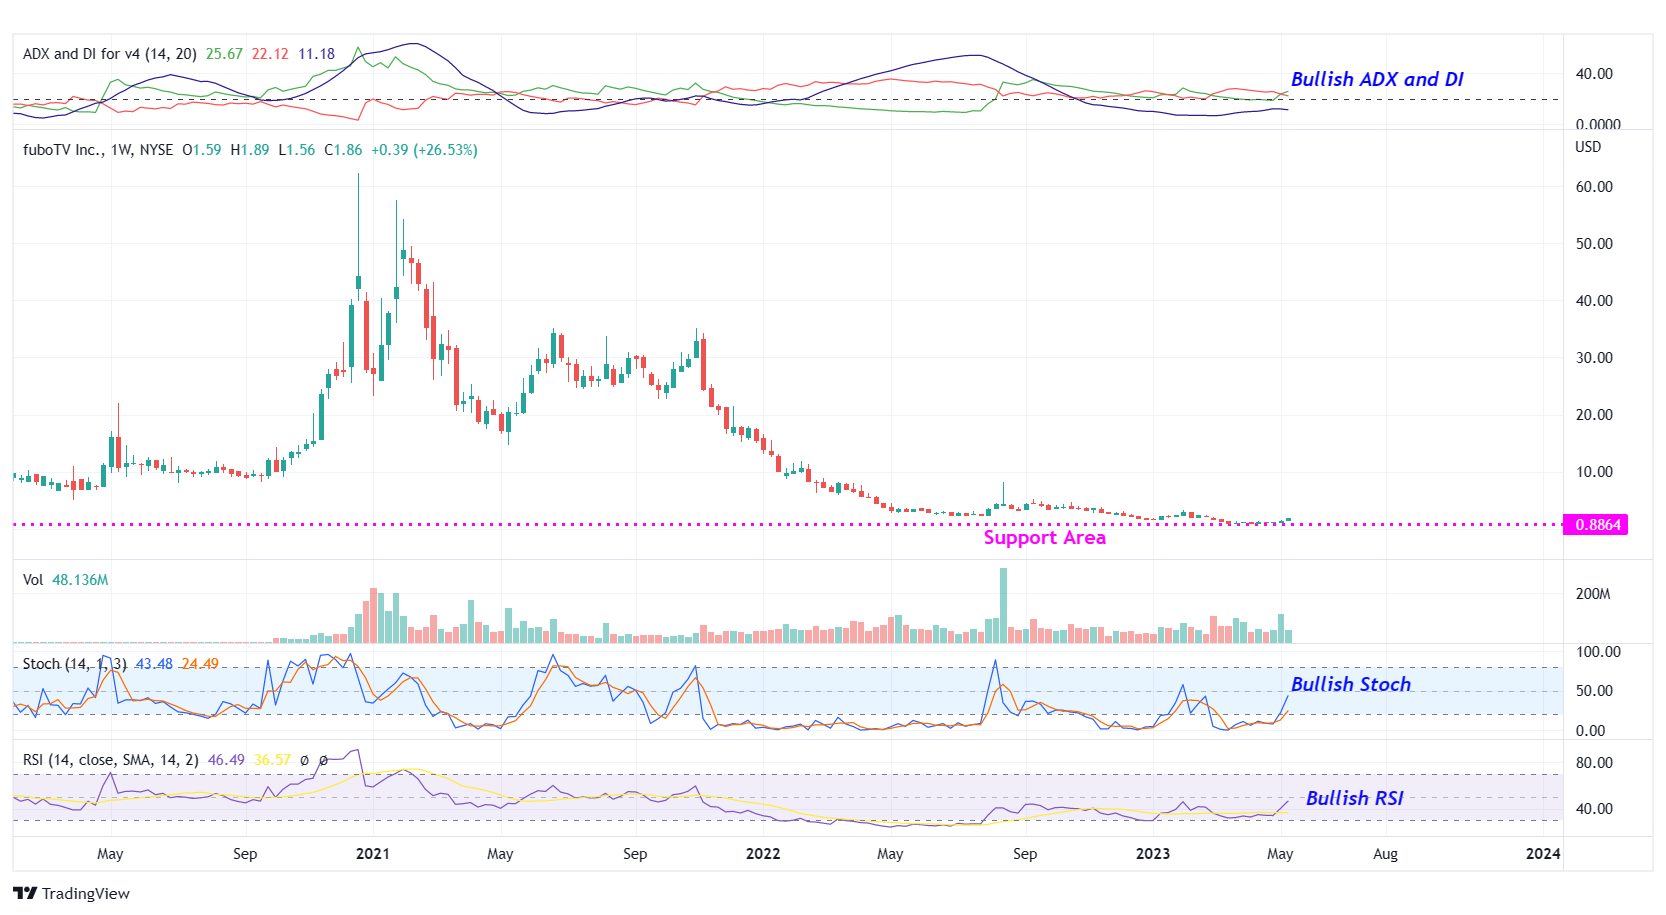
FUBO – Weekly Chart
#7MACD above Signal Line: In the weekly chart, the MACD (light blue color) is currently above the MACD signal line (orange color). This indicates a possible bullish setup.
Recommended Trade (based on the charts)
Buy Levels: If you want to get in on this trade, the ideal buy level for FUBO is above the price of $1.90.
Target Prices: Our first target is $2.40. If it closes above that level, the second target price is $2.90.
Stop Loss: To limit risk, place a stop loss at $1.60. Note that the stop loss is on a closing basis.
Our target potential upside is 26% to 53%.
For a risk of $0.30, our first target reward is $0.50, and the second target reward is $1.00. This is a nearly 1:2 and 1:3 risk-reward trade.
In other words, this trade offers 2x to 3x more potential upside than downside.
Potential Risks / Red Flags:
- The company has incurred losses since its inception. FUBO’s net loss for the year ended December 31, 2022, was $561.9 million.
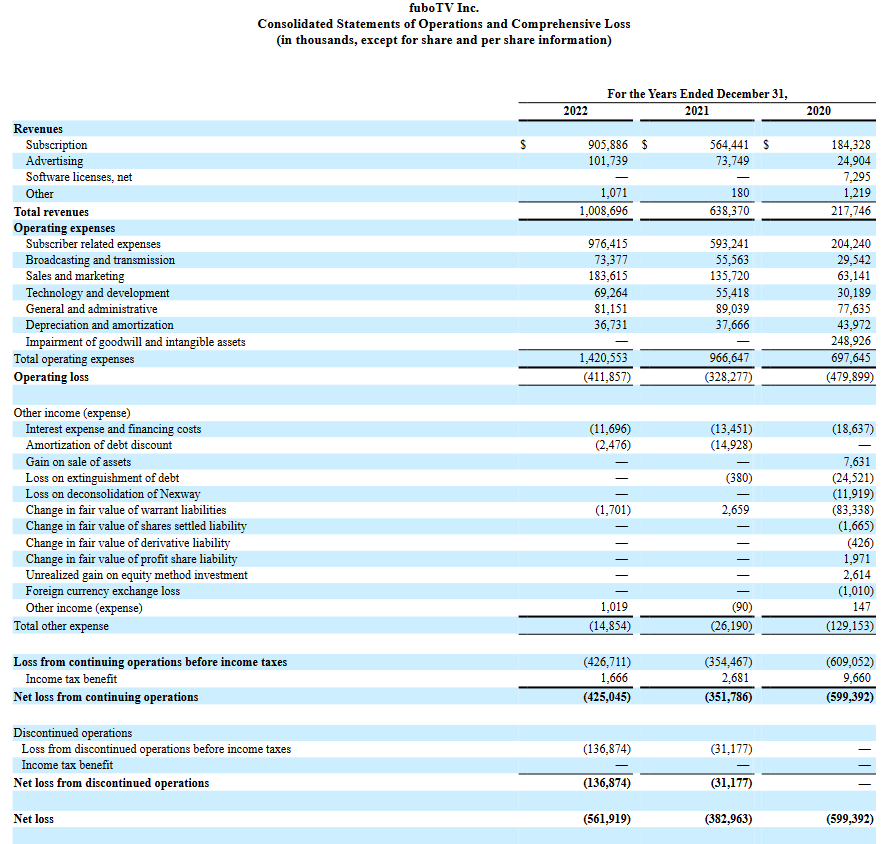
FUBO – Consolidated Statement of Operations
- The company has ongoing legal proceedings like the lawsuit titled “In re fuboTV Inc. Securities Litigation, No. 21-cv-01412 (S.D.N.Y.)”.
- The company has $410.2 million of outstanding indebtedness on a consolidated basis as of December 31, 2022.
- Despite being a loss-making company, the executives are being paid significant compensation.
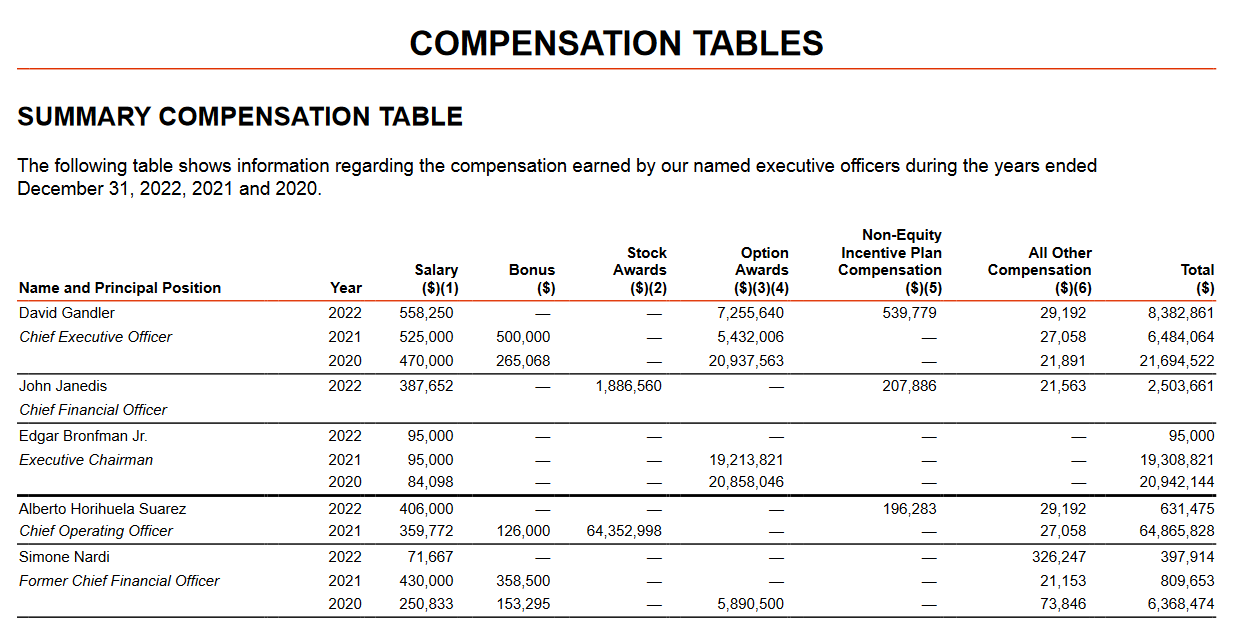
FUBO – Executive Compensation
As you can see, today’s featured penny stock offers big upside potential… but it also comes with a number of risks and red flags. As always, when dealing with penny stocks, we advise caution before entering into such high-risk ventures. Remember to think before you trade… understand the risks… and if you decide to trade, stick to your stop-losses!
Happy Trading!
Trades of the Day Research Team
READ BEFORE TRADING PENNY STOCKS: The allure of penny stocks lies in their potential to deliver massive gains in a short period of time. However, in exchange for that opportunity, most penny stocks carry tremendous risk. They can be extremely volatile and are susceptible to “pump and dump” schemes and fraud.
Unlike regular stocks, the financial condition of most penny stock companies can be extremely difficult to analyze, as the majority of such stocks are traded on over-the-counter (OTC) exchanges, which are typically less transparent and less regulated than the major exchanges. In fact, in the penny stock space, it’s often easier to spot warning signs and red flags than it is to identify a sound investment. Nevertheless, we do our best to identify short-term trade opportunities in this exciting space because we know some of our readers are looking for high-risk, high-reward ideas. We just urge you to make sure you fully understand the risks before making any of these trades.
Imagine having 12 new monthly income checks, carrying the potential of up to 21% yields.This is possible because of a tested strategy to get paid out regularly, like a paycheck. For over a decade, I have helped more than 26,000 investors secure 12 new monthly payouts. Meaning, you know exactly how much you'll make every month... Because of some stocks that pay us 8%,13.4%, and even 21.6% yields. See it for yourself here.
Source: Trades of the Day
