
Picking a winning trade on a consistent basis is not simply a stroke of luck. It’s the result of calculated screening, planning, and deliberation.
With this in mind, we have started a new weekly series on our top 10 stocks to watch this week — stocks that look poised for a possible breakout in the coming days. Traders should add these stocks to their watchlist now.
The Top 10 Stocks to Watch This Week for Possible Breakouts
| Sl # | Name of the Stock | Stock Ticker | Last Close | Buy Level(s) | Reason |
| 1 | Emerson Electric Co. | NYSE: EMR | $86.36 | $87.40 | Symmetrical Triangle Pattern |
| 2 | Teck Resources Limited | NYSE: TECK | $45.22 | $46.00 | Ascending Triangle Pattern |
| 3 | Horizon Therapeutics Public Limited Company | NASDAQ: HZNP | $111.60 | $113.40 | Symmetrical Triangle Pattern Breakout |
| 4 | JPMorgan Chase & Co. | NYSE: JPM | $138.73 | $140.00 | Flag Pattern Breakout |
| 5 | Dell Technologies Inc. | NYSE: DELL | $43.28 | $43.50 | Symmetrical Triangle Pattern Breakout |
| 6 | Life Storage, Inc. | NYSE: LSI | $137.00 | $135.00 | Downtrend Channel Breakout |
| 7 | Merus N.V. | NASDAQ: MRUS | $21.75 | $22.30 | Symmetrical Triangle Pattern Breakout |
| 8 | WW International, Inc. | NASDAQ: WW | $7.56 | $7.80 | Symmetrical Triangle Pattern Breakout |
| 9 | Bio-Techne Corporation | NASDAQ: TECH | $85.24 | $87.10 | Symmetrical Triangle Pattern Breakout |
| 10 | Rapid7, Inc. | NASDAQ: RPD | $46.96 | $48.30 | Symmetrical Triangle Pattern |
Important: Typically, these trades offer a risk: reward ratio of 1:2 or 1:3 in the next 6 months, which implies 2x to 3x rewards when compared to risks. So, be sure to set your stop-loss levels and target prices accordingly to manage your risk. In addition, these trade ideas are triggered using daily closing prices, not intra-day pricing. So, if you participate in these trades, make sure that you only buy the stock once its daily close is above the recommended price level.
That said, here are the top 10 stocks to watch for a breakout, in no particular order.
#1 Emerson Electric Co. (NYSE: EMR)
Sector: Industrials | Specialty Industrial Machinery
Reason: Formation of a Symmetrical Triangle Pattern
A symmetrical triangle is a chart pattern formed by two converging trend lines connecting a series of sequential peaks and troughs. These two lines result in the formation of a triangle that appears to be symmetrical.
A symmetrical triangle pattern is usually formed when there is indecision in the price movements and there is uncertainty among the buyers and sellers. This chart pattern represents a period of consolidation before the price breaks out or breaks down. In case a breakout occurs from the upper trend line, it is a strong bullish indication as it signifies the start of a new bullish trend.
Buy Level(s): The ideal buy level for EMR is if the stock has a daily close above the breakout level of the symmetrical triangle pattern, at around $87.40. This is marked in the chart below as a green color dotted line.
Daily chart – EMR

EMR Symmetrical Triangle Pattern
#2 Teck Resources Limited (NYSE: TECK)
Sector: Basic Materials | Other Industrial Metals & Mining
Reason: Formation of an Ascending Triangle Pattern
An ascending triangle pattern is a bullish pattern formed by drawing a horizontal line along the swing highs, and a rising trendline along the swing lows. These two lines result in the formation of a triangle. A breakout from this pattern is typically a strong bullish indication.
Buy Level(s): The ideal buy level for TECK is if the stock breaks out of the ascending triangle pattern and has a daily close above the near-term resistance level of $46.00. This is marked in the chart below as a green color dotted line.
Daily chart – TECK
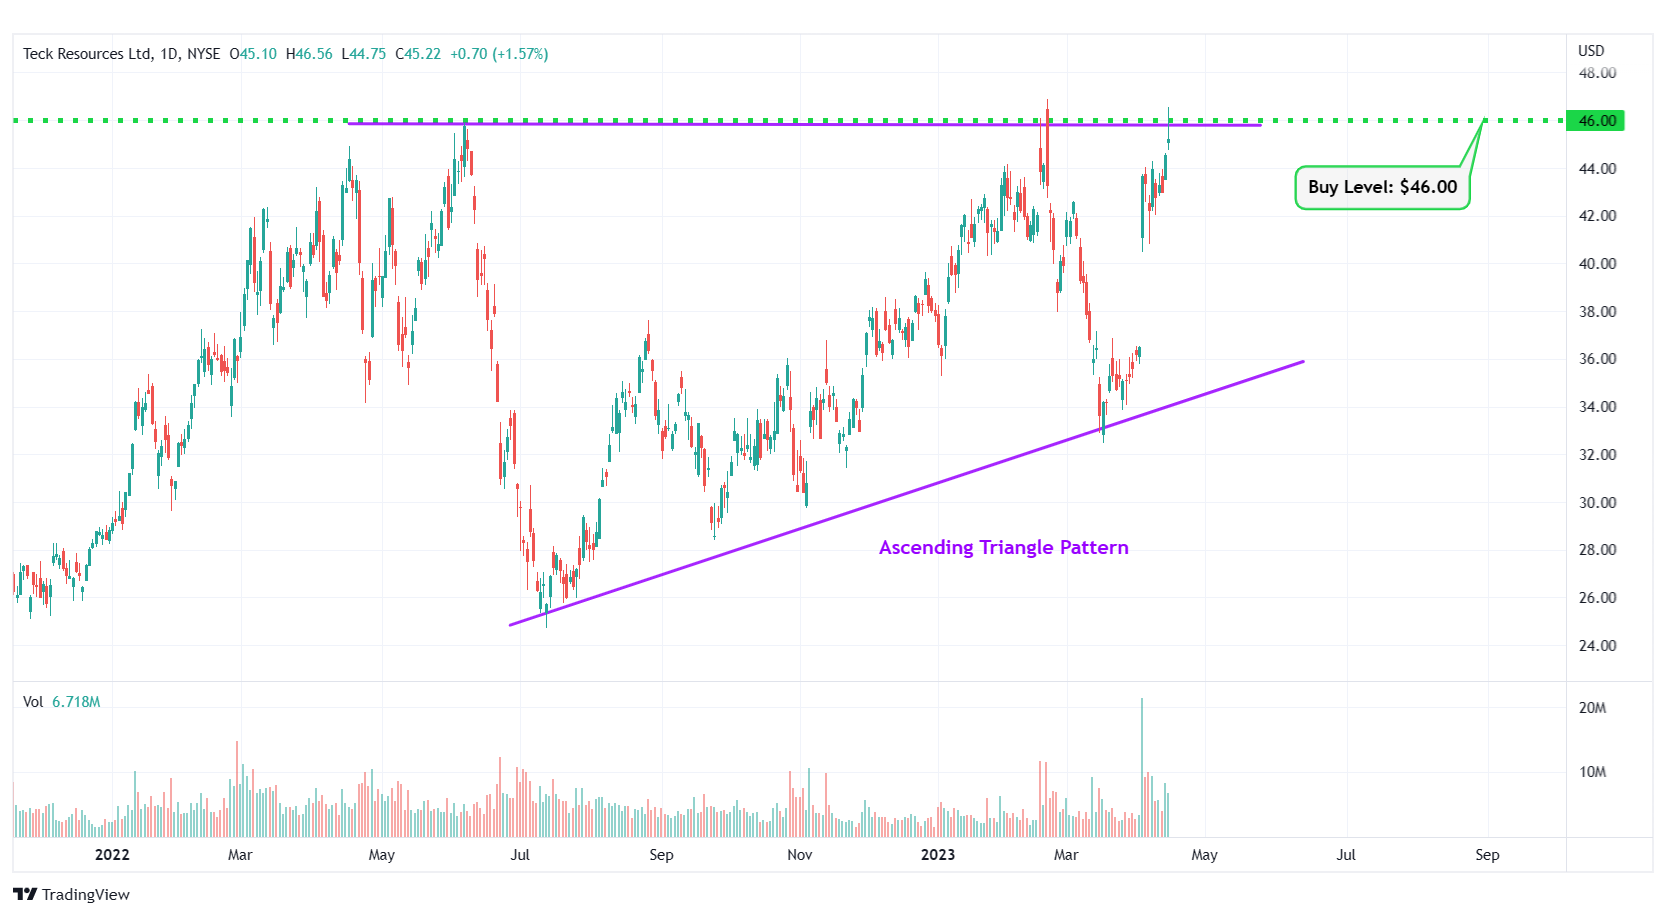
TECK Ascending Triangle Pattern
#3 Horizon Therapeutics Public Limited Company (NASDAQ: HZNP)
Sector: Healthcare | Drug Manufacturers – General
Reason: Symmetrical Triangle Pattern Breakout
A symmetrical triangle is a chart pattern formed by two converging trend lines connecting a series of sequential peaks and troughs. These two lines result in the formation of a triangle that appears to be symmetrical.
A symmetrical triangle pattern is usually formed when there is indecision in the price movements and there is uncertainty among the buyers and sellers. This chart pattern represents a period of consolidation before the price breaks out or breaks down. In case a breakout occurs from the upper trend line, it is a strong bullish indication as it signifies the start of a new bullish trend.
Buy Level(s): The stock has currently broken out of a symmetrical triangle pattern. However, the ideal buy level for HZNP is if the stock closes above the immediate resistance level of $113.40. This is marked in the chart below as a green color dotted line.
Daily chart – HZNP
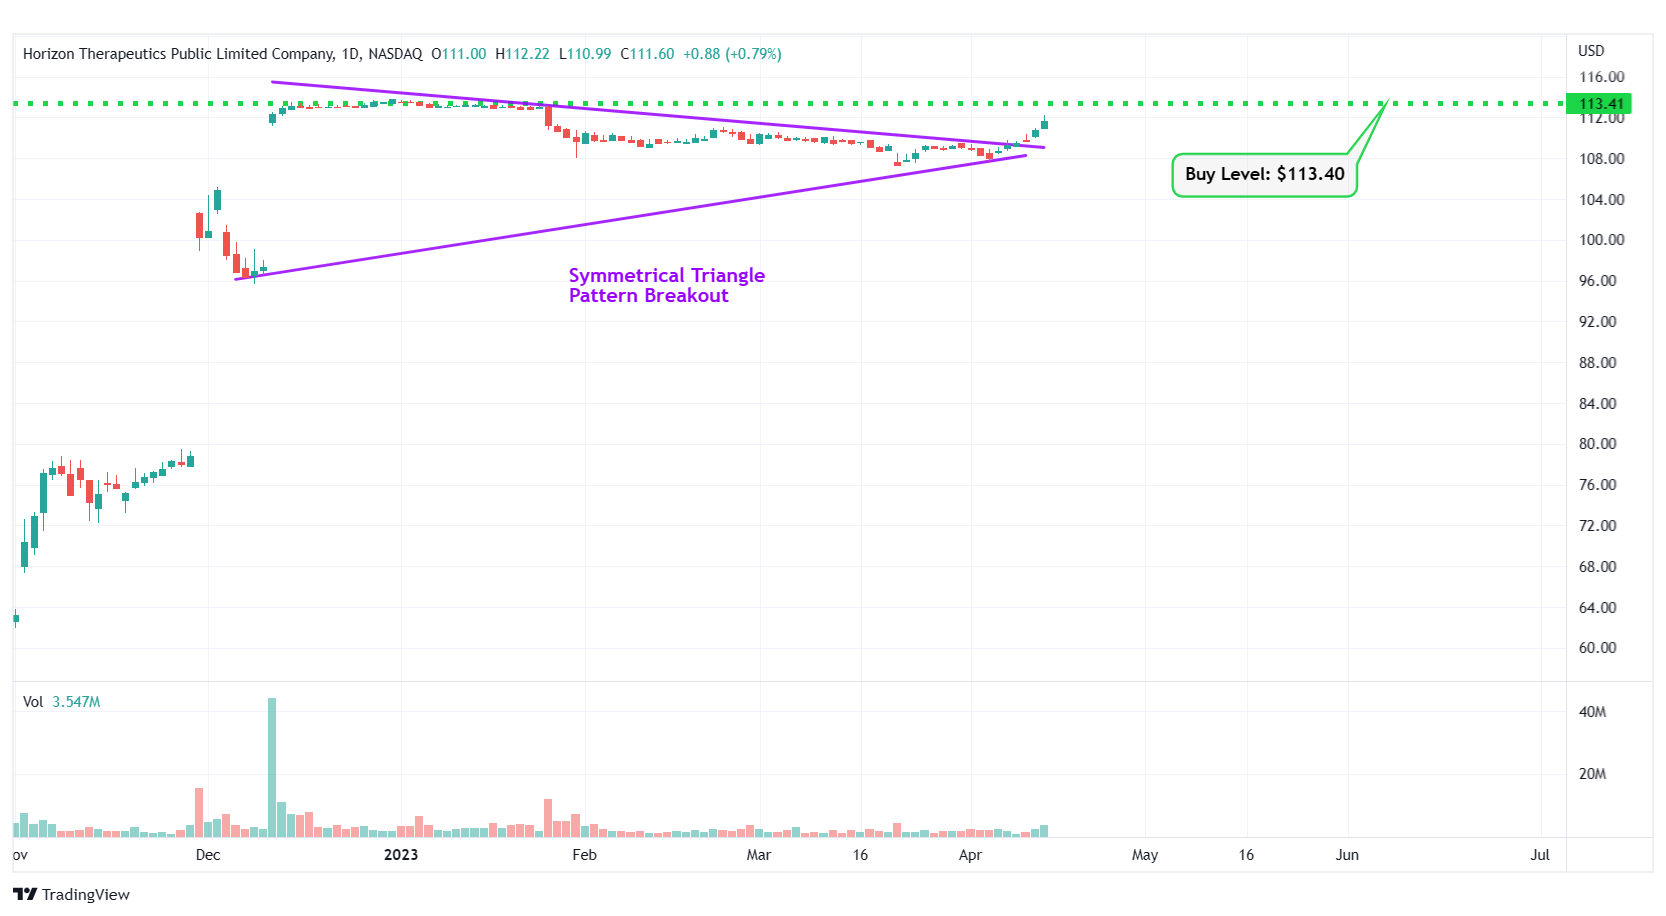
HZNP Symmetrical Triangle Pattern Breakout
#4 JPMorgan Chase & Co. (NYSE: JPM)
Sector: Financial | Banks – Diversified
Reason: Breakout From a Flag Pattern
A flag pattern is a short-term continuation pattern that marks a small consolidation before the previous move resumes. The pattern is formed when the market consolidates in a narrow range after a sharp move. For a stock in an uptrend, a breakout from this pattern is typically a strong bullish indication.
Buy Level(s): Although the stock has currently broken out of the flag pattern, the ideal buy level for JPM is above the near-term resistance level of $140.00. This is marked in the chart below as a green color dotted line.
Daily chart – JPM

JPM Flag Pattern Breakout
#5 Dell Technologies Inc. (NYSE: DELL)
Sector: Technology | Computer Hardware
Reason: Symmetrical Triangle Pattern Breakout
A symmetrical triangle is a chart pattern formed by two converging trend lines connecting a series of sequential peaks and troughs. These two lines result in the formation of a triangle that appears to be symmetrical.
A symmetrical triangle pattern is usually formed when there is indecision in the price movements and there is uncertainty among the buyers and sellers. This chart pattern represents a period of consolidation before the price breaks out or breaks down. In case a breakout occurs from the upper trend line, it is a strong bullish indication as it signifies the start of a new bullish trend.
Buy Level(s): The stock has currently broken out of a symmetrical triangle pattern. However, the ideal buy level for DELL is if the stock closes above the immediate resistance level of $43.50. This is marked in the chart below as a green color dotted line.
Daily chart – DELL

DELL Symmetrical Triangle Pattern Breakout
#6 Life Storage, Inc. (NYSE: LSI)
Sector: Real Estate | REIT – Industrial
Reason: Downtrend Channel Breakout
A downtrend or descending channel is the price action contained between downward-sloping parallel lines. It is formed by two lines that are drawn by connecting the lower highs and lower lows of a stock’s price. Even though this is typically a bearish pattern, a breakout from the upper rail of this pattern is considered a good bullish indication.
Buy Level(s): The daily chart shows that the stock has currently broken out of a downtrend channel. However, there is a near-term resistance level for the stock. Hence, the ideal buy level for LSI is if the stock has a daily close above $135.00. This is marked in the chart below as a green color dotted line.
Daily chart – LSI
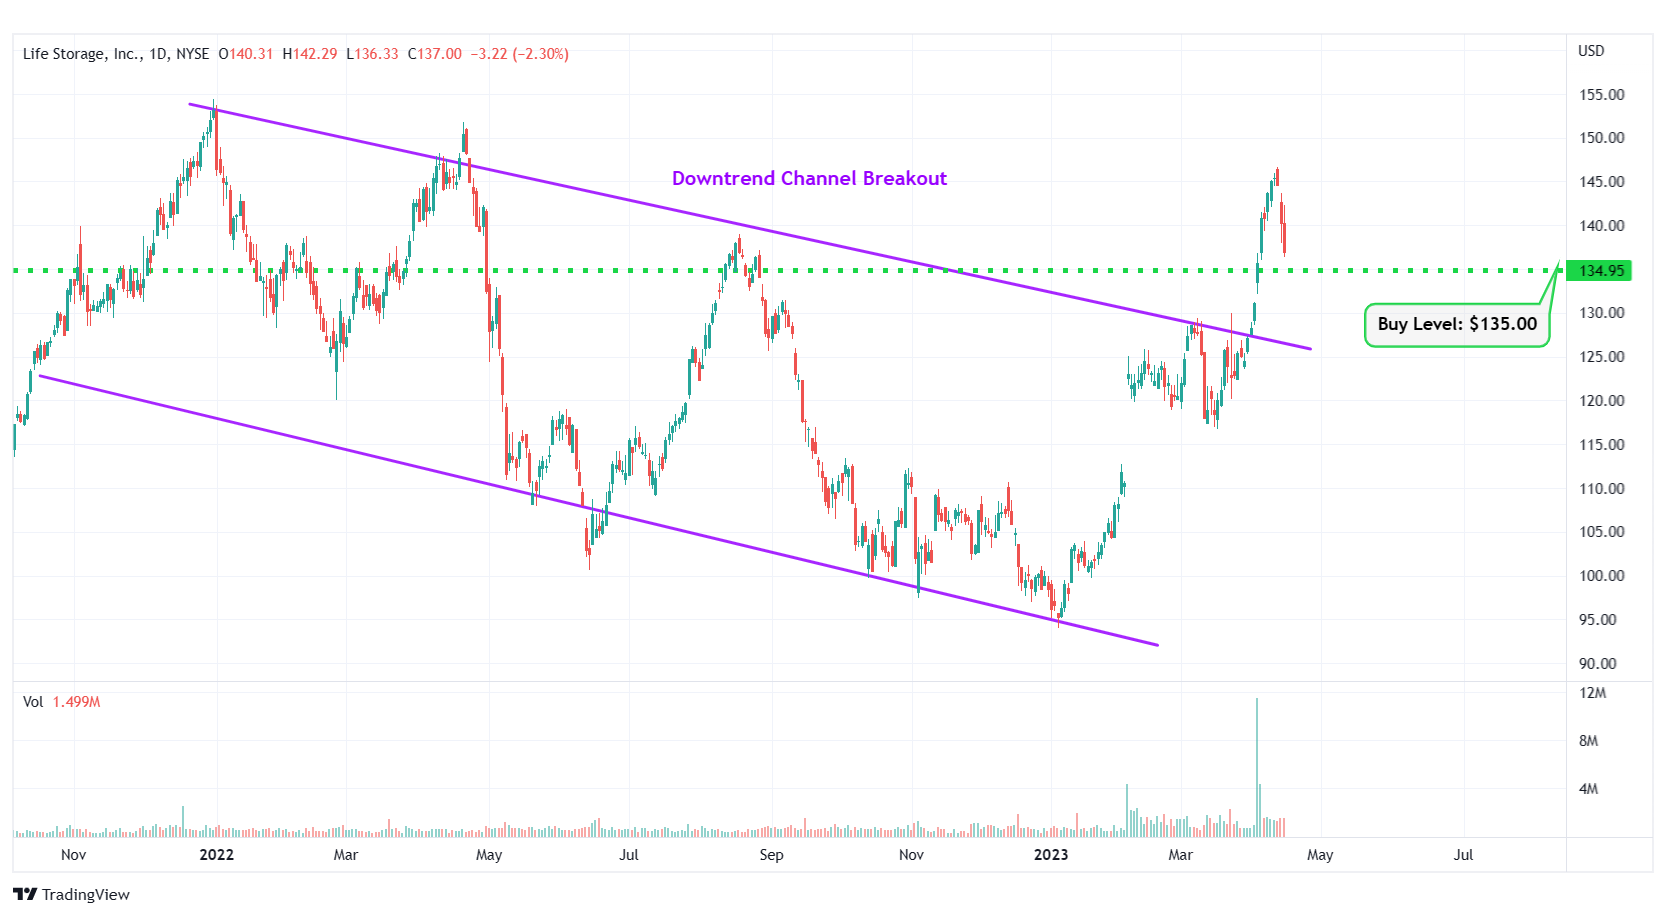
LSI Downtrend Channel Breakout
#7 Merus N.V. (NASDAQ: MRUS)
Sector: Healthcare | Biotechnology
Reason: Symmetrical Triangle Pattern Breakout
A symmetrical triangle is a chart pattern formed by two converging trend lines connecting a series of sequential peaks and troughs. These two lines result in the formation of a triangle that appears to be symmetrical.
A symmetrical triangle pattern is usually formed when there is indecision in the price movements and there is uncertainty among the buyers and sellers. This chart pattern represents a period of consolidation before the price breaks out or breaks down. In case a breakout occurs from the upper trend line, it is a strong bullish indication as it signifies the start of a new bullish trend.
Buy Level(s): The stock has currently broken out of a symmetrical triangle pattern. However, the ideal buy level for MRUS is if the stock closes above the immediate resistance level of $22.30. This is marked in the chart below as a green color dotted line.
Daily chart – MRUS
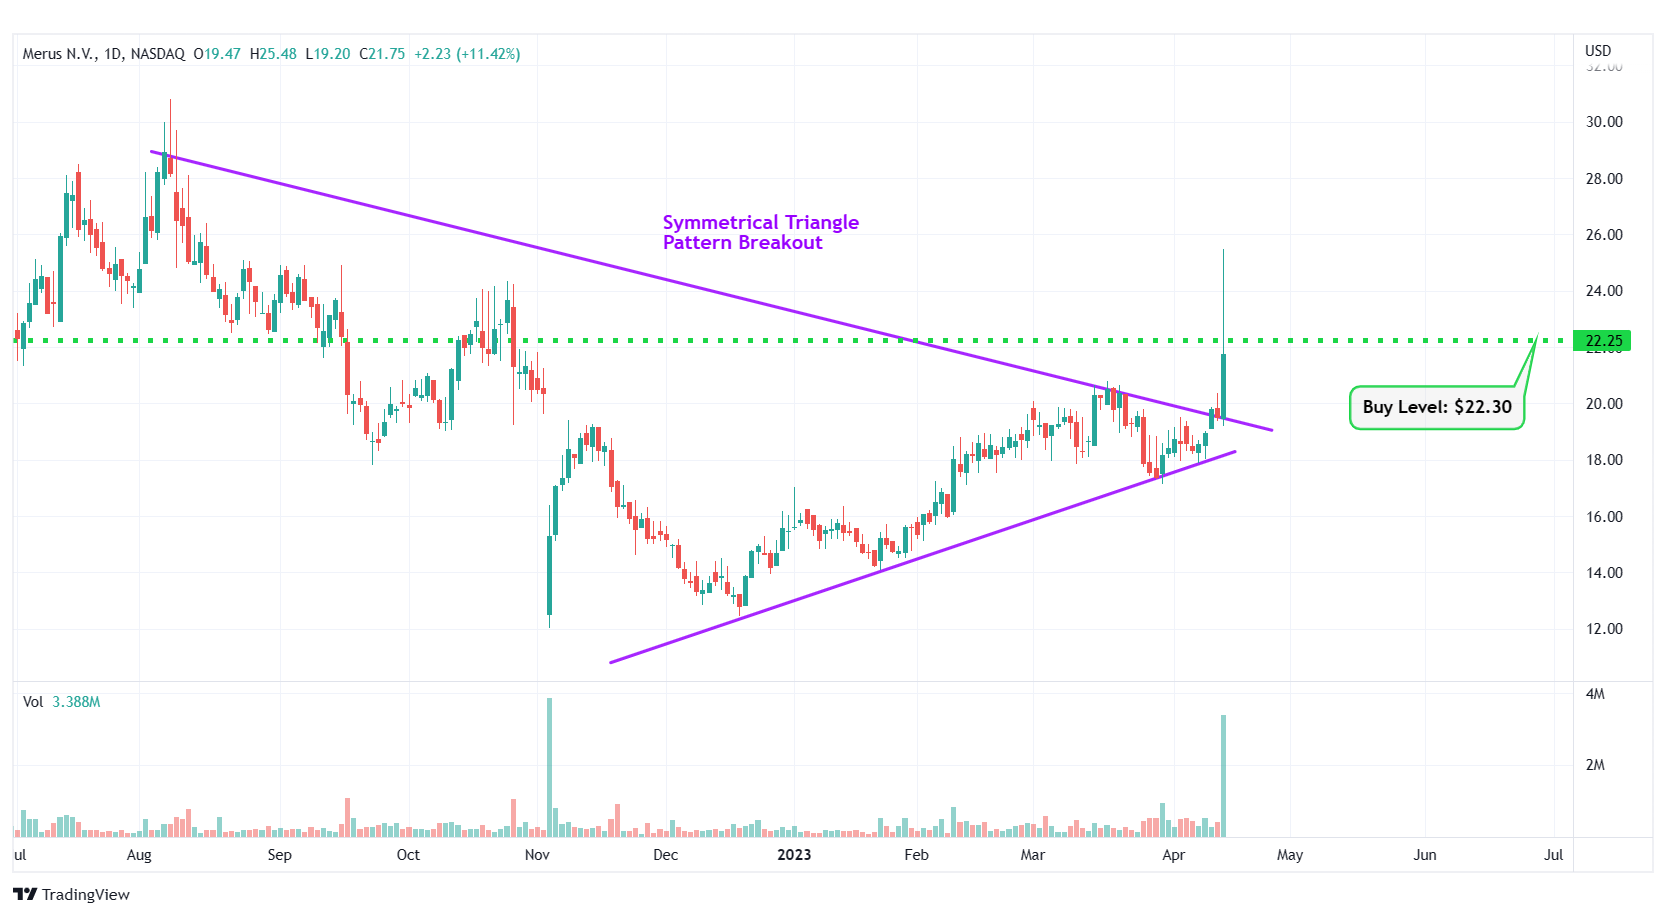
MRUS Symmetrical Triangle Pattern Breakout
#8 WW International, Inc. (NASDAQ: WW)
Sector: Consumer Cyclical | Personal Services
Reason: Symmetrical Triangle Pattern Breakout
A symmetrical triangle is a chart pattern formed by two converging trend lines connecting a series of sequential peaks and troughs. These two lines result in the formation of a triangle that appears to be symmetrical.
A symmetrical triangle pattern is usually formed when there is indecision in the price movements and there is uncertainty among the buyers and sellers. This chart pattern represents a period of consolidation before the price breaks out or breaks down. In case a breakout occurs from the upper trend line, it is a strong bullish indication as it signifies the start of a new bullish trend.
Buy Level(s): The stock has currently broken out of a symmetrical triangle pattern. However, the ideal buy level for WW is if the stock closes above the immediate resistance level of $7.80. This is marked in the chart below as a green color dotted line.
Daily chart – WW
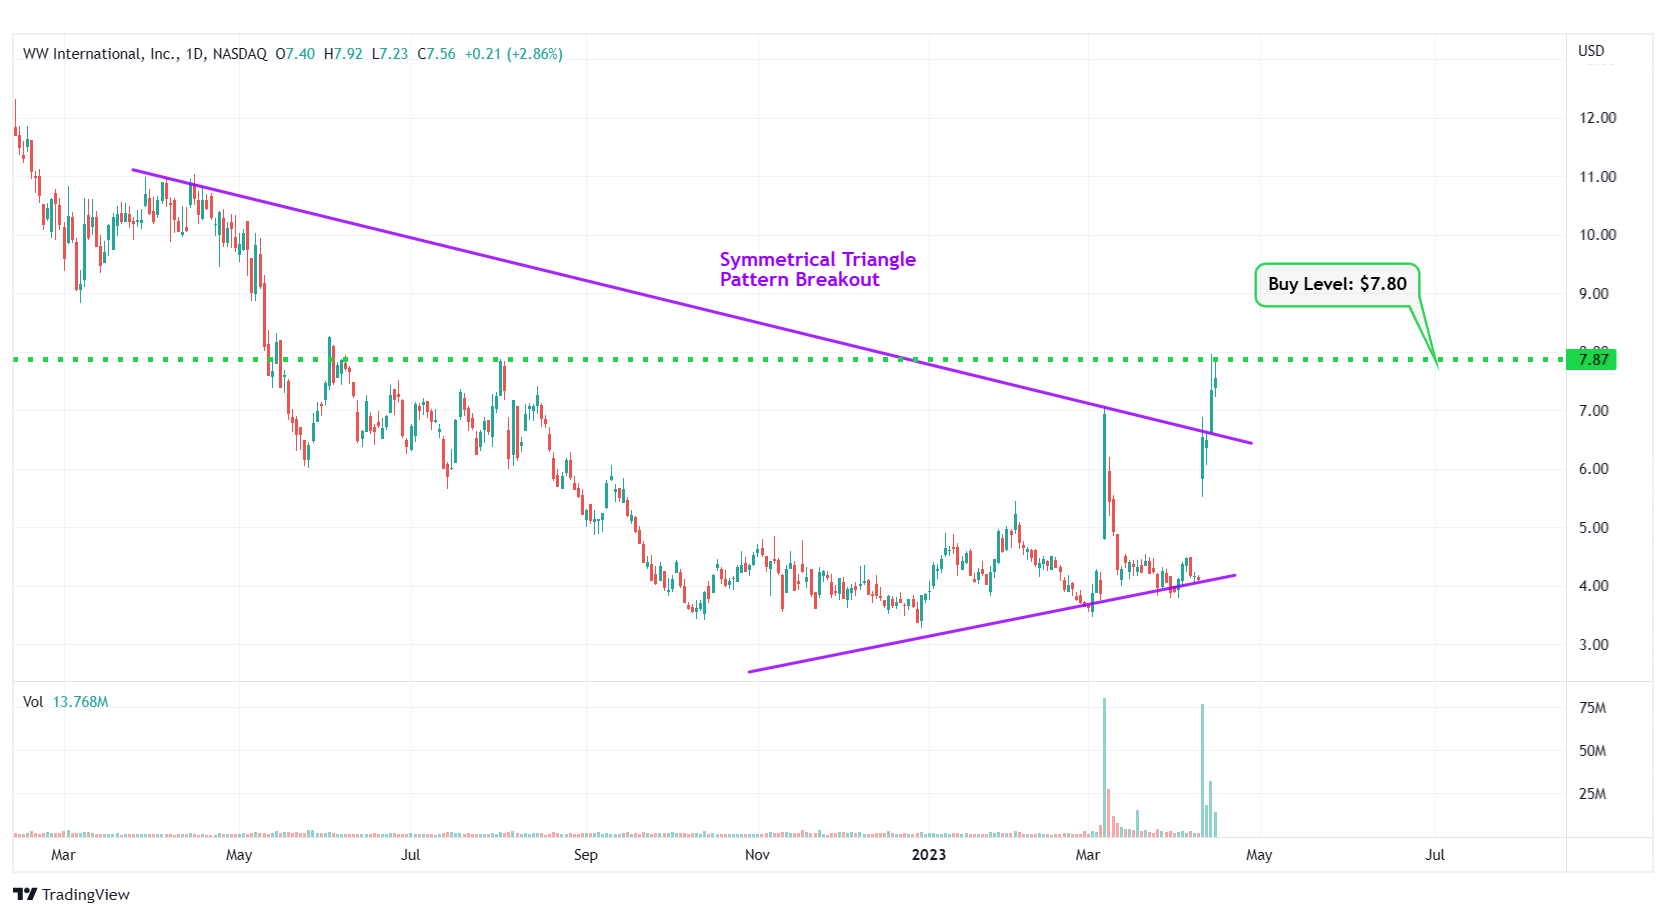
WW Symmetrical Triangle Pattern Breakout
#9 Bio-Techne Corporation (NASDAQ: TECH)
Sector: Healthcare | Biotechnology
Reason: Symmetrical Triangle Pattern Breakout
A symmetrical triangle is a chart pattern formed by two converging trend lines connecting a series of sequential peaks and troughs. These two lines result in the formation of a triangle that appears to be symmetrical.
A symmetrical triangle pattern is usually formed when there is indecision in the price movements and there is uncertainty among the buyers and sellers. This chart pattern represents a period of consolidation before the price breaks out or breaks down. In case a breakout occurs from the upper trend line, it is a strong bullish indication as it signifies the start of a new bullish trend.
Buy Level(s): The stock has currently broken out of a symmetrical triangle pattern. However, the ideal buy level for TECH is if the stock closes above the immediate resistance level of $87.10. This is marked in the chart below as a green color dotted line.
Daily chart – TECH

TECH Symmetrical Triangle Pattern Breakout
#10 Rapid7, Inc. (NASDAQ: RPD)
Sector: Technology | Software – Infrastructure
Reason: Formation of a Symmetrical Triangle Pattern
A symmetrical triangle is a chart pattern formed by two converging trend lines connecting a series of sequential peaks and troughs. These two lines result in the formation of a triangle that appears to be symmetrical.
A symmetrical triangle pattern is usually formed when there is indecision in the price movements and there is uncertainty among the buyers and sellers. This chart pattern represents a period of consolidation before the price breaks out or breaks down. In case a breakout occurs from the upper trend line, it is a strong bullish indication as it signifies the start of a new bullish trend.
Buy Level(s): The ideal buy level for RPD is if the stock has a daily close above the breakout level of the symmetrical triangle pattern, at around $48.30. This is marked in the chart below as a green color dotted line.
Daily chart – RPD
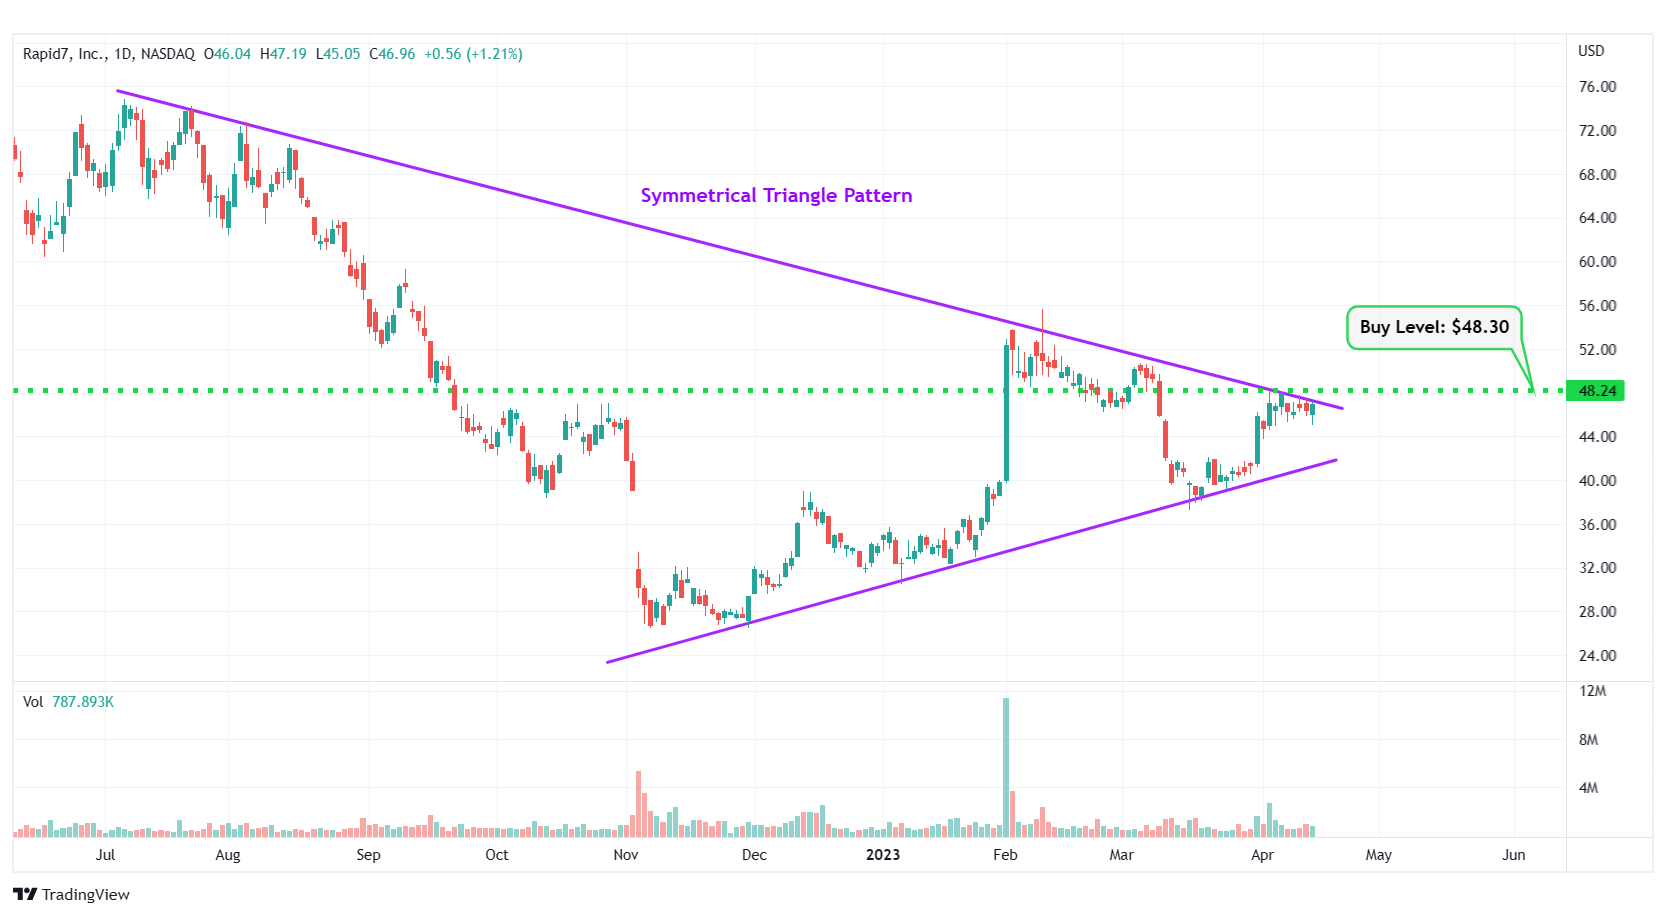
RPD Symmetrical Triangle Pattern
Happy Trading!
Trades of The Day Research Team
The old way of investing in tech giants is over. A NEW strategy unlocks 146X more income on the SAME underlying stocks (like Meta, Apple, and Amazon) -- WITHOUT options trading. Click here to uncover the NEW MAG-7 alternative.
Source: Trades of the Day
