
We recently started a series called “Penny Stock of the Day”. These ideas are geared towards traders with an extremely high risk appetite.
Our Penny Stock of the Day is chosen by screening for stocks under $5 and then applying technical analysis on the shortlisted set of penny stocks showing unusual volume. When making these trades, please make sure to pay vigilant attention to pricing moves and have a strict stop loss in place to avoid significant losses.
Penny Stock of the Day: B2Gold Corp. (NYSE: BTG)
Today’s penny stock pick is the gold producer, B2Gold Corp. (NYSE: BTG).
B2Gold Corp. operates as a gold producer with three operating mines in Mali, the Philippines, and Namibia. It operates the Fekola Mine in Mali, the Masbate Mine in the Philippines, and the Otjikoto Mine in Namibia. The company also has a 25% interest in Calibre Mining Corp.; and approximately 19% interest in BeMetals Corp. In addition, it has a portfolio of other evaluation and exploration assets in Mali, Uzbekistan, and Finland.
Website: https://www.b2gold.com
Latest 10-k report: https://www.sec.gov/ix?doc=/Archives/edgar/data/0001429937/000106299323007087/form40f.htm
Analyst Consensus: As per TipRanks Analytics, based on 5 Wall Street analysts offering 12-month price targets for BTG in the last 3 months, the stock has an average price target of $5.60, which is nearly 44% upside from current levels.
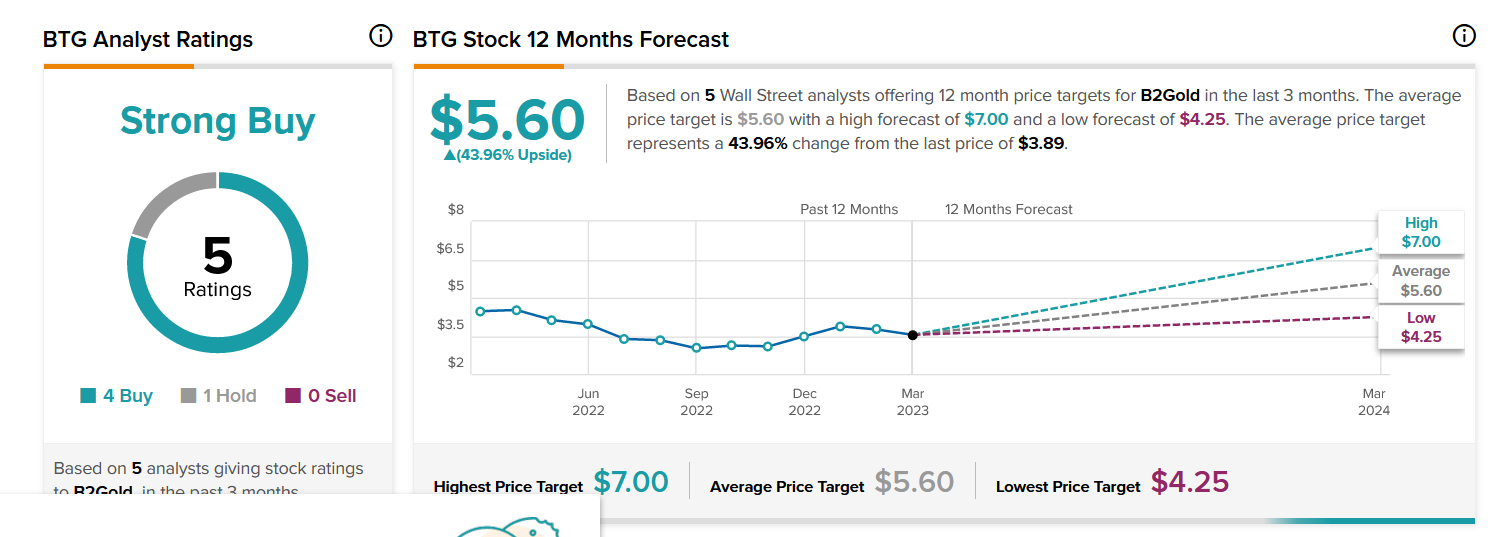
Analysts | Source: TipRanks.com
Potential Catalysts / Reasons for the Hype:
- Expectations of higher gold prices in the near future.
- Rumors of an upcoming buyout.
On analyzing the company’s stock charts, there seem to be multiple bullish indications…
Bullish Indications
#1 Symmetrical Triangle Pattern Breakout: The daily chart shows that the stock has currently broken out a symmetrical triangle pattern, which is marked as purple color lines. A symmetrical triangle pattern represents a period of consolidation before the price breaks out. This is typically formed when there is indecision in the price movements and uncertainty among the buyers and sellers. Once a breakout from the upper trend line occurs, it usually signifies the start of a new bullish trend.
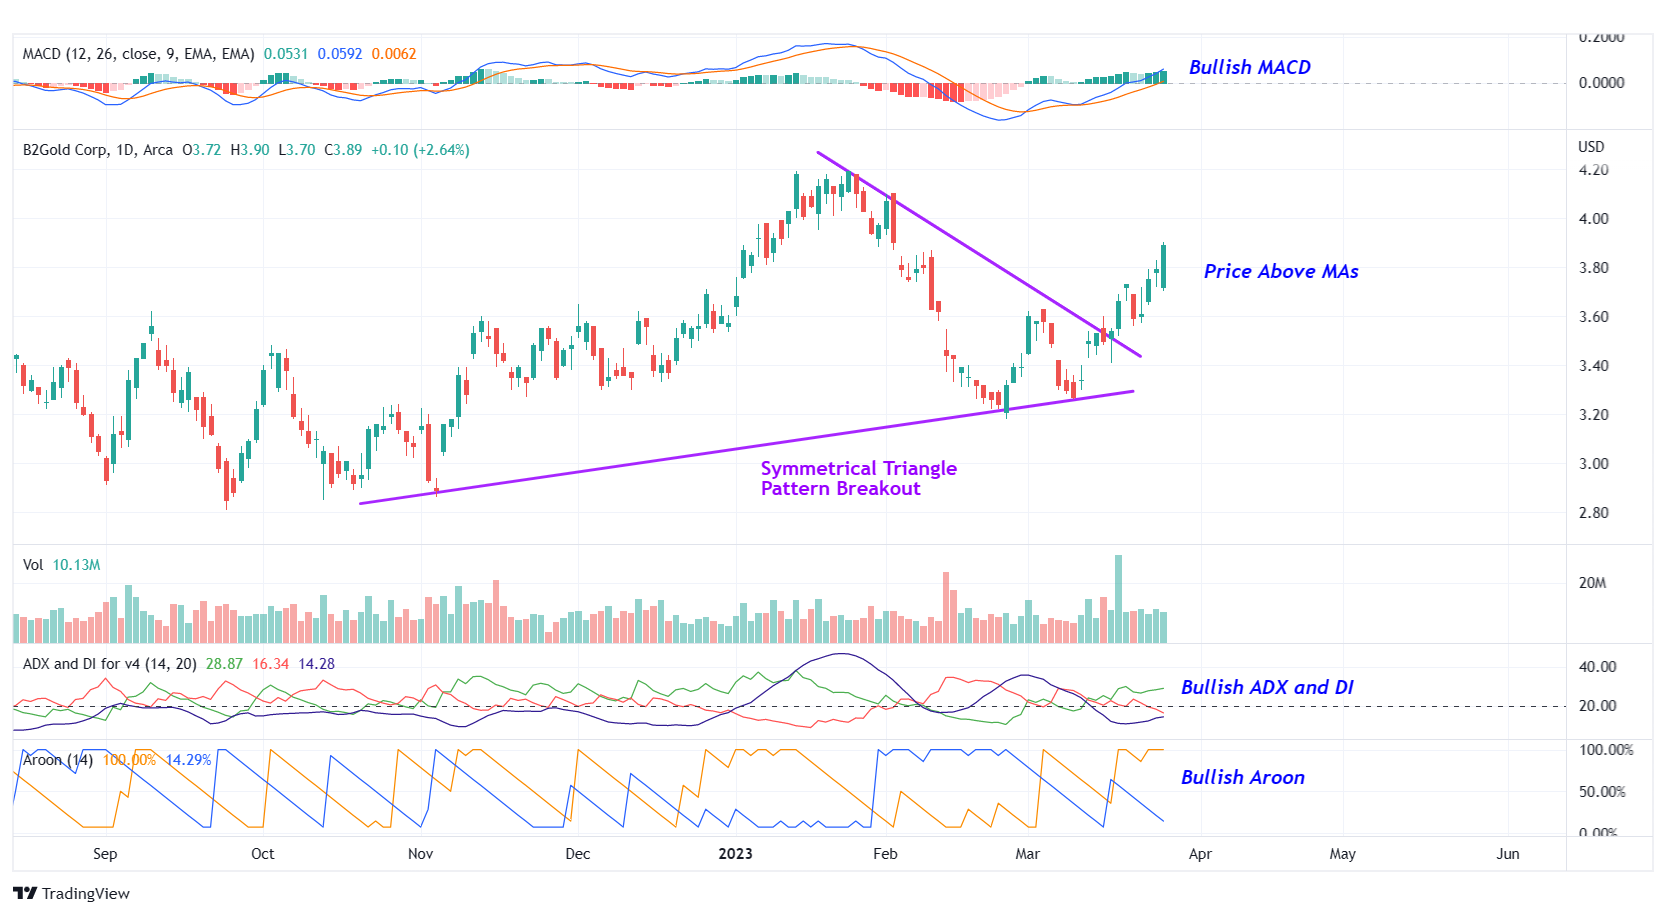
BTG – Daily Chart
#2 Bullish ADX and DI: The ADX indicator shows bullishness as the +DI line is above the -DI line, and the ADX line is currently moving higher from below the +DI and -DI lines.
#3 Price above MAs: The stock is currently above its 50-day as well as 200-day SMA, indicating that the bulls have currently gained control.
#4 MACD above Signal Line: In the daily chart, the MACD (light blue color) is currently above the MACD signal line (orange color). This indicates a possible bullish setup.
#5 Bullish Aroon: The value of Aroon Up (orange line) is above 70 while Aroon Down (blue line) is below 30. This indicates bullishness.
#6 Above Support Area: The weekly chart shows that the stock is currently trading above a support area, which is marked as a pink color dotted line. This looks like a good area for the stock to move higher. The stock is also trading above its 50-week SMA, indicating that the bulls are gaining control.
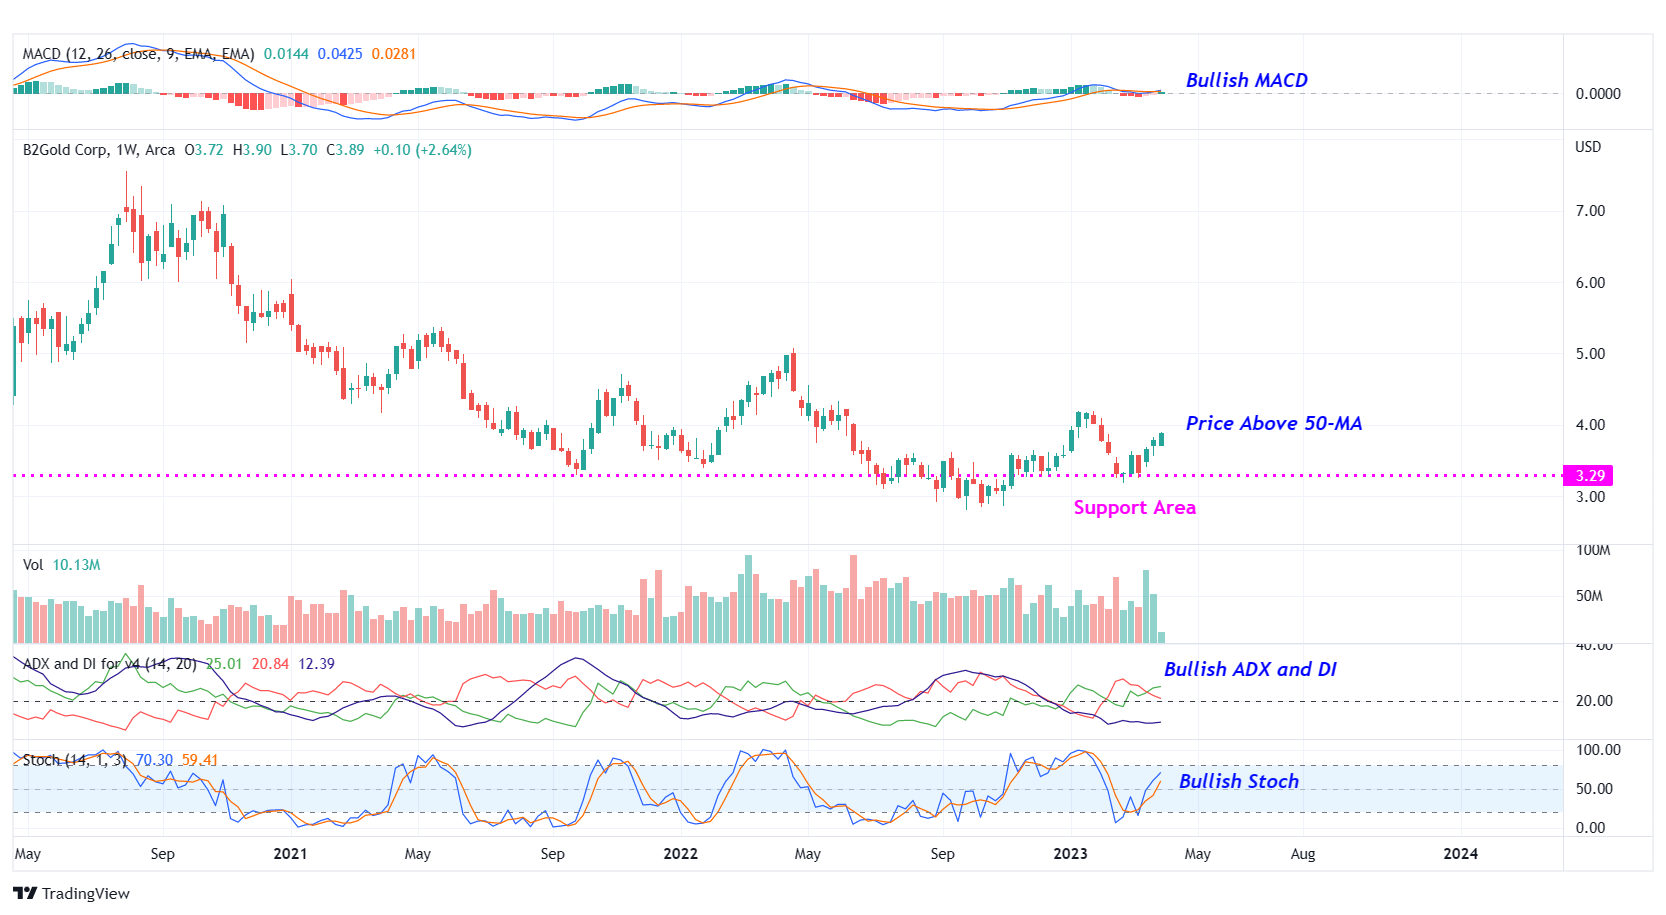
BTG – Weekly Chart
#7 Bullish Stoch: The %K line is above the %D line of the stochastic in the weekly chart, indicating possible bullishness.
#8 MACD above Signal Line: In the weekly chart, the MACD (light blue color) is currently above the MACD signal line (orange color). This indicates a possible bullish setup.
Recommended Trade (based on the charts)
Buy Levels: If you want to get in on this trade, the ideal buy level for BTG is above the price of $3.95.
Target Prices: Our first target is $5.00. If it closes above that level, the second target price is $6.00.
Stop Loss: To limit risk, place a stop loss at $3.30. Note that the stop loss is on a closing basis.
Our target potential upside is 27% to 62%.
For a risk of $0.65, our first target reward is $1.05, and the second target reward is $2.05. This is a nearly 1:2 and 1:3 risk-reward trade.
In other words, this trade offers 2x to 3x more potential upside than downside.
Potential Risks / Red Flags:
- In 2022, the company’s net income declined to nearly half of the previous year.
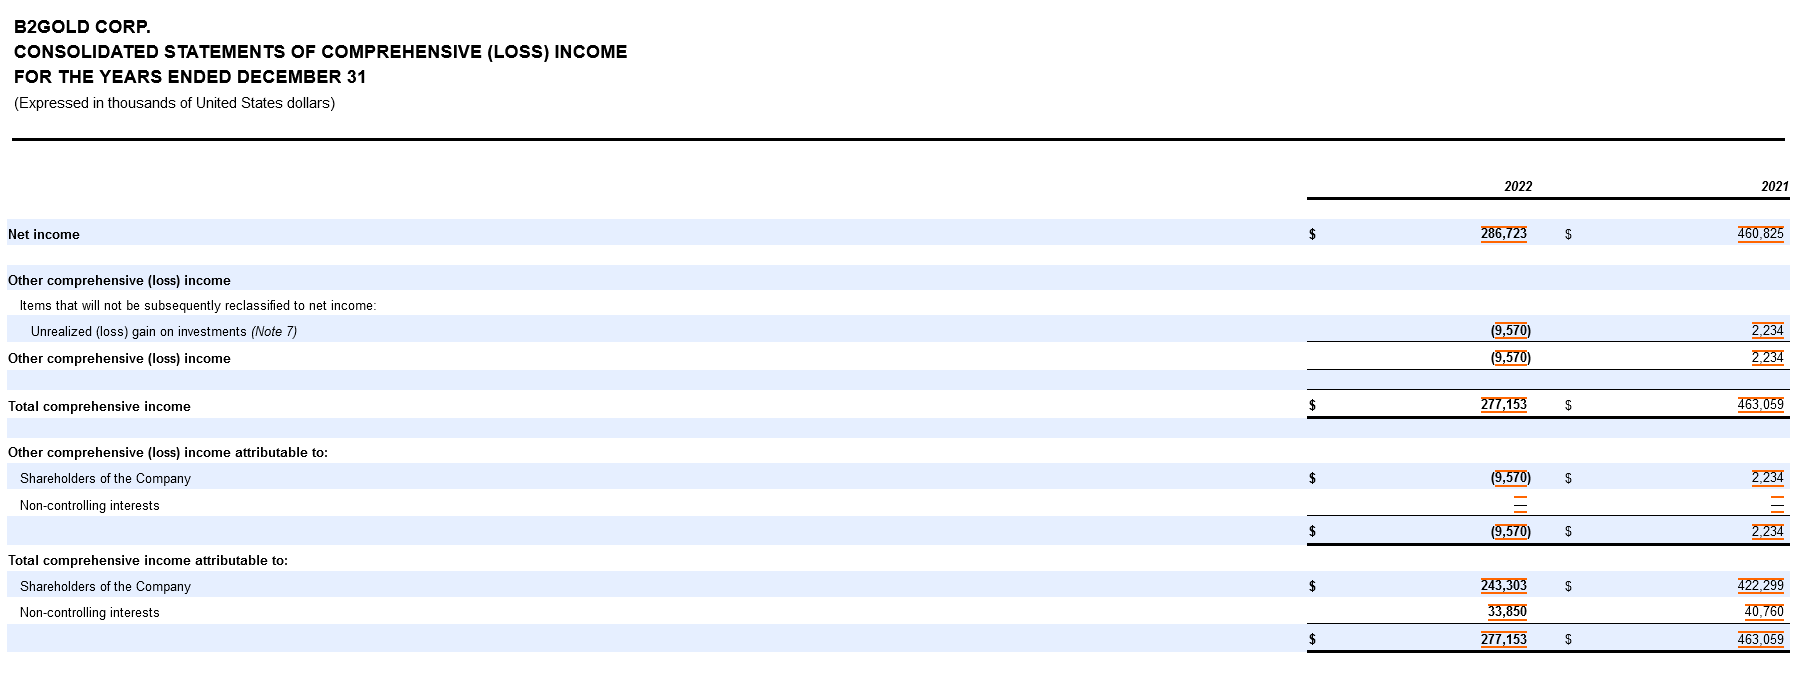
BTG – Consolidated Statements of Income
- Corporate Insiders Sold Shares Worth $9.9K in the Last 3 Months.
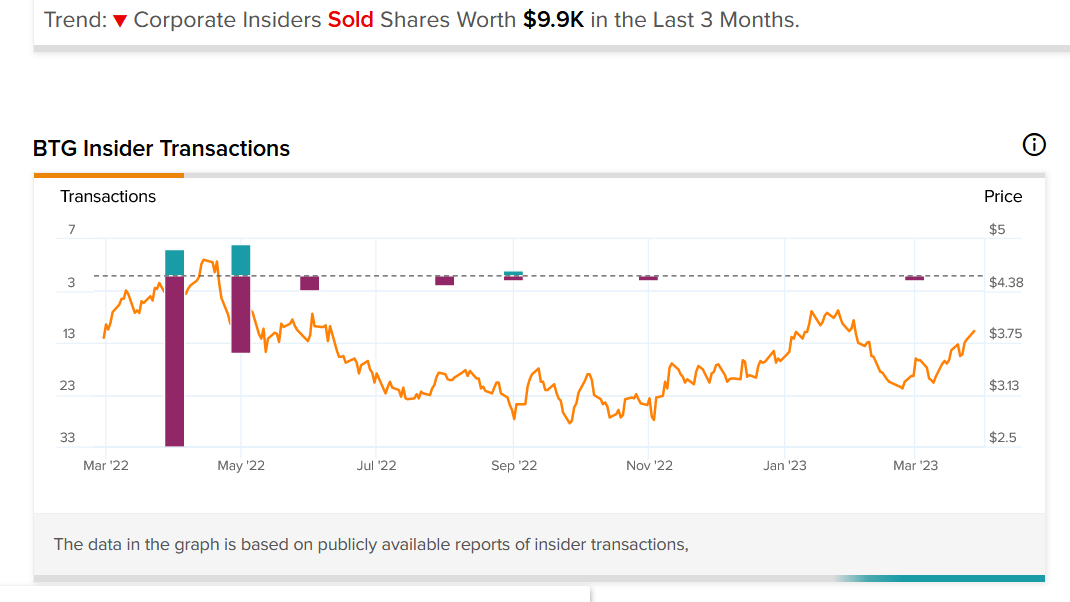
Insiders | Source: TipRanks.com
- Any significant change in the price of gold and other metals in the world markets could significantly affect the profitability of the company’s operations, financial condition, and ability to develop new mines.
- Hedge Funds Decreased Holdings by 2.4M Shares Last Quarter.
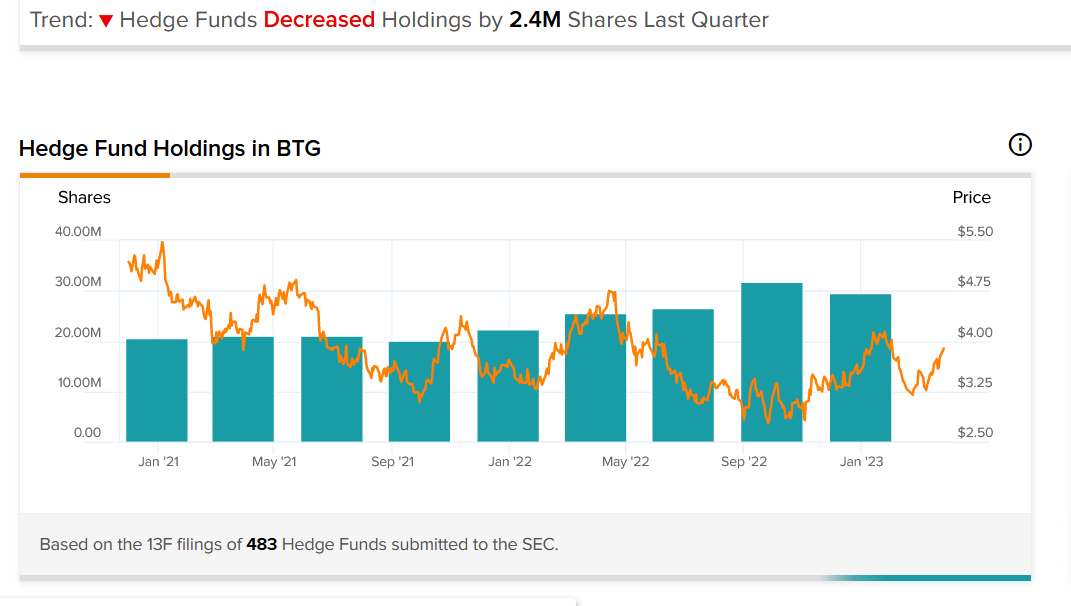
Hedge Funds | Source: TipRanks.com
As you can see, today’s featured penny stock offers big upside potential… but it also comes with a number of risks and red flags. As always, when dealing with penny stocks, we advise caution before entering into such high-risk ventures. Remember to think before you trade… understand the risks… and if you decide to trade, stick to your stop-losses!
Happy Trading!
Trades of the Day Research Team
READ BEFORE TRADING PENNY STOCKS: The allure of penny stocks lies in their potential to deliver massive gains in a short period of time. However, in exchange for that opportunity, most penny stocks carry tremendous risk. They can be extremely volatile and are susceptible to “pump and dump” schemes and fraud.
Unlike regular stocks, the financial condition of most penny stock companies can be extremely difficult to analyze, as the majority of such stocks are traded on over-the-counter (OTC) exchanges, which are typically less transparent and less regulated than the major exchanges. In fact, in the penny stock space, it’s often easier to spot warning signs and red flags than it is to identify a sound investment. Nevertheless, we do our best to identify short-term trade opportunities in this exciting space because we know some of our readers are looking for high-risk, high-reward ideas. We just urge you to make sure you fully understand the risks before making any of these trades.
Top Stock Expert Who Called Nvidia at Less Than a Dollar Says... "$1,000 in Each of These Stocks Could Make You a Millionaire" By 2030.
Source: Trades of the Day
