
Picking a winning trade on a consistent basis is not simply a stroke of luck. It’s the result of calculated screening, planning, and deliberation.
With this in mind, we have started a new weekly series on our top 10 stocks to watch this week — stocks that look poised for a possible breakout in the coming days. Traders should add these stocks to their watchlist now.
The Top 10 Stocks to Watch This Week for Possible Breakouts
| Sl # | Name of the Stock | Stock Ticker | Last Close | Buy Level(s) | Reason |
| 1 | United States Steel Corporation | NYSE: X | $21.65 | $22.20 | Symmetrical Triangle Pattern |
| 2 | AT&T Inc. | NYSE: T | $17.10 | $17.40 | Downtrend Channel Breakout |
| 3 | Alcoa Corporation | NYSE: AA | $41.06 | $41.40 | Falling Wedge Pattern |
| 4 | Hawaiian Holdings, Inc. | NASDAQ: HA | $15.33 | $16.00 | Symmetrical Triangle Pattern |
| 5 | KeyCorp | NYSE: KEY | $16.90 | $17.20 | Falling Wedge Pattern |
| 6 | Lam Research Corporation | NASDAQ: LRCX | $369.29 | $377.70 | Downtrend Channel Breakout |
| 7 | The Goldman Sachs Group, Inc. | NYSE: GS | $325.10 | $329.60 | Symmetrical Triangle Pattern Breakout |
| 8 | NVIDIA Corporation | NASDAQ: NVDA | $124.66 | $134.00 | Falling Wedge Pattern |
| 9 | Pfizer Inc. | NYSE: PFE | $44.95 | $45.30 | Downtrend Channel Breakout |
| 10 | Shopify Inc. | NYSE: SHOP | $29.75 | $32.50 | Falling Wedge Pattern Breakout |
Important: Typically, these trades offer a risk: reward ratio of 1:2 or 1:3 in the next 6 months, which implies 2x to 3x rewards when compared to risks. So, be sure to set your stop-loss levels and target prices accordingly to manage your risk. In addition, these trade ideas are triggered using daily closing prices, not intra-day pricing. So, if you participate in these trades, make sure that you only buy the stock once its daily close is above the recommended price level.
That said, here are the top 10 stocks to watch for a breakout, in no particular order.
#1 United States Steel Corporation (NYSE: X)
Sector: Basic Materials | Steel
Reason: Formation of a Symmetrical Triangle Pattern
A symmetrical triangle is a chart pattern formed by two converging trend lines connecting a series of sequential peaks and troughs. These two lines result in the formation of a triangle that appears to be symmetrical.
A symmetrical triangle pattern is usually formed when there is indecision in the price movements and there is uncertainty among the buyers and sellers. This chart pattern represents a period of consolidation before the price breaks out or breaks down. In case a breakout occurs from the upper trend line, it is a strong bullish indication as it signifies the start of a new bullish trend.
Buy Level(s): The ideal buy level for X is if the stock has a daily close above the breakout level of the symmetrical triangle pattern, at around $22.20. This is marked in the chart below as a green color dotted line.
Daily chart – X
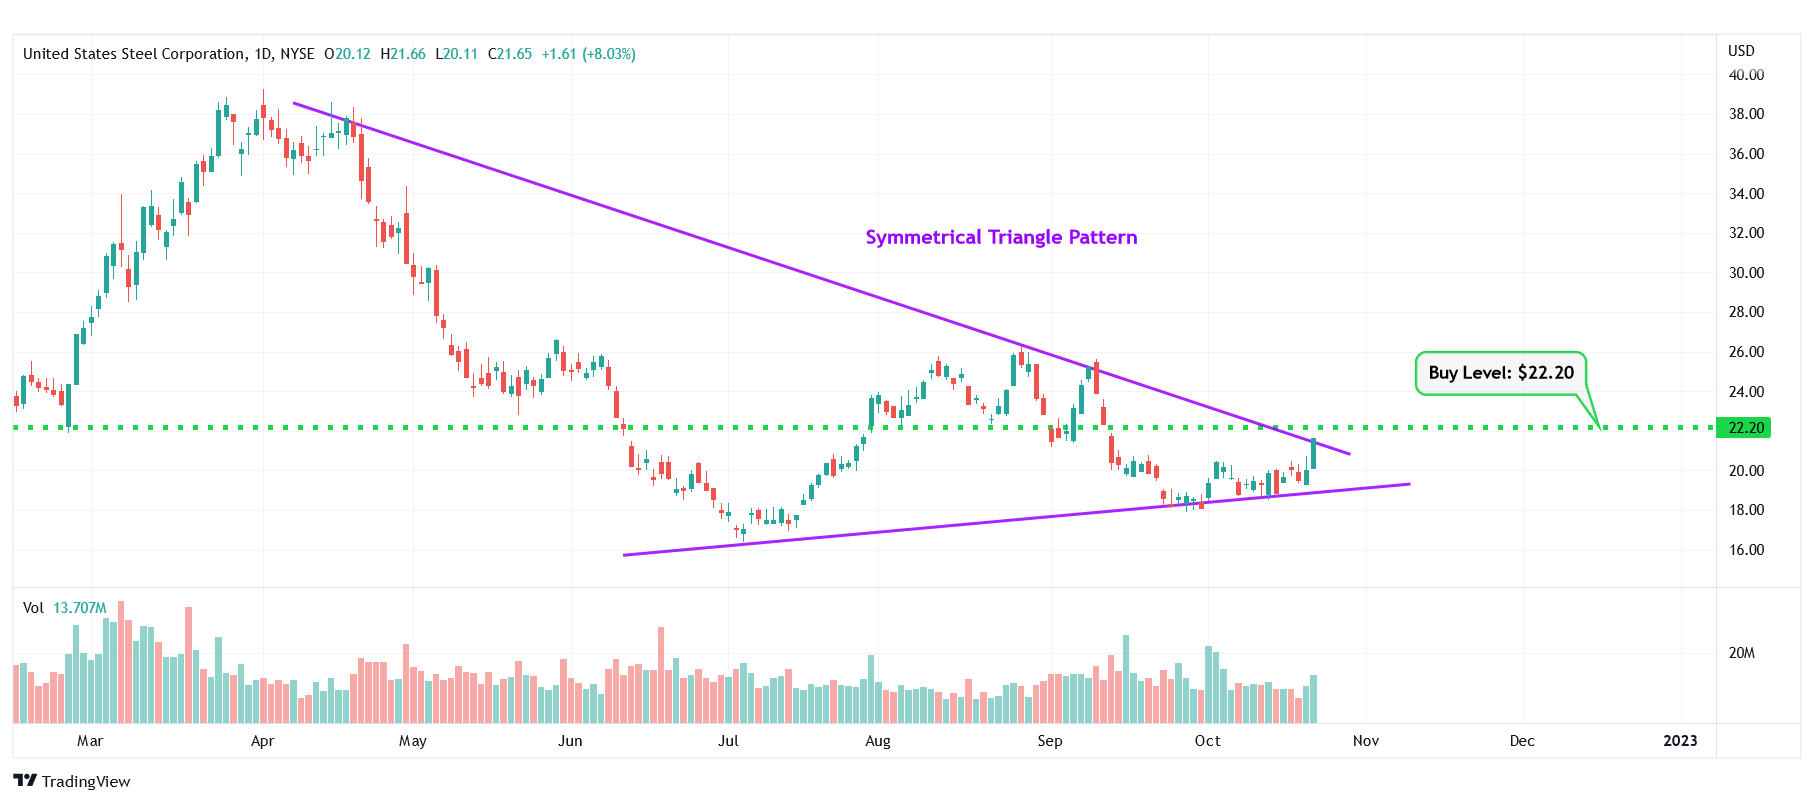
X – Symmetrical Triangle Pattern
#2 AT&T Inc. (NYSE: T)
Sector: Communication Services | Telecom Services
Reason: Downtrend Channel Breakout
A downtrend or descending channel is the price action contained between downward sloping parallel lines. It is formed by two lines that are drawn by connecting the lower highs and lower lows of a stock’s price. Even though this is typically a bearish pattern, a breakout from the upper rail of this pattern is considered a good bullish indication.
Buy Level(s): The daily chart shows that the stock has currently broken out of a downtrend channel. However, there is a near-term resistance level for the stock. Hence, the ideal buy level for T is if the stock has a daily close above $17.40. This is marked in the chart below as a green color dotted line.
Daily chart – T
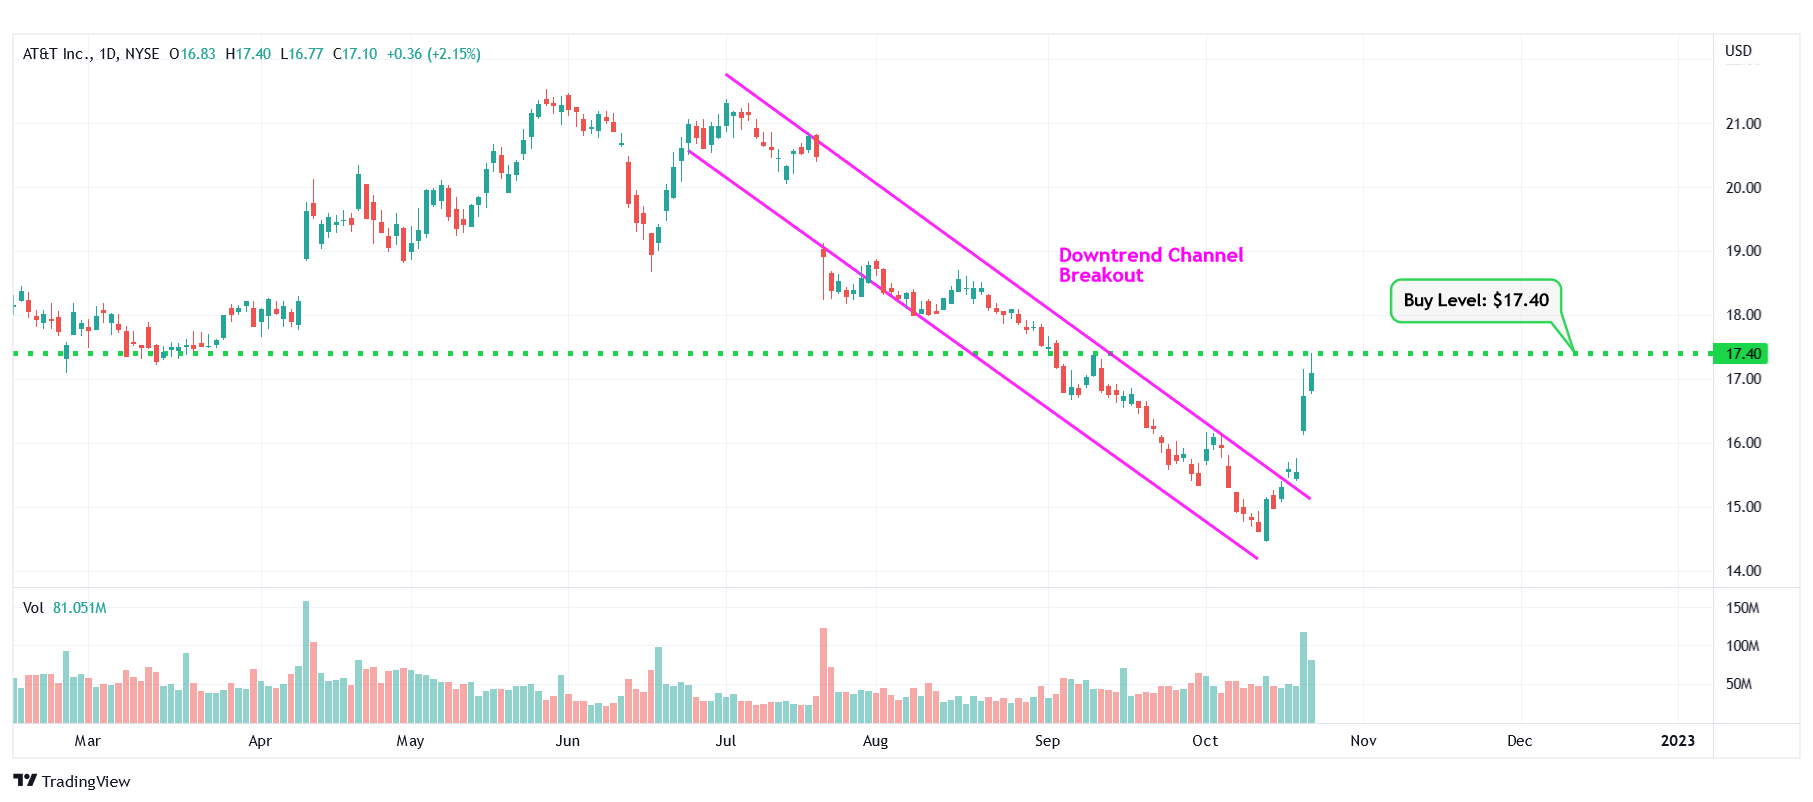
T – Downtrend Channel Breakout
#3 Alcoa Corporation (NYSE: AA)
Sector: Basic Materials | Aluminum
Reason: Formation of a Falling Wedge Pattern
A falling wedge pattern is formed by joining two downward-sloping, converging trendlines having a contracting range. The pattern appears to be wide at the top and continues to contract as prices fall. A breakout from a falling wedge pattern can indicate either reversal or continuation depending on where the pattern appeared in the trend.
A stock that has broken out of a falling wedge pattern would have gained momentum and would have the potential to move higher.
Buy Level(s): The ideal buy level for AA is if the stock breaks out of the falling wedge pattern, at a price of around $41.40. This is marked in the chart below as a green color dotted line.
Daily chart – AA
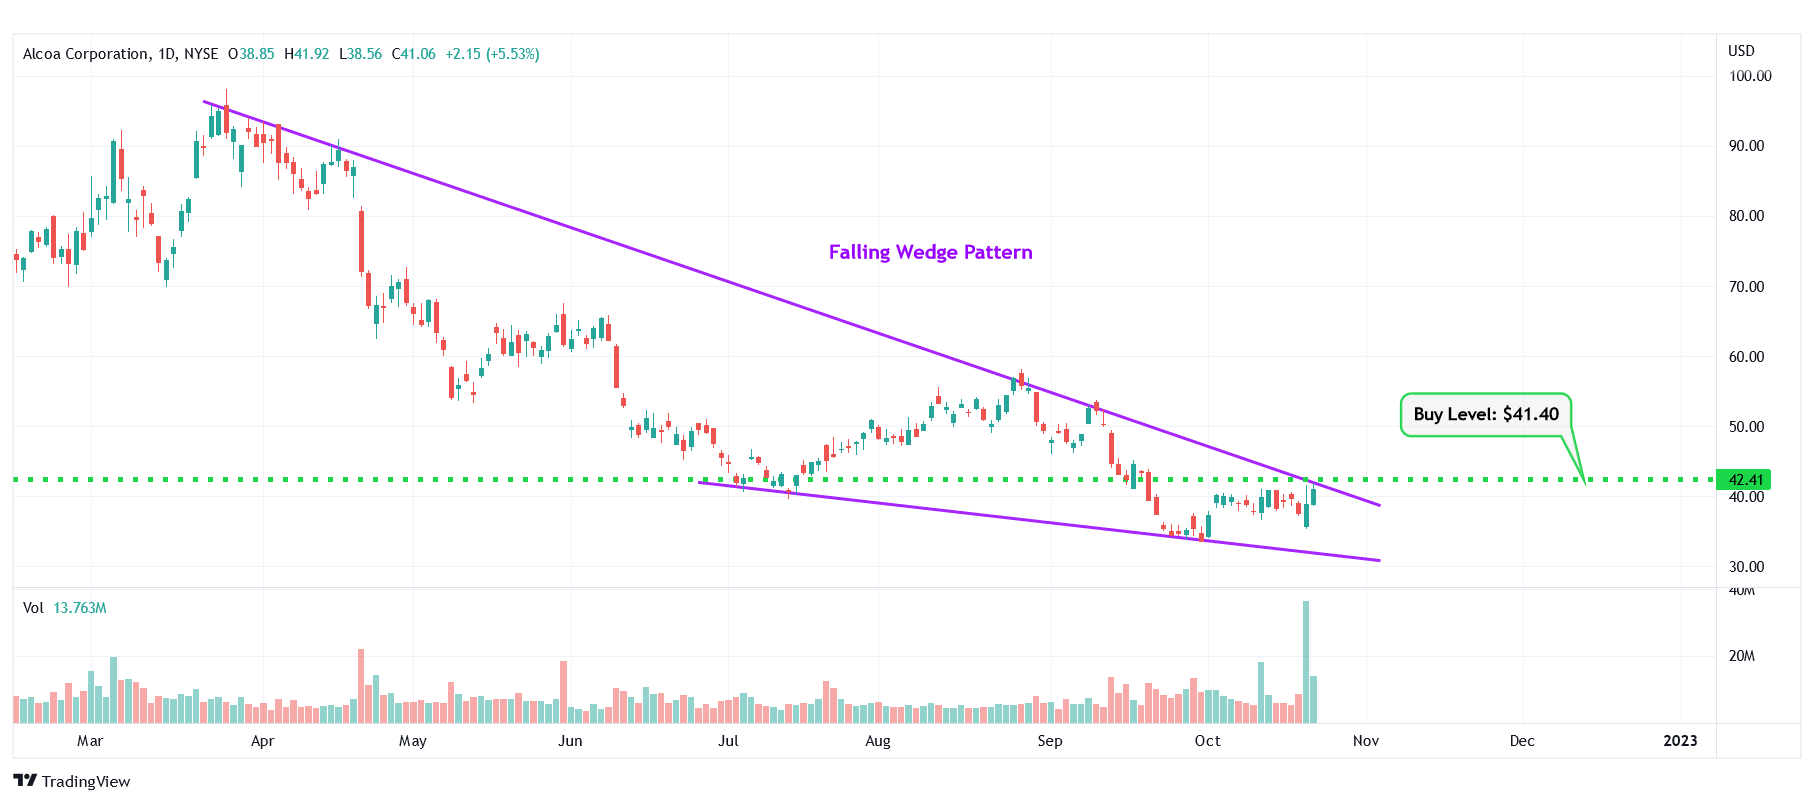
AA – Falling Wedge Pattern
#4 Hawaiian Holdings, Inc. (NASDAQ: HA)
Sector: Industrials | Airlines
Reason: Formation of a Symmetrical Triangle Pattern
A symmetrical triangle is a chart pattern formed by two converging trend lines connecting a series of sequential peaks and troughs. These two lines result in the formation of a triangle that appears to be symmetrical.
A symmetrical triangle pattern is usually formed when there is indecision in the price movements and there is uncertainty among the buyers and sellers. This chart pattern represents a period of consolidation before the price breaks out or breaks down. In case a breakout occurs from the upper trend line, it is a strong bullish indication as it signifies the start of a new bullish trend.
Buy Level(s): The ideal buy level for HA is if the stock has a daily close above the breakout level of the symmetrical triangle pattern, at around $16.00. This is marked in the chart below as a green color dotted line.
Daily chart – HA
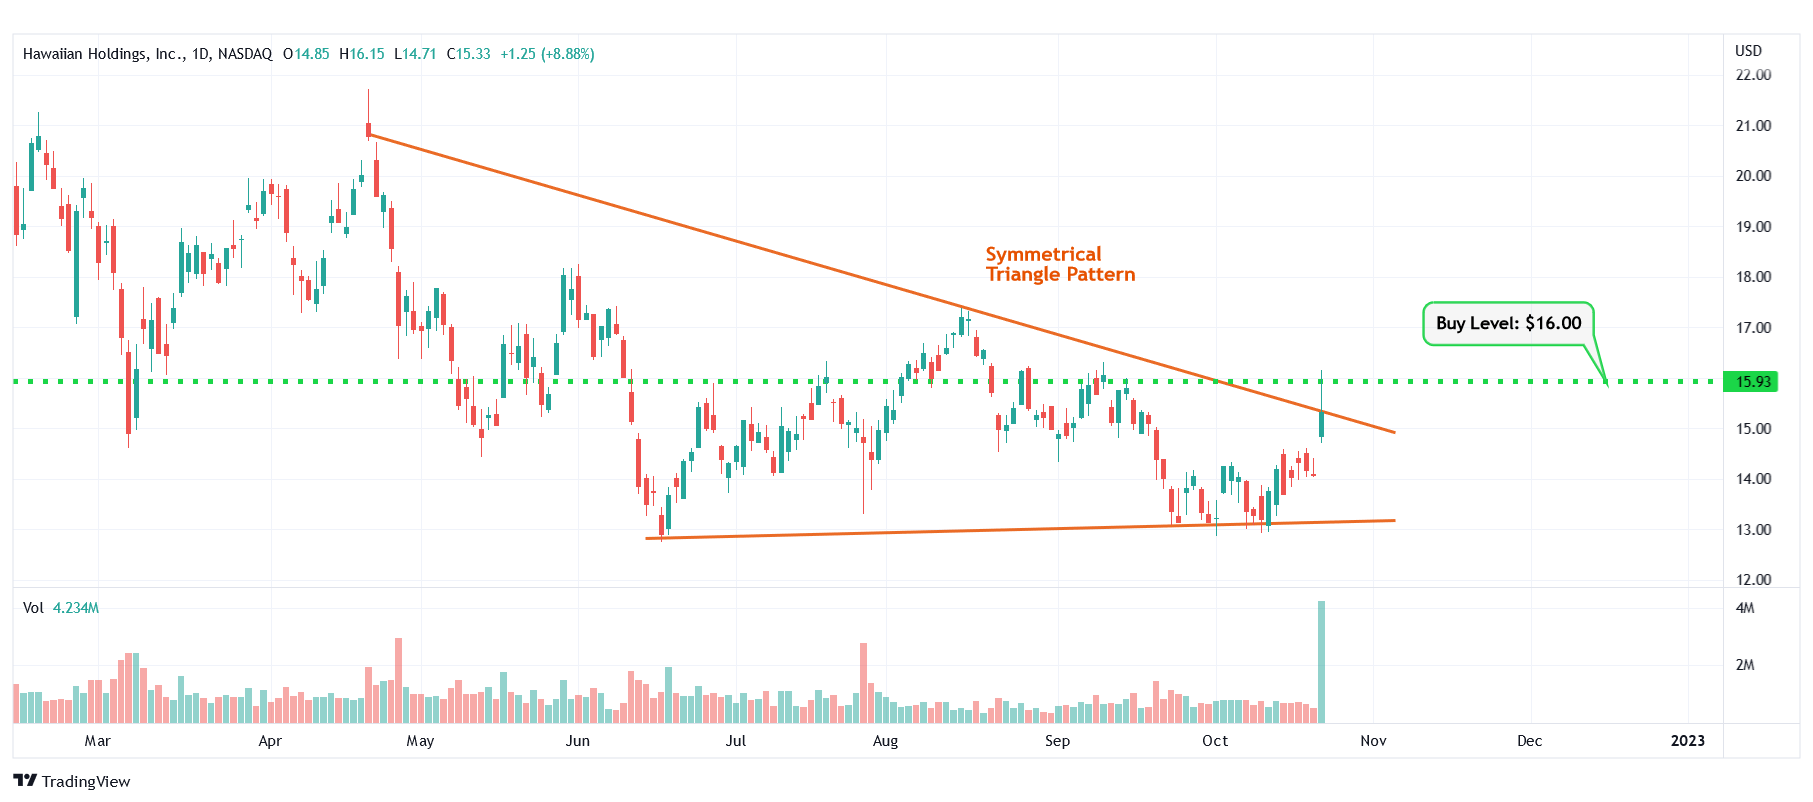
HA – Symmetrical Triangle Pattern
#5 KeyCorp (NYSE: KEY)
Sector: Financial | Banks – Regional
Reason: Formation of a Falling Wedge Pattern
A falling wedge pattern is formed by joining two downward-sloping, converging trendlines having a contracting range. The pattern appears to be wide at the top and continues to contract as prices fall. A breakout from a falling wedge pattern can indicate either reversal or continuation depending on where the pattern appeared in the trend.
A stock that has broken out of a falling wedge pattern would have gained momentum and would have the potential to move higher.
Buy Level(s): The ideal buy level for KEY is if the stock breaks out of the falling wedge pattern, at a price of around $17.20. This is marked in the chart below as a green color dotted line.
Daily chart – KEY
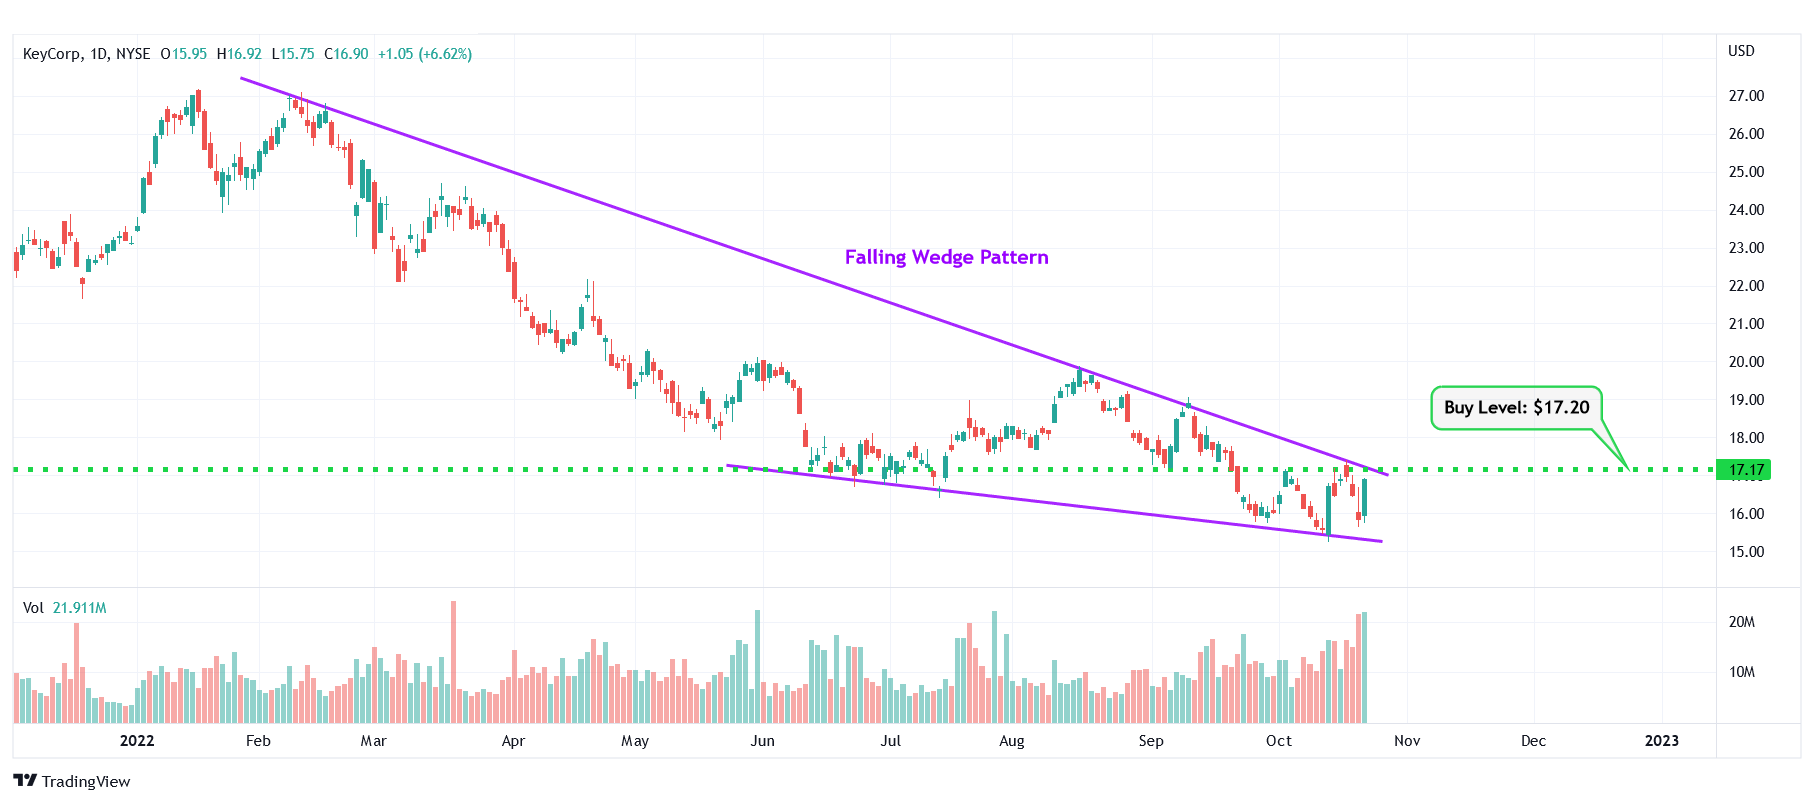
KEY – Falling Wedge Pattern
#6 Lam Research Corporation (NASDAQ: LRCX)
Sector: Technology | Semiconductor Equipment & Materials
Reason: Downtrend Channel Breakout
A downtrend or descending channel is the price action contained between downward sloping parallel lines. It is formed by two lines that are drawn by connecting the lower highs and lower lows of a stock’s price. Even though this is typically a bearish pattern, a breakout from the upper rail of this pattern is considered a good bullish indication.
Buy Level(s): The daily chart shows that the stock has currently broken out of a downtrend channel. However, there is a near-term resistance level for the stock. Hence, the ideal buy level for LRCX is if the stock has a daily close above $377.70. This is marked in the chart below as a green color dotted line.
Daily chart – LRCX
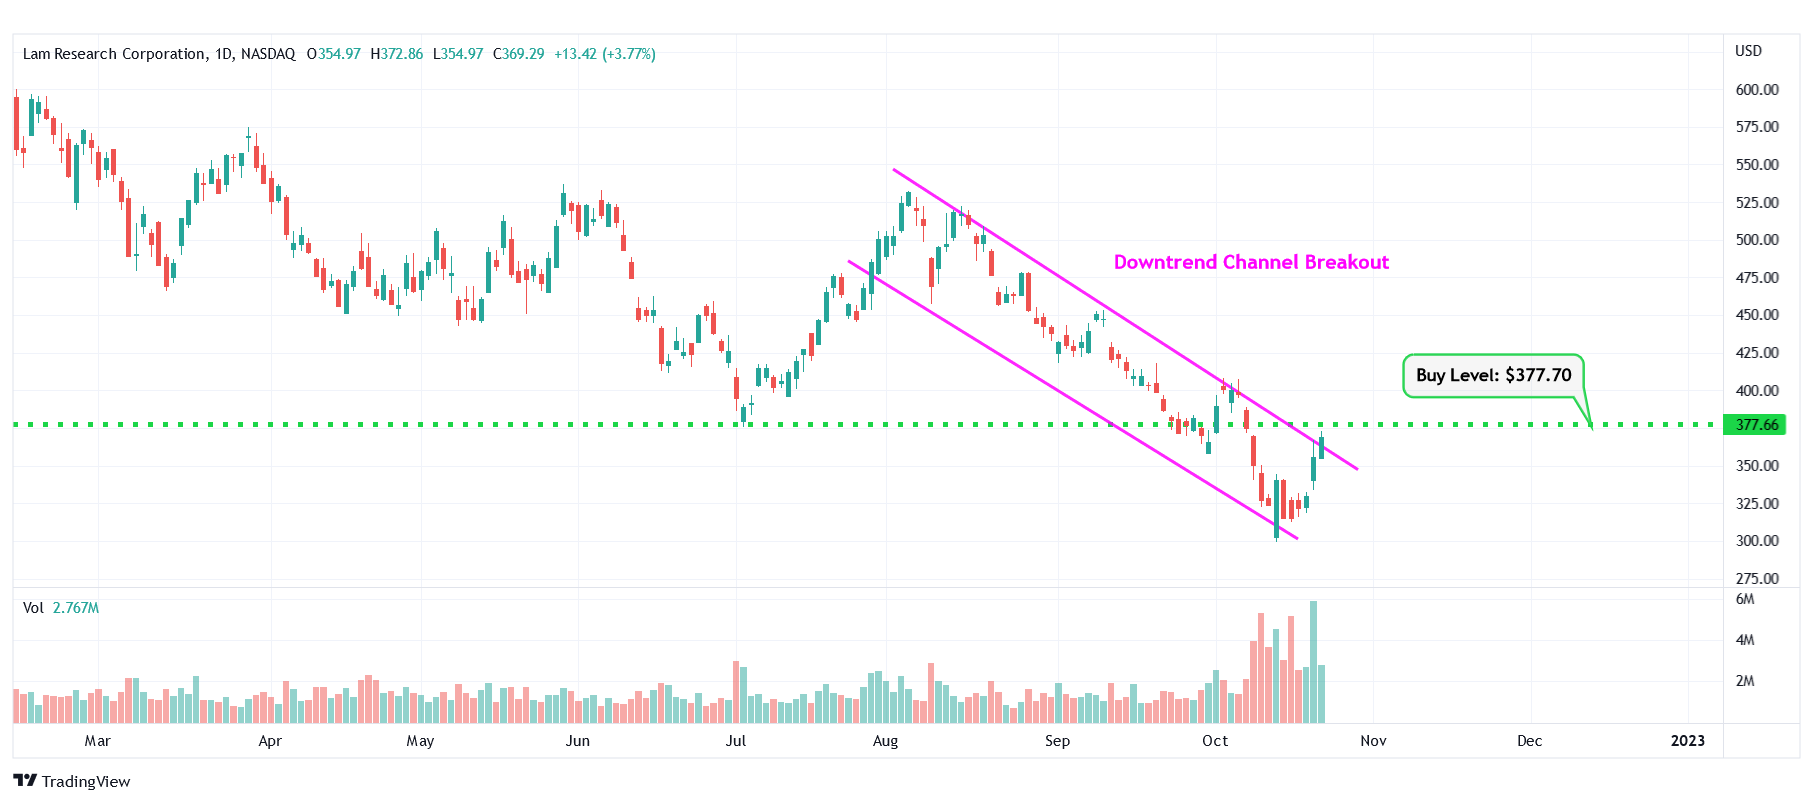
LRCX – Downtrend Channel Breakout
#7 The Goldman Sachs Group, Inc. (NYSE: GS)
Sector: Financial | Capital Markets
Reason: Symmetrical Triangle Pattern Breakout
A symmetrical triangle is a chart pattern formed by two converging trend lines connecting a series of sequential peaks and troughs. These two lines result in the formation of a triangle that appears to be symmetrical.
A symmetrical triangle pattern is usually formed when there is indecision in the price movements and there is uncertainty among the buyers and sellers. This chart pattern represents a period of consolidation before the price breaks out or breaks down. In case a breakout occurs from the upper trend line, it is a strong bullish indication as it signifies the start of a new bullish trend.
Buy Level(s): The stock has currently broken out of a symmetrical triangle pattern. However, the ideal buy level for GS is if the stock closes above the immediate resistance level of $329.60. This is marked in the chart below as a green color dotted line.
Daily chart – GS
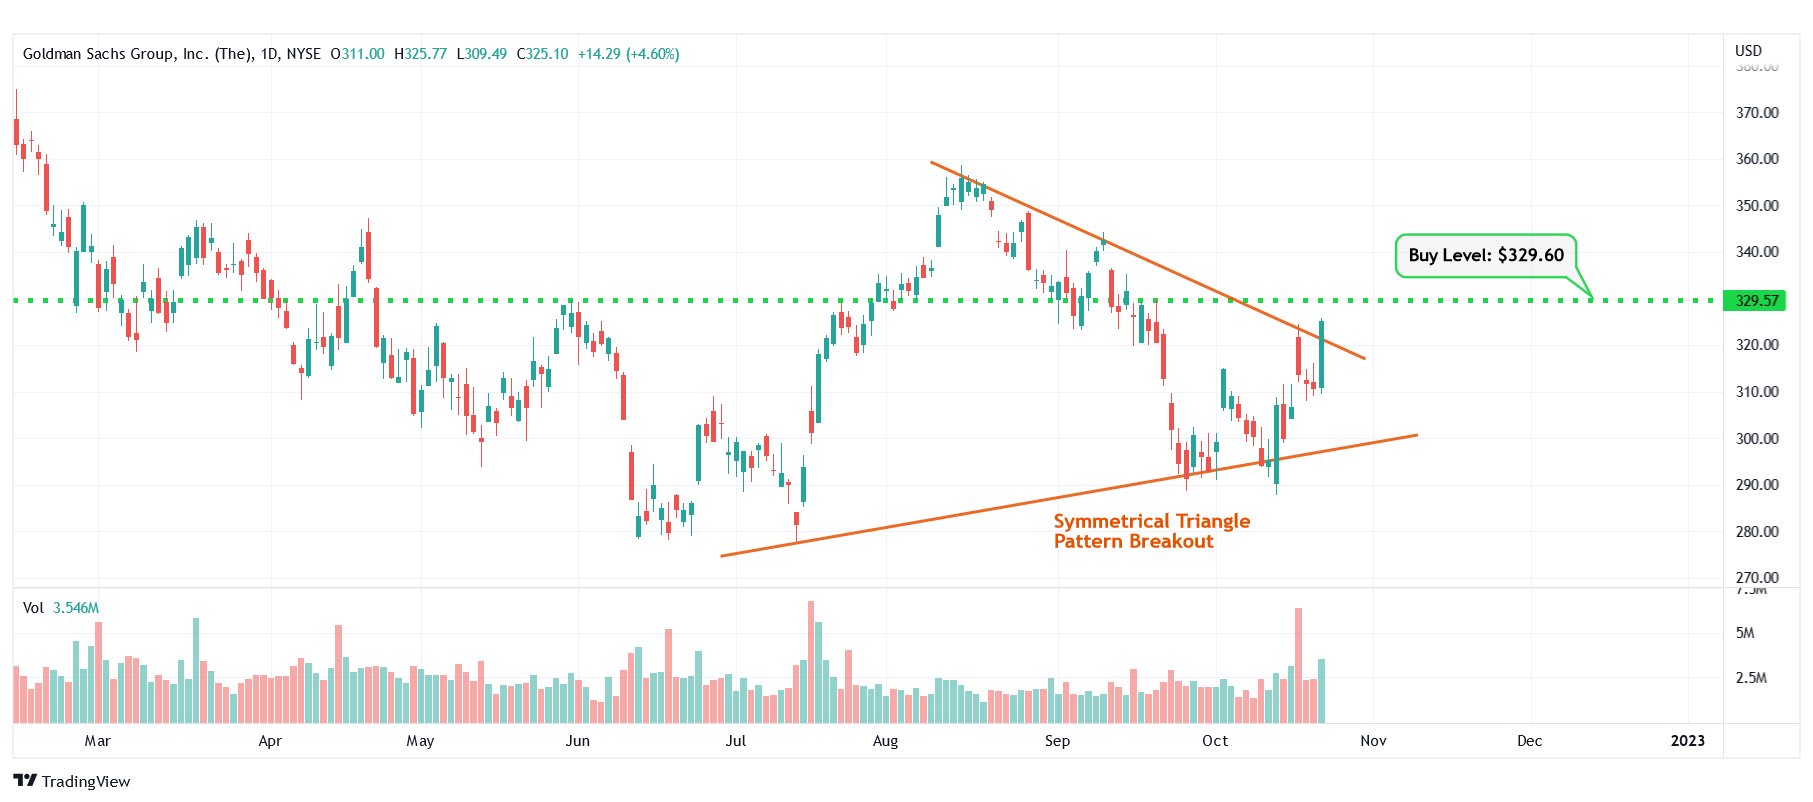
GS – Symmetrical Triangle Pattern Breakout
#8 NVIDIA Corporation (NASDAQ: NVDA)
Sector: Technology | Semiconductors
Reason: Formation of a Falling Wedge Pattern
A falling wedge pattern is formed by joining two downward-sloping, converging trendlines having a contracting range. The pattern appears to be wide at the top and continues to contract as prices fall. A breakout from a falling wedge pattern can indicate either reversal or continuation depending on where the pattern appeared in the trend.
A stock that has broken out of a falling wedge pattern would have gained momentum and would have the potential to move higher.
Buy Level(s): The ideal buy level for NVDA is if the stock breaks out of the falling wedge pattern, at a price of around $134.00. This is marked in the chart below as a green color dotted line.
Daily chart – NVDA
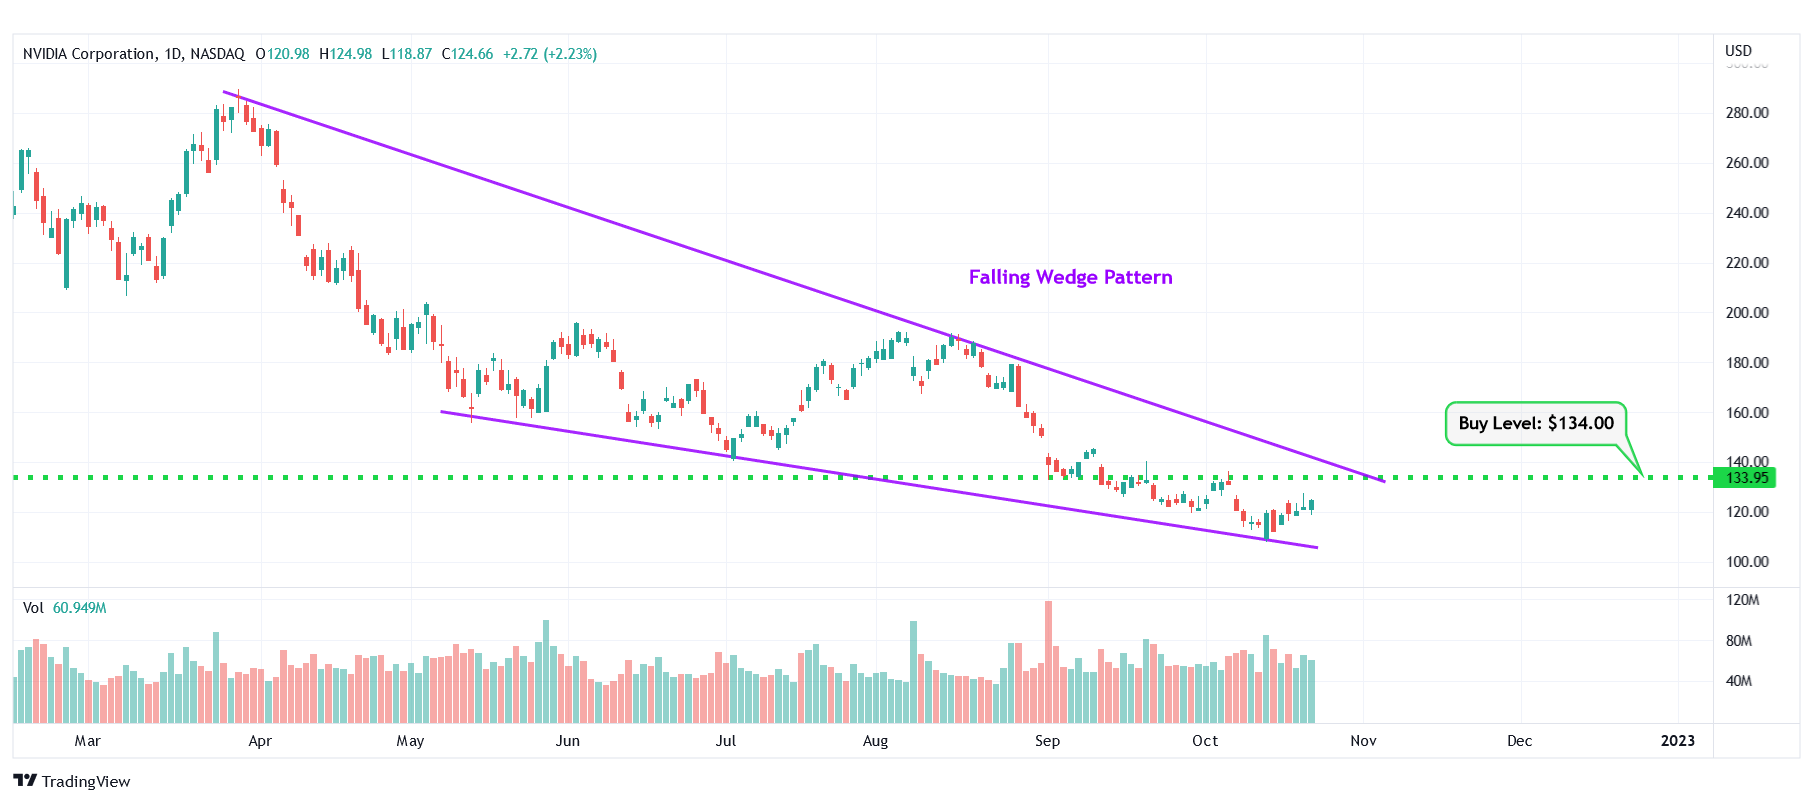
NVDA – Falling Wedge Pattern
#9 Pfizer Inc. (NYSE: PFE)
Sector: Healthcare | Drug Manufacturers – General
Reason: Downtrend Channel Breakout
A downtrend or descending channel is the price action contained between downward sloping parallel lines. It is formed by two lines that are drawn by connecting the lower highs and lower lows of a stock’s price. Even though this is typically a bearish pattern, a breakout from the upper rail of this pattern is considered a good bullish indication.
Buy Level(s): The daily chart shows that the stock has currently broken out of a downtrend channel. However, there is a near-term resistance level for the stock. Hence, the ideal buy level for PFE is if the stock has a daily close above $45.30. This is marked in the chart below as a green color dotted line.
Daily chart – PFE
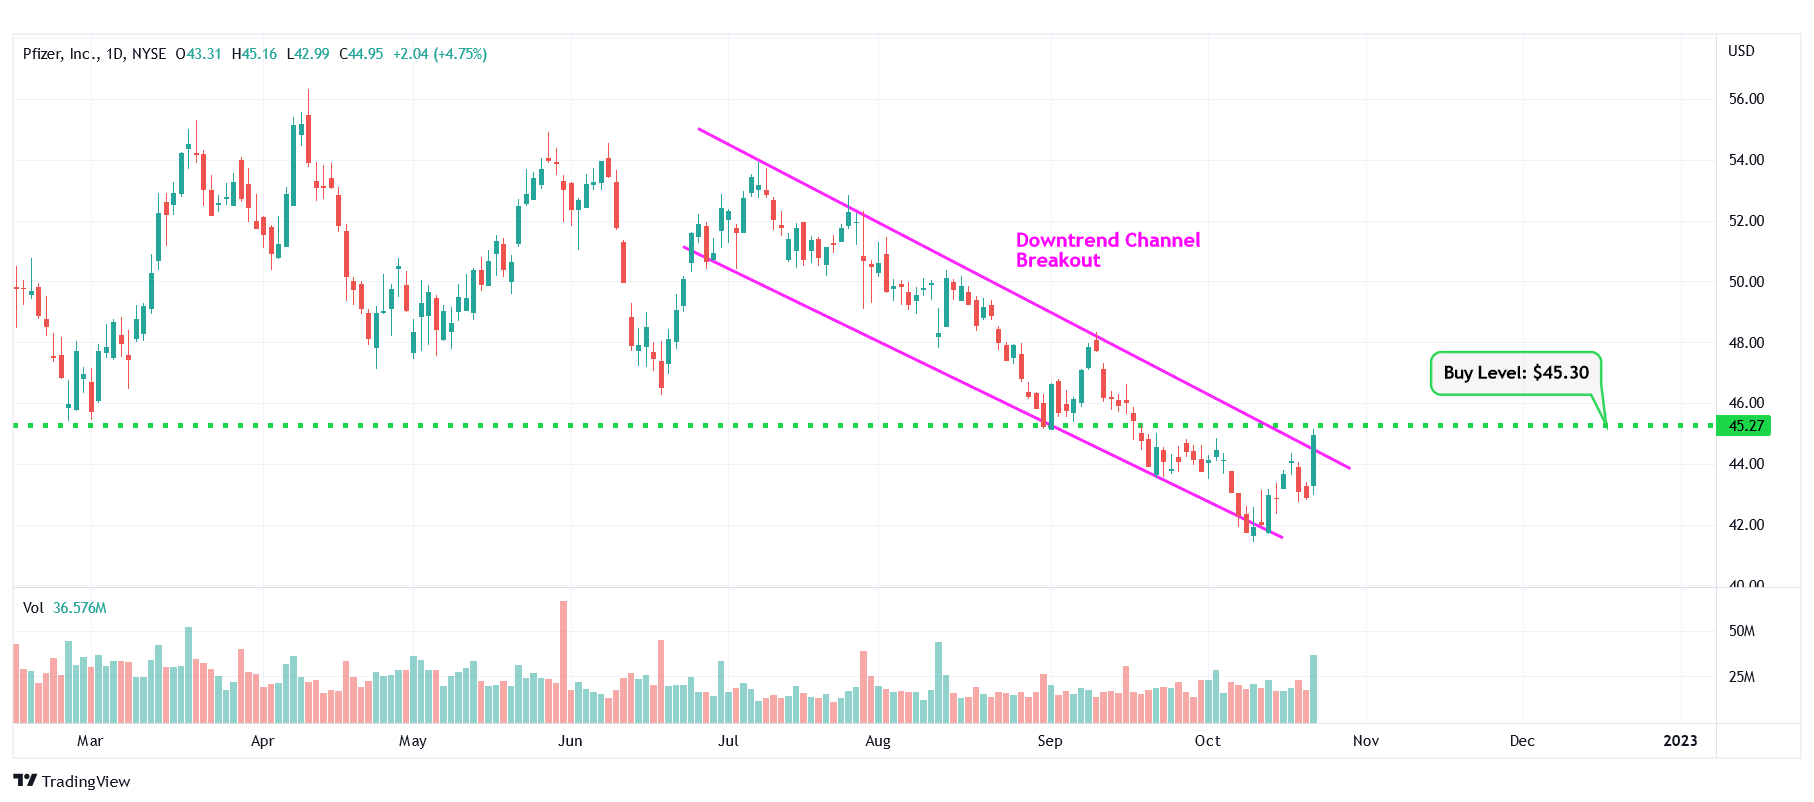
PFE – Downtrend Channel Breakout
#10 Shopify Inc. (NYSE: SHOP)
Sector: Technology | Software – Application
Reason: Falling Wedge Pattern Breakout
A falling wedge pattern is formed by joining two downward-sloping, converging trendlines having a contracting range. The pattern appears to be wide at the top and continues to contract as prices fall. A breakout from a falling wedge pattern can indicate either reversal or continuation depending on where the pattern appeared in the trend.
A stock that has broken out of a falling wedge pattern would have gained momentum and would have the potential to move higher.
Buy Level(s): The stock has currently broken out of a falling wedge pattern. However, the ideal buy level for SHOP is above the nearest resistance level of $32.50. This is marked in the chart below as a green color dotted line.
Daily chart – SHOP
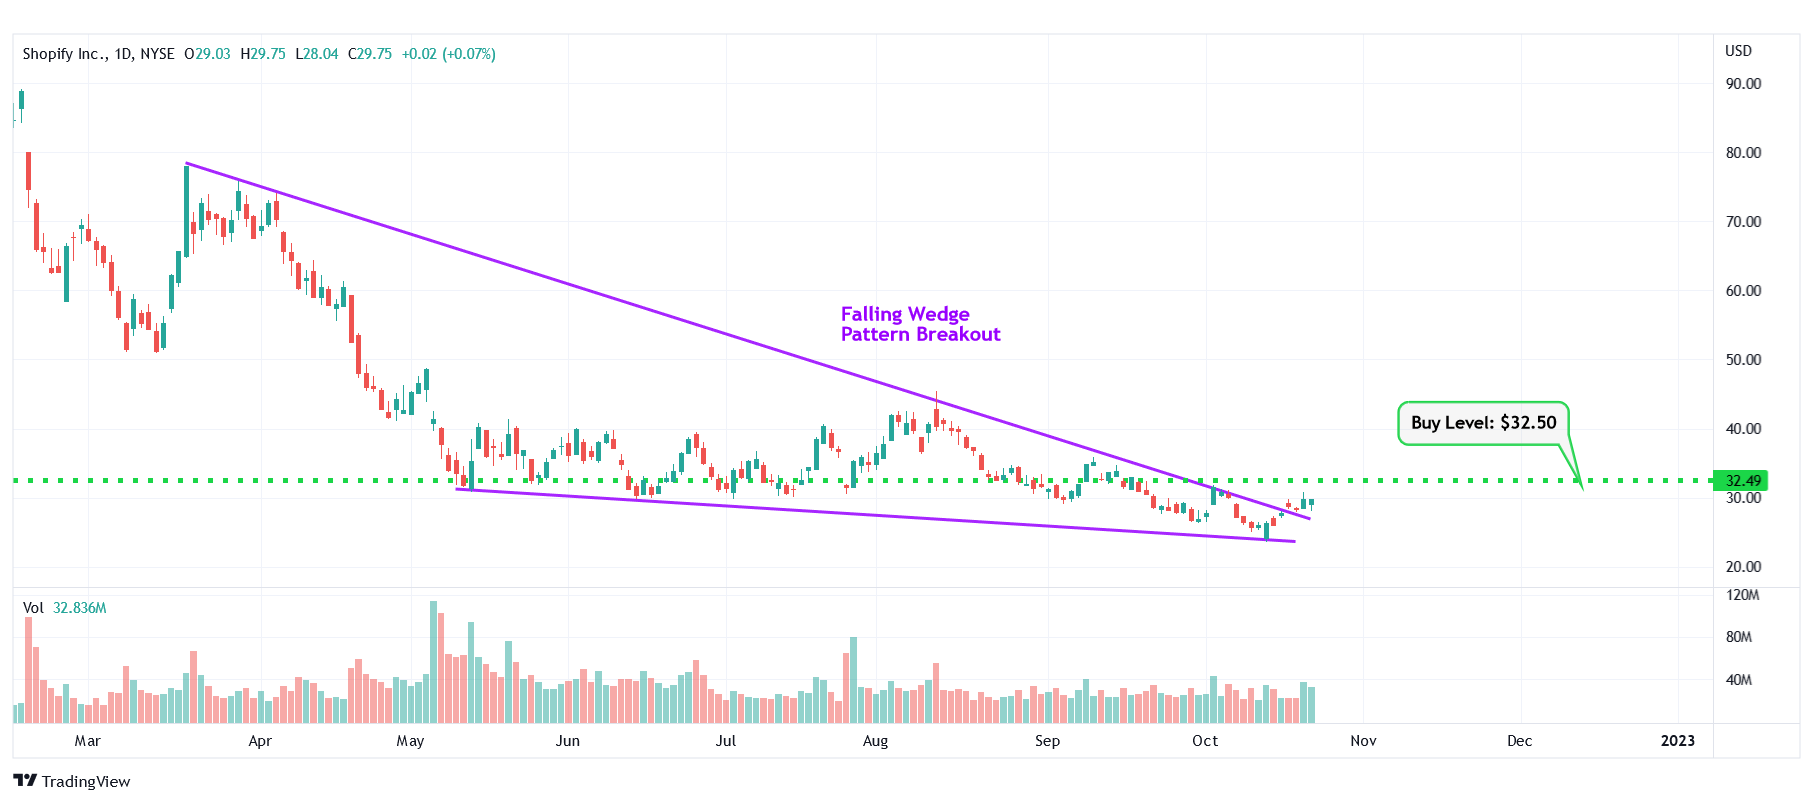
SHOP – Falling Wedge Pattern Breakout
Happy Trading!
Trades of The Day Research Team
Source: Trades of the Day
