
We recently started a series called “Penny Stock of the Day”. These ideas are geared towards traders with an extremely high risk appetite.
Our Penny Stock of the Day is chosen by screening for stocks under $5 and then applying technical analysis on the shortlisted set of penny stocks showing unusual volume. When making these trades, please make sure to pay vigilant attention to pricing moves and have a strict stop loss in place to avoid significant losses.
Penny Stock of the Day: Aurora Innovation Inc. (NASDAQ: AUR)
Today’s penny stock pick is the self-driving technology company, Aurora Innovation Inc. (NASDAQ: AUR).
Aurora Innovation Inc. is an American self-driving vehicle technology company based in Pittsburgh, Pennsylvania, and Mountain View, California. Aurora is known for developing the Aurora Driver, a platform that brings a suite of self-driving hardware, software, and data services together to adapt and interoperate passenger vehicles, light commercial vehicles, and trucks.
Website: https://aurora.tech
Latest 10-k report: https://sec.report/Document/0001628280-22-005886/, https://sec.report/Document/0001828108-22-000102/ (Amended)
Analyst Consensus: As per TipRanks Analytics, based on 1 Wall Street analyst offering 12-month price targets for AUR in the last 3 months, the stock has an average price target of $4.00, which is nearly 65% upside from current levels.

Source: Tipranks.com
Potential Catalysts / Reasons for the Hype:
- Reports that the company’s CEO recently laid out a range of options to respond to worsening market conditions and partners pushing out timelines, including a possible sale to Apple Inc. or Microsoft Corp.
- Hedge Funds Increased Holdings by 709.8K Shares Last Quarter.
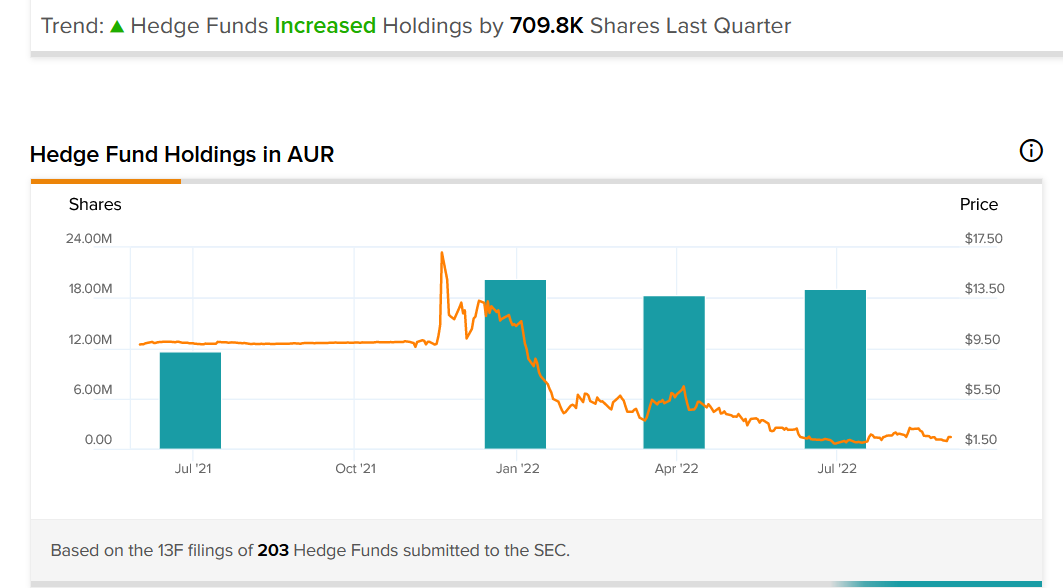
Hedge Funds | Source: Tipranks.com
On analyzing the company’s stock charts, there seem to be multiple bullish indications…
Bullish Indications
#1 Falling Wedge Pattern Breakout: The daily chart shows that the stock has been forming a falling wedge pattern for the past several months. These are marked as pink color lines. It has typically taken support at the bottom of the wedge before bouncing back. The stock has currently broken out from the falling wedge pattern. Once the stock breaks out of the falling wedge pattern, it could move higher.
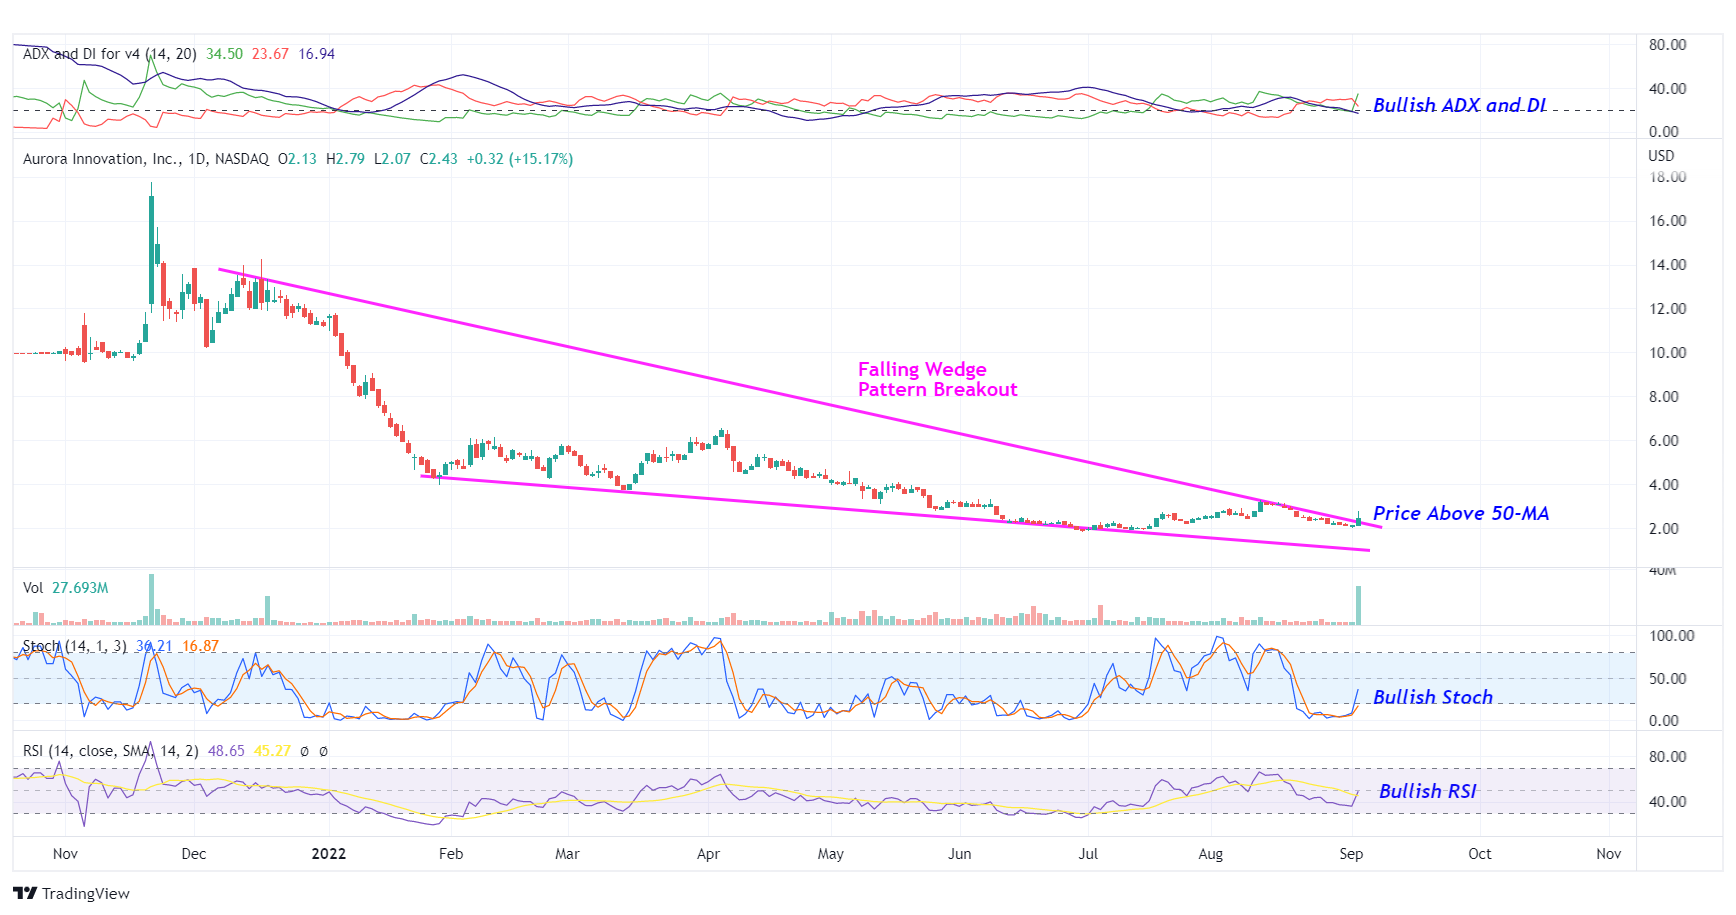
AUR – Daily Chart
#2 Bullish ADX and DI: The ADX indicator shows bullishness as the +DI line is above the -DI line, and the ADX line is currently moving higher from below the +DI and -DI lines.
#3 Price above MA: The stock is currently above its 50-day SMA, indicating that the bulls have currently gained control.
#4 Bullish RSI: The RSI is above 50 and moving higher, indicating possible bullishness.
#5 Bullish Stoch: The %K line of the stochastic is above the %D line, and has also moved higher from oversold levels, indicating possible bullishness.
#6 Above Support Area: The weekly chart shows that the stock is currently trading above a support area, which is marked as a purple color dotted line. This is a possible bullish indication.
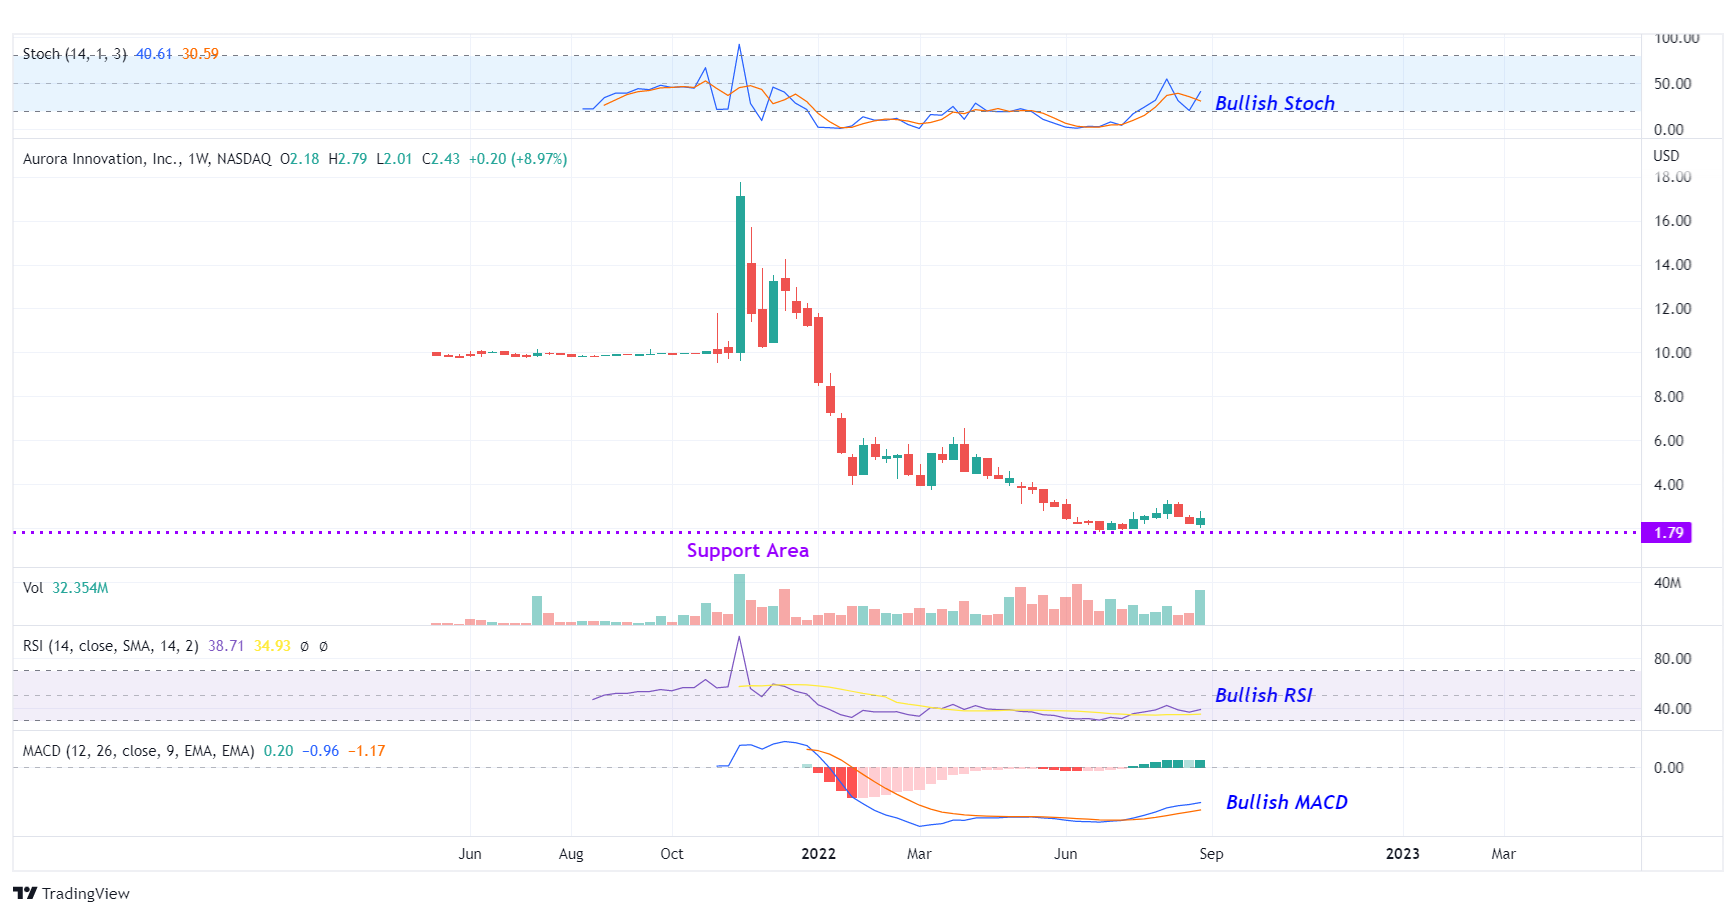
AUR – Weekly Chart
#7 Bullish Stoch: The %K line is above the %D line of the stochastic in the weekly chart as well, indicating possible bullishness.
#8 MACD above Signal Line: In the weekly chart, the MACD (light blue color) is currently above the MACD signal line (orange color). This indicates a possible bullish setup.
Recommended Trade (based on the charts)
Buy Levels: If you want to get in on this trade, the ideal buy level for AUR is above the price of $2.50.
Target Prices: Our first target is $3.60. If it closes above that level, the second target price is $5.00.
Stop Loss: To limit risk, place a stop loss at $1.90. Note that the stop loss is on a closing basis.
Our target potential upside is 44% to 100%.
For a risk of $0.60, our first target reward is $1.10, and the second target reward is $2.50. This is a nearly 1:2 and 1:4 risk-reward trade.
In other words, this trade offers 2x to 4x more potential upside than downside.
Potential Risks / Red Flags:
- The company has a history of net losses. AUR incurred net losses of $755.5 million and $214.5 million for the years ended December 31, 2021, and 2020, respectively.
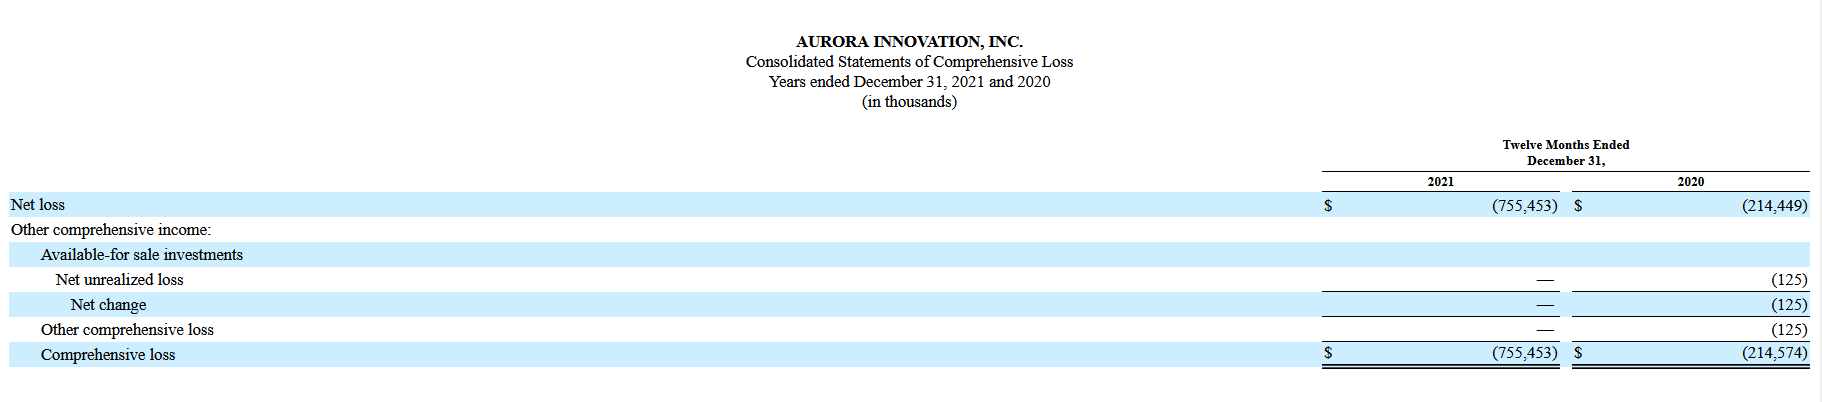
AUR – Consolidated Statements of Comprehensive Loss
- Despite being a loss-making company, the executives are being paid significant compensation.
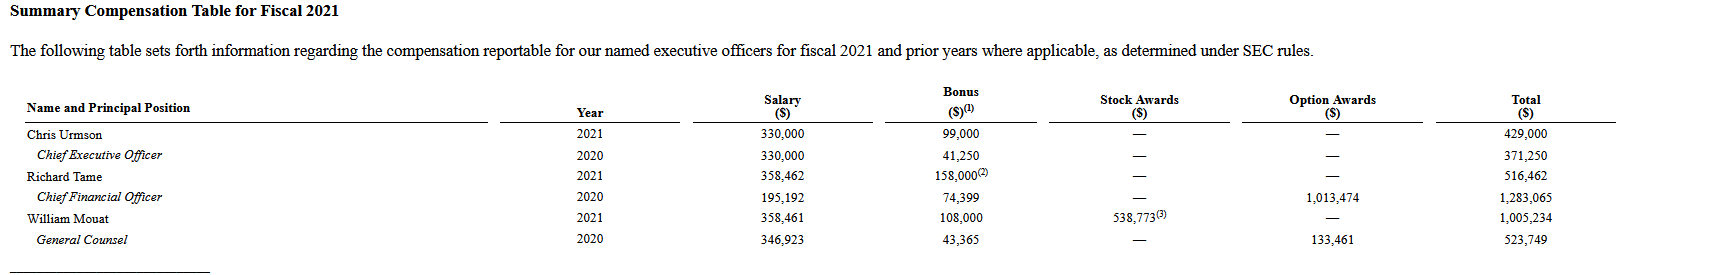
AUR – Executive Compensation: Summary Compensation Table
- The company operates in a highly competitive market and some market participants have substantially greater resources. If one or more of its competitors broadly commercialize their self-driving technology before AUR does, develop superior technology, or are perceived to have better technology, the company’s business prospects and financial performance would be adversely affected.
As you can see, today’s featured penny stock offers big upside potential… but it also comes with a number of risks and red flags. As always, when dealing with penny stocks, we advise caution before entering into such high-risk ventures. Remember to think before you trade… understand the risks… and if you decide to trade, stick to your stop-losses!
Happy Trading!
Trades of the Day Research Team
READ BEFORE TRADING PENNY STOCKS: The allure of penny stocks lies in their potential to deliver massive gains in a short period of time. However, in exchange for that opportunity, most penny stocks carry tremendous risk. They can be extremely volatile and are susceptible to “pump and dump” schemes and fraud.
Unlike regular stocks, the financial condition of most penny stock companies can be extremely difficult to analyze, as the majority of such stocks are traded on over-the-counter (OTC) exchanges, which are typically less transparent and less regulated than the major exchanges. In fact, in the penny stock space, it’s often easier to spot warning signs and red flags than it is to identify a sound investment. Nevertheless, we do our best to identify short-term trade opportunities in this exciting space because we know some of our readers are looking for high-risk, high-reward ideas. We just urge you to make sure you fully understand the risks before making any of these trades.
Imagine having 12 new monthly income checks, carrying the potential of up to 21% yields.This is possible because of a tested strategy to get paid out regularly, like a paycheck. For over a decade, I have helped more than 26,000 investors secure 12 new monthly payouts. Meaning, you know exactly how much you'll make every month... Because of some stocks that pay us 8%,13.4%, and even 21.6% yields. See it for yourself here.
Source: Trades of the Day
