
Investing is a numbers game, and at the beginning it can be very daunting. One wrong move and a great deal could be lost in the blink of an eye, so knowing how to avoid disaster is paramount to success. However, that is easier said than done. Having the proper tools and knowledge is the first step forward in an investing career, and a great way to ensure that you stay ahead of the game.
This article’s intent is to shed some light on one of those tools in an investor’s arsenal, and will primarily benefit those just getting started. For those already familiar with the topic, it will be best to skip to the last section to learn a little more about why FAST Graphs has chosen to support the methods they do.
As mentioned, knowledge is an important tool. Having something at your disposal is great, but it helps to know how to use it. Therefore, understanding the concepts, formulas, and nuances to your tools is the perfect way to optimize your experience. To help prepare new investors for their career and to shed light on some things the veterans may not have known, this article will be covering the price-to-earnings ratio, or P/E ratio.
What is the Price-to-Earnings Ratio?
The P/E ratio is a very useful tool that can serve as a guideline for an investor, and also helps set a sort of standard in the market. This ratio is a formula that is simple and readily available, and uses information that is free and public, so just about anyone can use it without too much trouble. But as mentioned earlier, there is more to a tool than just having it. Knowing what it is will be crucial.
In short, the P/E ratio is a measurement of a company’s current share price relative to its earnings-per-share (EPS). In other words, it is a formula used to determine roughly what value the market will assign a particular stock. One thing to keep in mind is that not all people refer to this as the P/E ratio. Some call it the price multiple or even the earnings multiple, so when looking for more information this will be useful to keep in mind.
As the P/E ratio is a mathematical formula, there is a little thinking involved, or at least a calculator. The ratio is simple, though, and is merely the expression of price divided by earnings, but if that was all there was to it then no one would bother writing an article about it. The P/E ratio has some failings, and knowing this will be key to making the most of it.
Price of a share is typically accurate because it is reported in real time, so it is very rarely going to be a problem. The earnings, on the other hand, is where things get tricky. Earnings tend to be reported quarterly, and can sometimes take as long as two months to public report and publish. By the time these earnings are reported, it is possible the company will already be well into the next quarter, and as a result, this delayed reporting on earnings ensures that the P/E ratio remains an estimate rather than a truly accurate calculation.
Despite this potential discrepancy, investors and analysts will use the P/E ratio to determine the value of a company’s shares by comparing it to the company’s historical record, or to projected earnings for the future. It is also commonly used when comparing two or more companies, comparing aggregate markets against one another over time, or when comparing to an industry group or established benchmark like the S&P 500. No matter what situation the P/E ratio will be used in, it will be critical to know whether the earnings estimate is for the future (projected) or values from the past (trailing).
Though we’ll go into more detail about these situations later, it is important to know because trailing reports have a tendency to be outdated as they use information from the last fiscal year. On the other hand, projected estimates are a best-guess situation regarding future earnings, and have a whole host of problems that could crop up at any time.
Why is the P/E Ratio Important?
With all that has been said so far, the P/E ratio might not sound like the most trustworthy tool. Certainly, there are pitfalls that need to be avoided, and it should never be taken as gospel, but it is still the most commonly used formula by analysts and investors to determine the valuation of a particular stock. This goes to show that even if there are problems, it is still better than the alternatives, and until something better comes along, if ever, it will continue to be the go-to tool for determining whether a stock is over- or undervalued.
When reviewing P/E ratios, a high value would imply that investors are anticipating higher earnings growth in the near future. A high P/E ratio can also imply that a company is performing better than they did in the previous year. On the other hand, a low P/E ratio tends to suggest the opposite; a company is likely struggling when it has a low P/E ratio, or is showing some sort of decline, temporary or otherwise, or it may be influenced by something else entirely.
It is very possible for projected earnings, and even real earnings, to be affected on a macro scale, such as with major windfalls or situations within a market that could lead to greater frequency of investment or even aversion to a particular market that could have investors running to more promising prospects. Sometimes, these events are obvious well before they actually happen, but occasionally, they pop up suddenly and without warning. This is one of the major drawbacks of using forward projections in the calculations.
The nature of the P/E ratio allows it to serve as a method of standardization for the market by a means of establishing a relatively consistent value for $1 of earnings. In this regard, by taking values from several years and calculating a mean to use as a benchmark, an investor could determine whether a stock is worth buying or avoiding. In a perfect world, the P/E ratio will show what the market is willing to pay for stock today based on the projected earnings, or the earnings of the prior year. But as we’ve discussed already, there are reasons to bring a little skepticism to the table.
The P/E Ratio Formula and Calculation
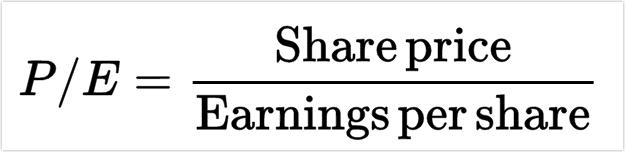
We’ve already established that the P/E ratio is a simple formula.
The ratio equals the market value per share over the earnings per share. You may simply divide the current price by the earnings and you’re all set. These stock prices you’d be using can be acquired on virtually any financial website, and are generally considered to be reliable numbers. The earnings-per-share, however, are less certain and this is because they are a projection looking forward, or an analysis of the past, and therefore are either out of date or merely an estimate.
 A major part of determining the P/E ratio is whether an investor uses forward values or trailing values. A forward price-to-earnings, also known as a leading P/E, is a method of projecting the P/E values by looking to the future, rather than taking past values into account. As this relies upon estimates and projections, it is not an accurate reflection of value, and should be treated accordingly.
However, it is a very useful way to get an idea of what trends imply about future value, as well as what analysts feel the future may hold. It does have a few other qualities that should be taken into account, too. It is possible for a company to underestimate or short sell their future earnings in order to beat their projected earnings and thereby look like they are performing better than they might actually be. Conversely, they may overestimate their earnings and adjust in their next earnings announcement. This can give the company an opportunity to manipulate perception of their potential.
The alternative to forward P/E is a trailing P/E ratio. Instead of looking at future projections, this method utilizes the performance of the company over the past twelve months. Because it is using real, reported numbers, it is not an estimate, but actual value – so long as the company reports accurately, that is. While this might sound better at first glance, these numbers are outdated, and therefore can only be relied on so much.
Despite that drawback, some investors choose trailing P/E ratios because they do not trust estimates and place their faith in real values. But, past success does not guarantee success in the future. Numbers from the past year could be greatly influenced by a major event which could cause extreme variance if not taken into account, and even if you do try to keep an eye on it, trailing P/E is generally reported quarterly, so it is often out of date the moment it is posted.
Blended P/E Ratio and Why We Use It
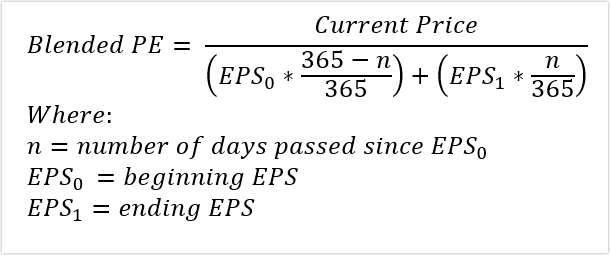
In an attempt to tackle some of the deficiencies in forward and trailing P/E, FAST Graphs utilizes a blended P/E ratio, which has a few advantages and helps to make things a little more accurate and reliable.
However, just like the other methods of estimating, it is not perfect. The blended calculation uses a weighted average of the most recent, actual value and the closest projected value. By reducing the time frame in both the forward and trailing ranges, the blended calculation takes advantage of more relevant information, and avoids the likelihood of some pitfalls of estimating over a longer period of time.
 The blended ratio is not foolproof, and it may be best to utilize it in conjunction with the other ratio types in order to get a better idea of what growth and past performance implies about the future. It can also be helpful to compare the P/E ratio of the target company against those in the same sector. This can help identify whether or not it is a successful business or just a trend in the industry as a whole.
None of these methods are ideal, but they do work – at least better than alternatives. They have their strengths and weaknesses, and therefore, as mentioned earlier, it is important to know how to use the ratio, why we use it, and where these values come from. If you just look at the P/E ratio and base everything off of that without looking at the bigger picture you may run into trouble, but if you step back, observe everything else necessary, then it may just help you make the right decisions.
— Chuck Carnevale
The old way of investing in tech giants is over. A NEW strategy unlocks 146X more income on the SAME underlying stocks (like Meta, Apple, and Amazon) -- WITHOUT options trading. Click here to uncover the NEW MAG-7 alternative.
Source: FAST Graphs
