

I want to tell you about a high-quality stock that pays big, growing, reliable dividends. These growing dividends are funded by growing profit, because this business is the world’s foremost asset manager.
Asset management is basically a can’t-lose business model. An asset manager is paid fees to manage assets that are, usually, rising in price and value.
Not just rising. Rising exponentially.
What do you think that means for fees, sales, and profits? I can certainly tell you what it means for this company’s dividend – it continues to grow like clockwork.
 I’ve personally invested in stocks just like this one on my way to going from below broke at age 27 to financially free at 33.
By the way, I explain exactly how I achieved financial freedom in just six years in my Early Retirement Blueprint.
Getting back to the stock I’ll tell you about today though, perhaps best of all, it looks undervalued right now.
Price is what you pay. But value is what you get.
Why’s that important? Because buying a dividend growth stock when it’s undervalued should provide a higher yield, greater long-term total return potential, and reduced risk. With this in mind, I want to tell you about an opportunity I recently came across with a stock that appears to be trading at a significant discount today…

BlackRock, Inc. (BLK)
BlackRock, Inc. (BLK) – is a multinational investment management corporation.
Founded in 1988, BlackRock is now a $113 billion (by market cap) investment management leviathan that employs nearly 19,000 people.
With approximately $8.5 trillion in assets under management, BlackRock is the largest asset manager in the world. Equity products account for 58% of the company’s long-term assets under management; fixed income products, 30%; multi-asset class products, 9%; and alternative investment products, 3%.
I love the asset management business model. It’s simple yet incredibly powerful. In simple terms, BlackRock charges fees to manage global assets. But this is powerful because of the way in which the fee base is exponentially increasing.
See, BlackRock has tremendous exposure to global equities. As our world’s population and collective economic output rises, this helps to fuel compounding growth across the spectrum of global businesses.
Did you catch that? BlackRock’s fee base is compounding over time. Making this concept even more powerful is BlackRock’s massive scale, which supercharges the process. BlackRock is sitting in a rising tide (global capital markets) that’s lifting all boats (participants in said capital markets).
However, being the largest boat in that rising tide, BlackRock stands to disproportionately benefit.
This powerful compounding effect across BlackRock’s fee base positions them to continue growing their revenue, profit, and dividend for years to come.
Dividend Growth, Growth Rate, Payout Ratio and Yield
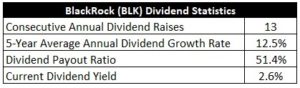
As things stand now, BlackRock has increased its dividend for 13 consecutive years. The 10-year dividend growth rate is 11.6%. Better yet, there’s been some acceleration in the growth of the dividend.
The five-year dividend growth rate is 12.5%, and the most recent dividend increase came in at 18.2%. On top of that double-digit dividend growth, the stock also yields a market-beating 2.6%.
 This yield, by the way, is 30 basis points higher than its own five-year average.
And with a payout ratio of 51.4%, which almost perfectly balances retaining earnings for the business against returning capital to shareholders, the dividend is protected and healthy.
I like dividend growth stocks in what I refer to as the “sweet spot” – a yield of between 2.5% and 3.5%, paired with a high-single-digit (or better) dividend growth rate. The yield here is on the lower end of what I tend to look for, but the dividend growth rate more than makes up for it.
Great dividend metrics.
Revenue and Earnings Growth
Looking at business growth, BlackRock advanced its revenue from $9.3 billion in FY 2012 to $19.4 billion in FY 2021. That’s a compound annual growth rate of 8.5%.
I usually look for a mid-single-digit top-line growth rate from a mature company like this. BlackRock blew my expectations out of the water with this excellent revenue growth.
Meanwhile, the company grew earnings per share from $13.79 to $38.22 over this period, which is a CAGR of 12.0%. Again, excellent growth across the business.
This is especially true with the business already being so large and mature 10 years ago. Growing a large base at a high rate like this is challenging and proves out the quality and prowess of the business.
We can also see that EPS growth and dividend growth have been almost perfectly in sync with one another, indicating prudence on the part of management.
I’ll quickly note that buybacks have certainly helped to drive a lot of the excess bottom-line growth, with the outstanding share count down by approximately 13% over the last decade.
Looking forward, CFRA is forecasting that BlackRock will compound its EPS at an annual rate of 13% over the next three years.
Essentially, CFRA believes that BlackRock will continue to grow as it has been. This forecast is almost right in line with the 12% CAGR that BlackRock proved up over the last 10 years. Assuming a continuation of the status quo seems like a safe, smart bet to me. I think it’s important to understand that two complementary aspects of the business favorably differentiate BlackRock from much of its competition.
First, BlackRock has been recording net inflows.
In contrast, many large asset managers, particularly those who focus on active strategies, have been recording net outflows as passive, low-cost ETFs pull in more capital from investors.
This is a secular challenge across the industry that only a few large asset managers have been able to successfully navigate.
CFRA highlights this strength, stating “…BLK’s top-tier position in passive investments and strong fund performance will attract assets at above industry-average rates over the next few years, despite competitive pressures and secular challenges within the asset management industry.”
To add some color to this, BlackRock reported $540 billion in net inflows for FY 2021.
Furthermore, BlackRock most recently recorded $90 billion in total net inflows for Q2 FY 2022 – despite extremely elevated volatility across the markets during the quarter.
That’s exceptional.
Second, and interrelated to the first point, BlackRock has been able to balance active strategies with ETFs. BlackRock has built itself to cater to numerous client types and investment styles. They capture capital either way. With capital flowing toward ETFs, BlackRock still benefits – through their ownership of iShares, they’re the largest ETF provider in the world.
CFRA notes BlackRock’s compelling situation on this front: “We also see healthy growth potential from equity and fixed income ETFs as well as alternative style funds, which will likely enhance BLK’s asset inflows as new funds gain traction.”
What I see is a competitive position that is almost unassailable. In my view, putting it all together, BlackRock should be able to continue generating double-digit EPS and dividend growth for at least the next 5-10 years. You’re layering that kind of growth on top of a starting yield of 2.6%, leaving little to be desired.
Financial Position
Moving over to the balance sheet, BlackRock has a spectacular financial position. The long-term debt/equity ratio is 0.2, while the interest coverage ratio is 40. Profitability is terrific, with steady improvement. Over the last five years, the firm has averaged annual net margin of 32.3% and annual return on equity of 15%. This best-in-class business has outstanding fundamentals across the board.
It’s a pristine operation. And with massive scale, a “sticky” asset base, a diversified product mix, and global brand recognition, BlackRock benefits from durable competitive advantages.
Of course, there are risks to consider.
Litigation, regulation, and competition are omnipresent risks in every industry. The business model in and of itself introduces exposure to global capital markets and the associated volatility.
Economic cycle risk is present. A recession would likely hurt asset valuations, which would then likely negatively impact AUM, fees, and profits.
The shift from active to passive strategies moves capital away from certain higher-fee products, but BlackRock’s leadership in ETFs mitigates this risk.
The law of large numbers is a risk. BlackRock’s huge AUM base makes it challenging to grow at a high rate in percentage terms.
Stock Price Valuation
It’s very much worth considering these risks before investing, but I also see these risks as being more than offset by the quality and leadership of this business. And with the stock down nearly 25% from its 52-week high, the current valuation makes this name especially appealing.
The stock’s P/E ratio is sitting at 19.6.
That’s basically right in line with its own five-year average, which shows that the stock’s price correction was due. On the other hand, the P/CF ratio of 23.3 is well off of its own five-year average of 26.9. And the yield, as noted earlier, is significantly higher than its own recent historical average.
I valued shares using a dividend discount model analysis. I factored in a 10% discount rate and a long-term dividend growth rate of 8%. That dividend growth rate is as high as I’ll go, but I think BlackRock deserves the benefit of the doubt. This mark is lower than the company’s demonstrated EPS and dividend growth over the last decade.
It’s also lower than the near-term expectation for EPS growth. And with the payout ratio still being so balanced, the dividend should grow roughly in line with EPS.
If anything, BlackRock could, and likely will, exceed this 8% dividend growth rate over the next few years, but I’d rather err on the side of caution. Moreover, this is a very long-term model, which would allow for a slowdown in growth down the road.
The DDM analysis gives me a fair value of $1,054.08. The reason I use a dividend discount model analysis is because a business is ultimately equal to the sum of all the future cash flow it can provide.
The DDM analysis is a tailored version of the discounted cash flow model analysis, as it simply substitutes dividends and dividend growth for cash flow and growth.
It then discounts those future dividends back to the present day, to account for the time value of money since a dollar tomorrow is not worth the same amount as a dollar today. I find it to be a fairly accurate way to value dividend growth stocks.
Morningstar rates BLK as a 4-star stock, with a fair value estimate of $850.00.
CFRA rates BLK as a 5-star “STRONG BUY”, with a 12-month target price of $775.00.
I came out somewhat high, but nobody sees this stock as overpriced right now. Averaging the three numbers out gives us a final valuation of $893.03, which would indicate the stock is possibly 20% undervalued.
 Bottom line: BlackRock (BLK) is a high-quality business with stellar fundamentals. It should continue to benefit from being the biggest boat located in a rising tide lifting all boats. With a market-beating yield, double-digit dividend growth, a balanced payout ratio, 13 consecutive years of dividend increases, and the potential that shares are 20% undervalued, this looks like a fantastic opportunity for long-term dividend growth investors.
— Jason Fieber
P.S. If you’d like access to my entire six-figure dividend growth stock portfolio, as well as stock trades I make with my own money, I’ve made all of that available exclusively through Patreon.
Note from DTA: How safe is BLK’s dividend? We ran the stock through Simply Safe Dividends, and as we go to press, its Dividend Safety Score is 98. Dividend Safety Scores range from 0 to 100. A score of 50 is average, 75 or higher is excellent, and 25 or lower is weak. With this in mind, BLK’s dividend appears Very Safe with a very unlikely risk of being cut. Learn more about Dividend Safety Scores here.

P.S. If you’d like access to my entire six-figure dividend growth stock portfolio, as well as stock trades I make with my own money, I’ve made all of that available exclusively through Patreon.
Source: Dividends & Income
