
Picking a winning trade on a consistent basis is not simply a stroke of luck. It’s the result of calculated screening, planning, and deliberation.
With this in mind, we have started a new weekly series on our top 10 stocks to watch this week — stocks that look poised for a possible breakout in the coming days. Traders should add these stocks to their watchlist now.
The Top 10 Stocks to Watch This Week for Possible Breakouts
| Sl # | Name of the Stock | Stock Ticker | Last Close | Buy Level(s) | Reason |
| 1 | Cognizant Technology Solutions Corporation | NASDAQ: CTSH | $69.10 | $70.40 | Downtrend Channel Breakout |
| 2 | Levi Strauss & Co. | NYSE: LEVI | $19.40 | $19.80 | Falling Wedge Pattern Breakout |
| 3 | GitLab Inc. | NASDAQ: GTLB | $57.80 | $60.00 | Symmetrical Triangle Pattern Breakout |
| 4 | JELD-WEN Holding, Inc. | NYSE: JELD | $16.95 | $17.10 | Downtrend Channel |
| 5 | Vicor Corporation | NASDAQ: VICR | $65.02 | $69.10 | Falling Wedge Pattern Breakout |
| 6 | Seagate Technology Holdings plc | NASDAQ: STX | $76.83 | $84.50 | Downtrend Channel |
| 7 | NextEra Energy, Inc. | NYSE: NEE | $80.25 | $81.20 | Symmetrical Triangle Pattern Breakout |
| 8 | The Boston Beer Company, Inc. | NYSE: SAM | $356.99 | $360.00 | Downtrend Channel Breakout |
| 9 | WNS (Holdings) Limited | NYSE: WNS | $84.92 | $86.60 | Symmetrical Triangle Pattern Breakout |
| 10 | UFP Industries, Inc. | NASDAQ: UFPI | $84.08 | $85.00 | Downtrend Channel Breakout |
Important: Typically, these trades offer a risk: reward ratio of 1:2 or 1:3 in the next 6 months, which implies 2x to 3x rewards when compared to risks. So, be sure to set your stop-loss levels and target prices accordingly to manage your risk. In addition, these trade ideas are triggered using daily closing prices, not intra-day pricing. So, if you participate in these trades, make sure that you only buy the stock once its daily close is above the recommended price level.
That said, here are the top 10 stocks to watch for a breakout, in no particular order.
#1 Cognizant Technology Solutions Corporation (NASDAQ: CTSH)
Sector: Technology | Information Technology Services
Reason: Downtrend Channel Breakout
A downtrend or descending channel is the price action contained between downward sloping parallel lines. It is formed by two lines that are drawn by connecting the lower highs and lower lows of a stock’s price. Even though this is typically a bearish pattern, a breakout from the upper rail of this pattern is considered a good bullish indication.
Buy Level(s): The daily chart shows that the stock has currently broken out of a downtrend channel. However, there is a near-term resistance level for the stock. Hence, the ideal buy level for CTSH is if the stock has a daily close above $70.40. This is marked in the chart below as a green color dotted line.
Daily chart – CTSH

CTSH -Downtrend Channel Breakout
#2 Levi Strauss & Co. (NYSE: LEVI)
Sector: Consumer Cyclical | Apparel Manufacturing
Reason: Falling Wedge Pattern Breakout
A falling wedge pattern is formed by joining two downward-sloping, converging trendlines having a contracting range. The pattern appears to be wide at the top and continues to contract as prices fall. A breakout from a falling wedge pattern can indicate either reversal or continuation depending on where the pattern appeared in the trend.
A stock that has broken out of a falling wedge pattern would have gained momentum and would have the potential to move higher.
Buy Level(s): The stock has currently broken out of a falling wedge pattern. However, the ideal buy level for LEVI is above the nearest resistance level of $19.80. This is marked in the chart below as a green color dotted line.
Daily chart – LEVI
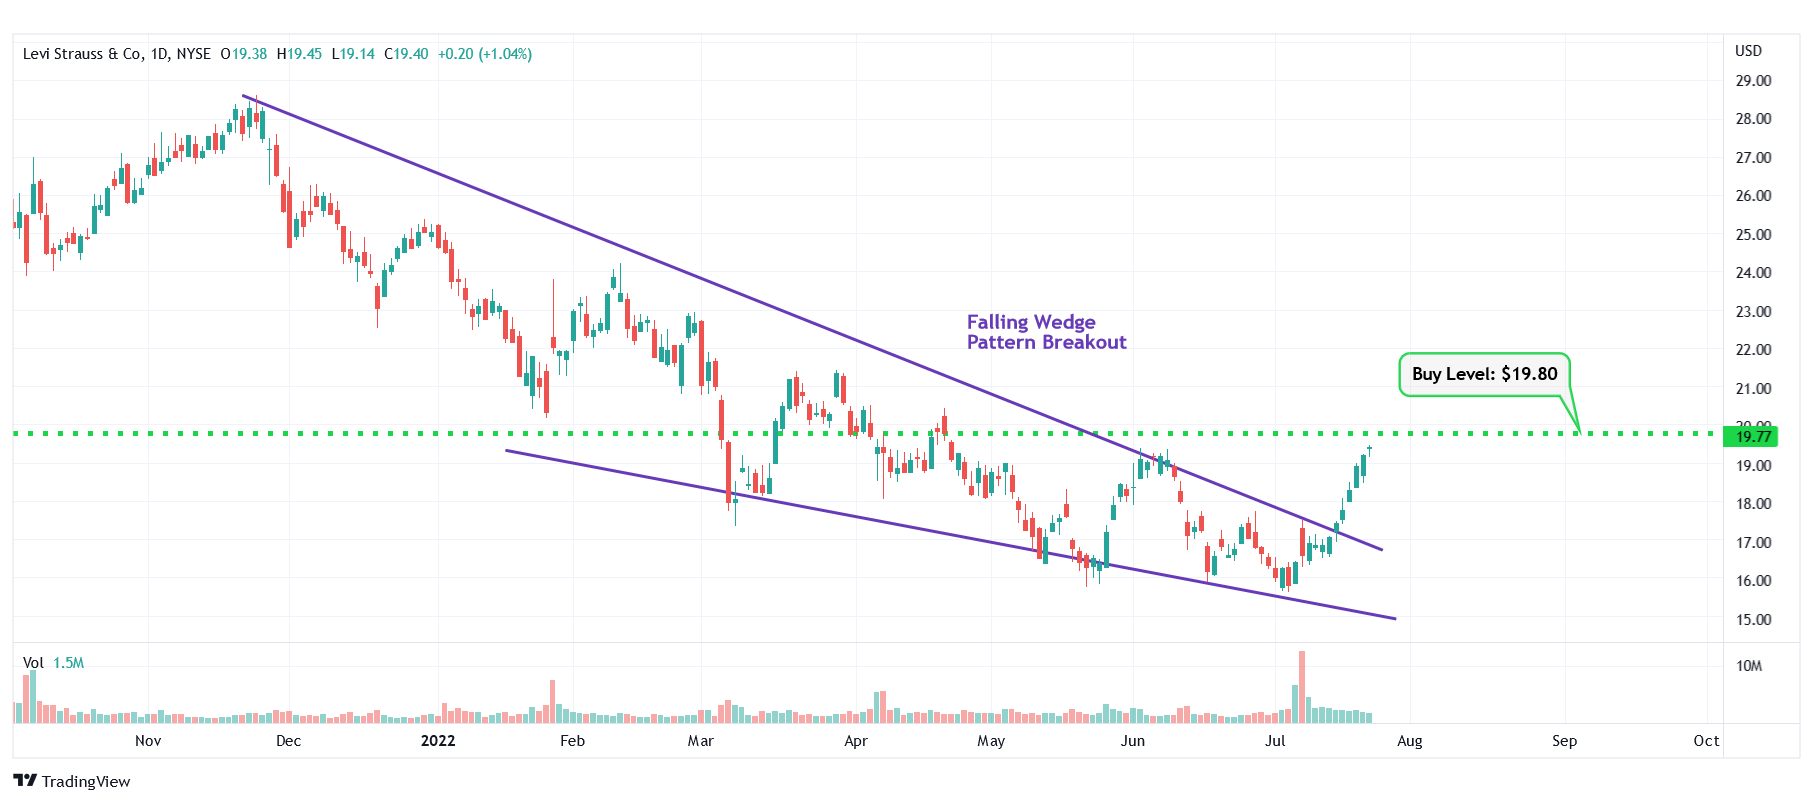
LEVI – Falling Wedge Pattern Breakout
#3 GitLab Inc. (NASDAQ: GTLB)
Sector: Technology | Software – Application
Reason: Symmetrical Triangle Pattern Breakout
A symmetrical triangle is a chart pattern formed by two converging trend lines connecting a series of sequential peaks and troughs. These two lines result in the formation of a triangle that appears to be symmetrical.
A symmetrical triangle pattern is usually formed when there is indecision in the price movements and there is uncertainty among the buyers and sellers. This chart pattern represents a period of consolidation before the price breaks out or breaks down. In case a breakout occurs from the upper trend line, it is a strong bullish indication as it signifies the start of a new bullish trend.
Buy Level(s): The stock has currently broken out of a symmetrical triangle pattern. However, the ideal buy level for GTLB is if the stock closes above the immediate resistance level of $60.00. This is marked in the chart below as a green color dotted line.
Daily chart – GTLB
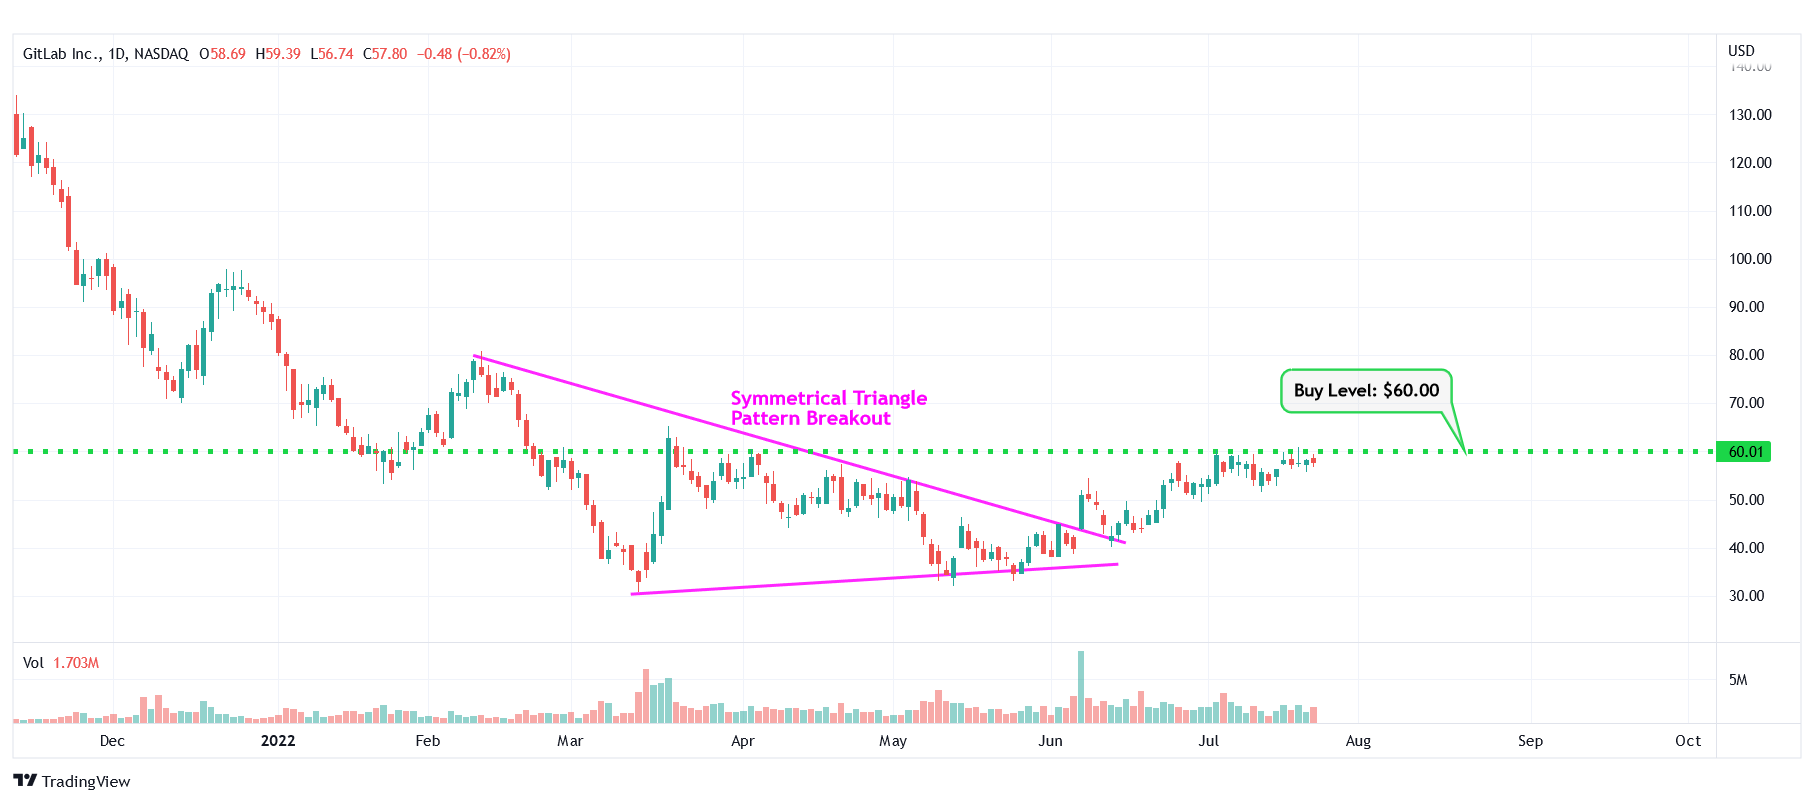
GTLB – Symmetrical Triangle Pattern Breakout
#4 JELD-WEN Holding, Inc. (NYSE: JELD)
Sector: Industrials | Building Products & Equipment
Reason: Formation of a Downtrend Channel
A downtrend or descending channel is the price action contained between downward sloping parallel lines. It is formed by two lines that are drawn by connecting the lower highs and lower lows of a stock’s price. Even though this is typically a bearish pattern, a breakout from the upper rail of this pattern is considered a good bullish indication.
Buy Level(s): The daily chart shows that the stock is currently forming a downtrend channel. The ideal buy level for JELD is if the stock breaks out of the downtrend channel and has a daily close above $17.10. This is marked in the chart below as a green color dotted line.
Daily chart – JELD
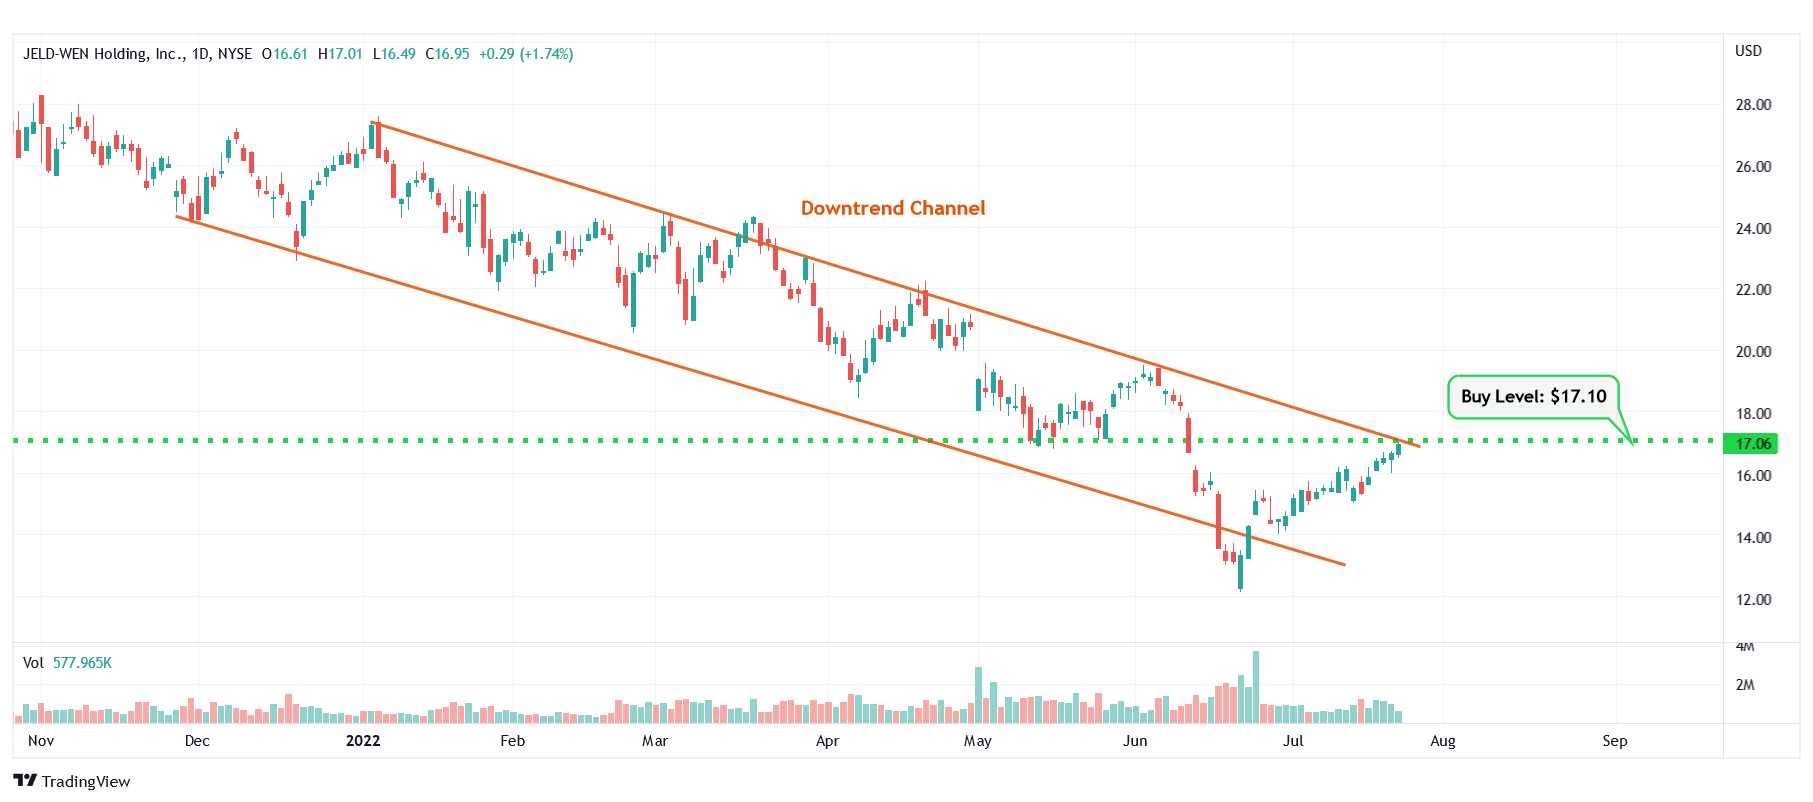
JELD – Downtrend Channel
#5 Vicor Corporation (NASDAQ: VICR)
Sector: Technology | Electronic Components
Reason: Falling Wedge Pattern Breakout
A falling wedge pattern is formed by joining two downward-sloping, converging trendlines having a contracting range. The pattern appears to be wide at the top and continues to contract as prices fall. A breakout from a falling wedge pattern can indicate either reversal or continuation depending on where the pattern appeared in the trend.
A stock that has broken out of a falling wedge pattern would have gained momentum and would have the potential to move higher.
Buy Level(s): The stock has currently broken out of a falling wedge pattern. However, the ideal buy level for VICR is above the nearest resistance level of $69.10. This is marked in the chart below as a green color dotted line.
Daily chart – VICR

VICR – Falling Wedge Pattern Breakout
#6 Seagate Technology Holdings plc (NASDAQ: STX)
Sector: Technology | Computer Hardware
Reason: Formation of a Downtrend Channel
A downtrend or descending channel is the price action contained between downward sloping parallel lines. It is formed by two lines that are drawn by connecting the lower highs and lower lows of a stock’s price. Even though this is typically a bearish pattern, a breakout from the upper rail of this pattern is considered a good bullish indication.
Buy Level(s): The daily chart shows that the stock is currently forming a downtrend channel. The ideal buy level for STX is if the stock breaks out of the downtrend channel and has a daily close above $84.50. This is marked in the chart below as a green color dotted line.
Daily chart – STX

STX – Downtrend Channel
#7 NextEra Energy, Inc. (NYSE: NEE)
Sector: Utilities | Utilities – Regulated Electric
Reason: Symmetrical Triangle Pattern Breakout
A symmetrical triangle is a chart pattern formed by two converging trend lines connecting a series of sequential peaks and troughs. These two lines result in the formation of a triangle that appears to be symmetrical.
A symmetrical triangle pattern is usually formed when there is indecision in the price movements and there is uncertainty among the buyers and sellers. This chart pattern represents a period of consolidation before the price breaks out or breaks down. In case a breakout occurs from the upper trend line, it is a strong bullish indication as it signifies the start of a new bullish trend.
Buy Level(s): The stock has currently broken out of a symmetrical triangle pattern. However, the ideal buy level for NEE is if the stock closes above the immediate resistance level of $81.20. This is marked in the chart below as a green color dotted line.
Daily chart – NEE
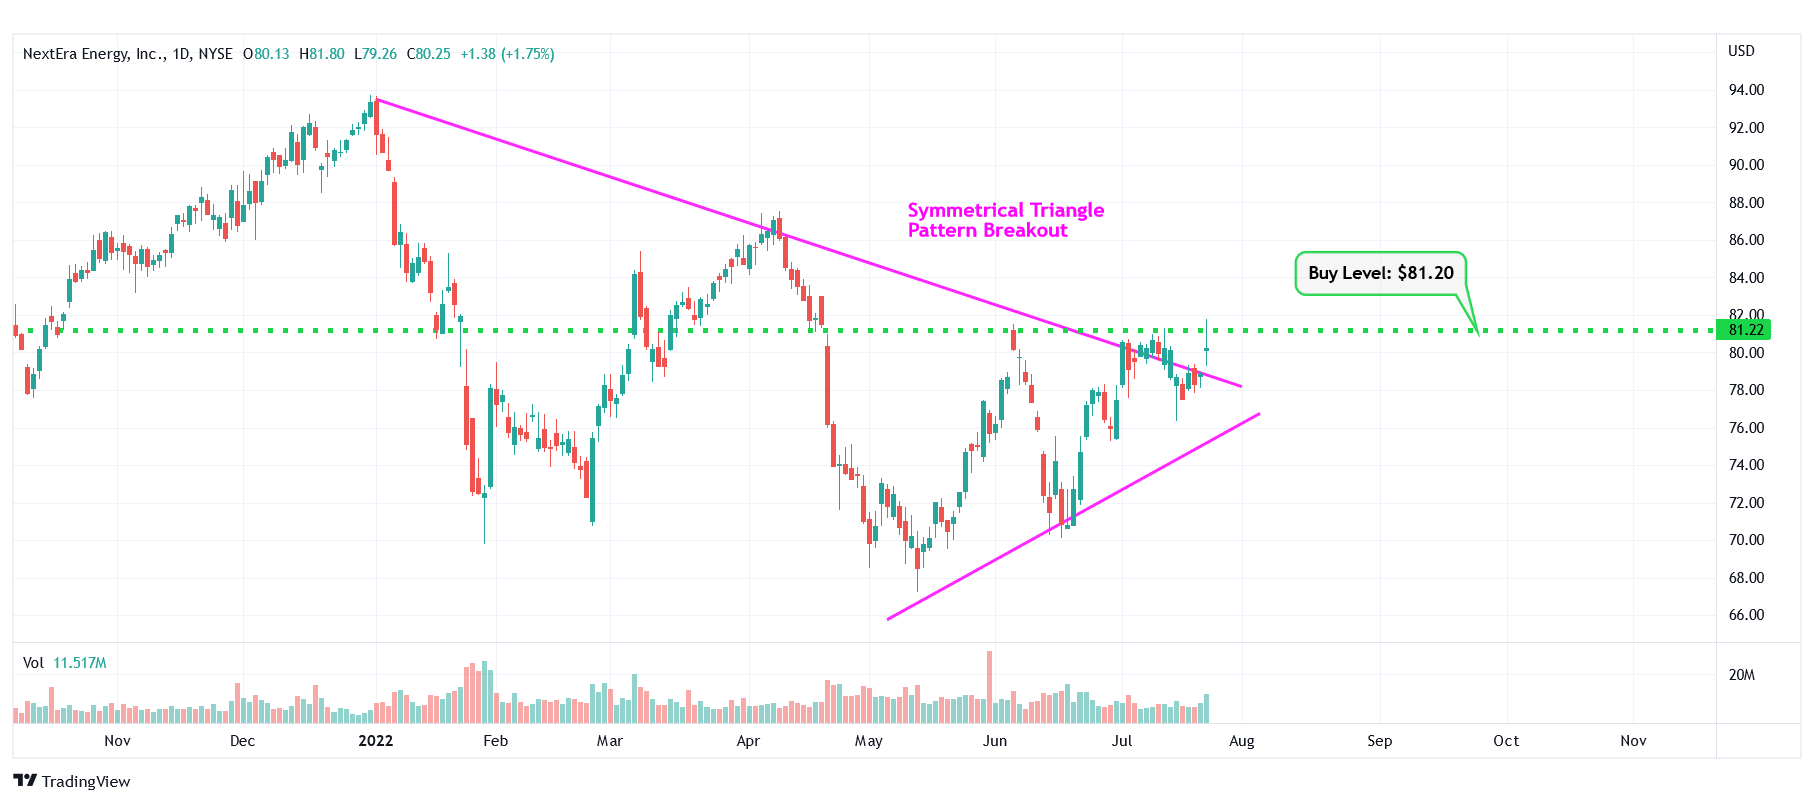
NEE – Symmetrical Triangle Pattern Breakout
#8 The Boston Beer Company, Inc. (NYSE: SAM)
Sector: Consumer Defensive | Beverages – Brewers
Reason: Downtrend Channel Breakout
A downtrend or descending channel is the price action contained between downward sloping parallel lines. It is formed by two lines that are drawn by connecting the lower highs and lower lows of a stock’s price. Even though this is typically a bearish pattern, a breakout from the upper rail of this pattern is considered a good bullish indication.
Buy Level(s): The daily chart shows that the stock has currently broken out of a downtrend channel. However, there is a near-term resistance level for the stock. Hence, the ideal buy level for SAM is if the stock has a daily close above $360.00. This is marked in the chart below as a green color dotted line.
Daily chart – SAM
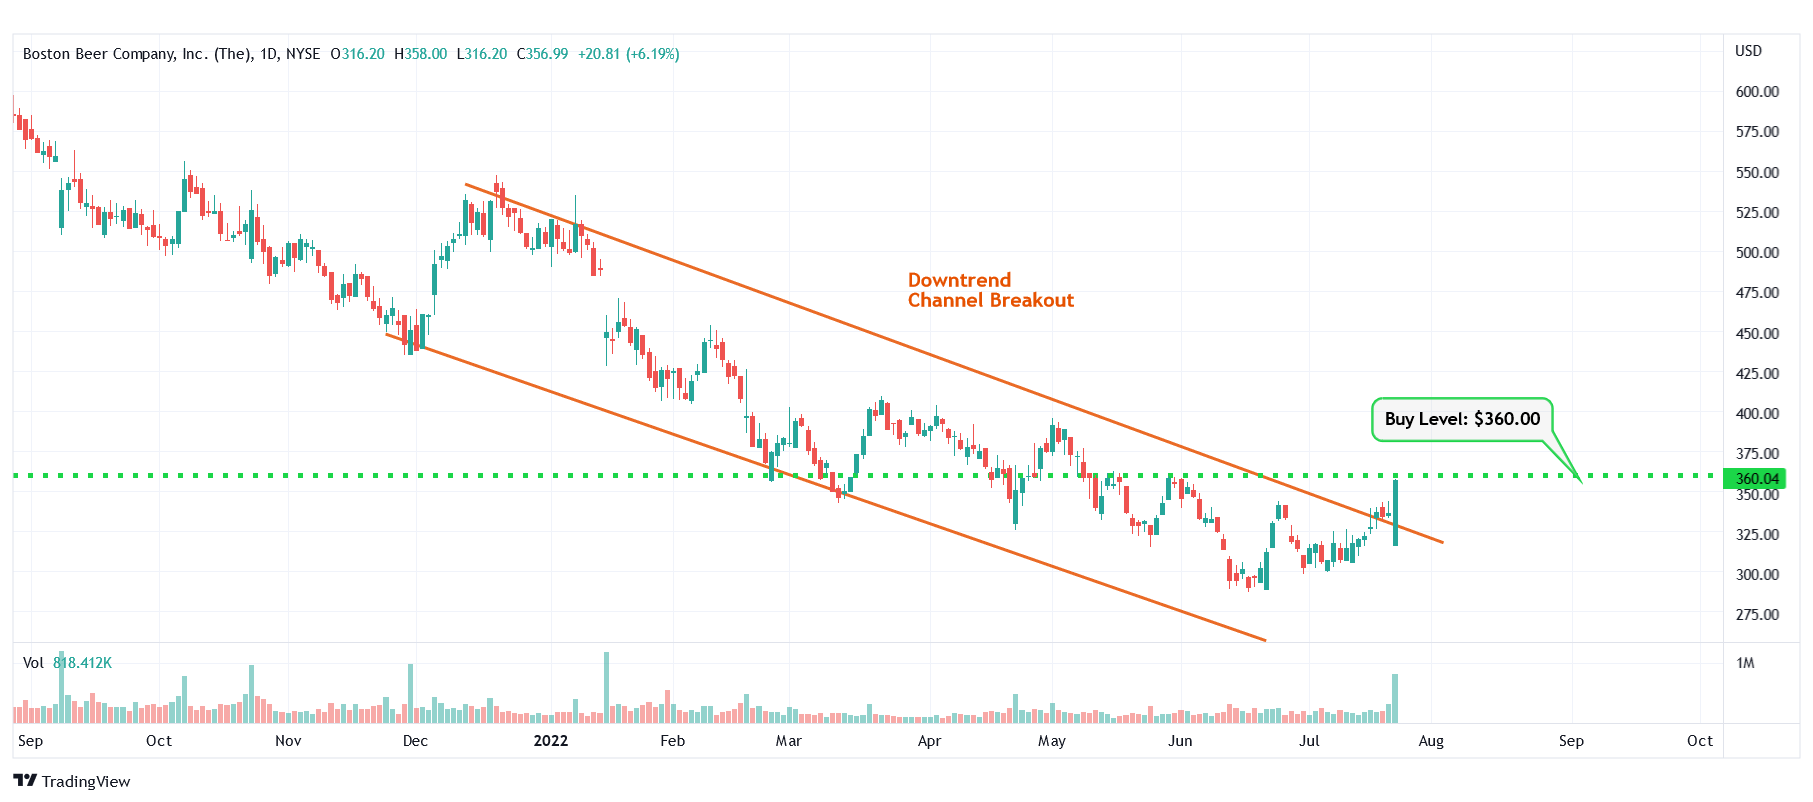
SAM – Downtrend Channel Breakout
#9 WNS (Holdings) Limited (NYSE: WNS)
Sector: Industrials | Specialty Business Services
Reason: Symmetrical Triangle Pattern Breakout
A symmetrical triangle is a chart pattern formed by two converging trend lines connecting a series of sequential peaks and troughs. These two lines result in the formation of a triangle that appears to be symmetrical.
A symmetrical triangle pattern is usually formed when there is indecision in the price movements and there is uncertainty among the buyers and sellers. This chart pattern represents a period of consolidation before the price breaks out or breaks down. In case a breakout occurs from the upper trend line, it is a strong bullish indication as it signifies the start of a new bullish trend.
Buy Level(s): The stock has currently broken out of a symmetrical triangle pattern. However, the ideal buy level for WNS is if the stock closes above the immediate resistance level of $86.60. This is marked in the chart below as a green color dotted line.
Daily chart – WNS

WNS – Symmetrical Triangle Pattern Breakout
#10 UFP Industries, Inc. (NASDAQ: UFPI)
Sector: Basic Materials | Lumber & Wood Production
Reason: Downtrend Channel Breakout
A downtrend or descending channel is the price action contained between downward sloping parallel lines. It is formed by two lines that are drawn by connecting the lower highs and lower lows of a stock’s price. Even though this is typically a bearish pattern, a breakout from the upper rail of this pattern is considered a good bullish indication.
Buy Level(s): The daily chart shows that the stock has currently broken out of a downtrend channel. However, there is a near-term resistance level for the stock. Hence, the ideal buy level for UFPI is if the stock has a daily close above $85.00. This is marked in the chart below as a green color dotted line.
Daily chart – UFPI

UFPI – Downtrend Channel Breakout
Happy Trading!
Trades of The Day Research Team
The old way of investing in tech giants is over. A NEW strategy unlocks 146X more income on the SAME underlying stocks (like Meta, Apple, and Amazon) -- WITHOUT options trading. Click here to uncover the NEW MAG-7 alternative.
Source: Trades of the Day
