
Picking a winning trade on a consistent basis is not simply a stroke of luck. It’s the result of calculated screening, planning, and deliberation.
With this in mind, we have started a new weekly series on our top 10 stocks to watch this week — stocks that look poised for a possible breakout in the coming days. Traders should add these stocks to their watchlist now.
The Top 10 Stocks to Watch This Week for Possible Breakouts
| Sl # | Name of the Stock | Stock Ticker | Last Close | Buy Level(s) | Reason |
| 1 | Beyond Meat, Inc. | NASDAQ: BYND | $31.95 | $35.30 | Downtrend Channel Breakout |
| 2 | Crocs, Inc. | NASDAQ: CROX | $58.08 | $62.10 | Falling Wedge Pattern Breakout |
| 3 | Novavax, Inc. | NASDAQ: NVAX | $76.12 | $76.50 | Downtrend Channel Breakout |
| 4 | ADTRAN, Inc. | NASDAQ: ADTN | $20.56 | $20.70 | Symmetrical Triangle Pattern Breakout |
| 5 | ADC Therapeutics SA | NYSE: ADCT | $10.31 | $11.60 | Downtrend Channel Breakout |
| 6 | iRhythm Technologies, Inc. | NASDAQ: IRTC | $141.72 | $146.40 | Flag Pattern |
| 7 | Ares Capital Corporation | NASDAQ: ARCC | $19.02 | $19.70 | Downtrend Channel |
| 8 | Lucid Group, Inc. | NASDAQ: LCID | $19.99 | $20.50 | Falling Wedge Pattern Breakout |
| 9 | Chewy, Inc. | NYSE: CHWY | $44.13 | $45.90 | Downtrend Channel Breakout |
| 10 | Seritage Growth Properties | NYSE: SRG | $10.96 | $12.40 | Downtrend Channel |
Important: Typically, these trades offer a risk: reward ratio of 1:2 or 1:3 in the next 6 months, which implies 2x to 3x rewards when compared to risks. So, be sure to set your stop-loss levels and target prices accordingly to manage your risk. In addition, these trade ideas are triggered using daily closing prices, not intra-day pricing. So, if you participate in these trades, make sure that you only buy the stock once its daily close is above the recommended price level.
That said, here are the top 10 stocks to watch for a breakout, in no particular order.
#1 Beyond Meat, Inc. (NASDAQ: BYND)
Sector: Consumer Defensive | Packaged Foods
Reason: Downtrend Channel Breakout
A downtrend or descending channel is the price action contained between downward sloping parallel lines. It is formed by two lines that are drawn by connecting the lower highs and lower lows of a stock’s price. Even though this is typically a bearish pattern, a breakout from the upper rail of this pattern is considered a good bullish indication.
Buy Level(s): The daily chart shows that the stock has currently broken out of a downtrend channel. However, there is a near-term resistance level for the stock. Hence, the ideal buy level for BYND is if the stock has a daily close above $35.30. This is marked in the chart below as a green color dotted line.
Daily chart – BYND
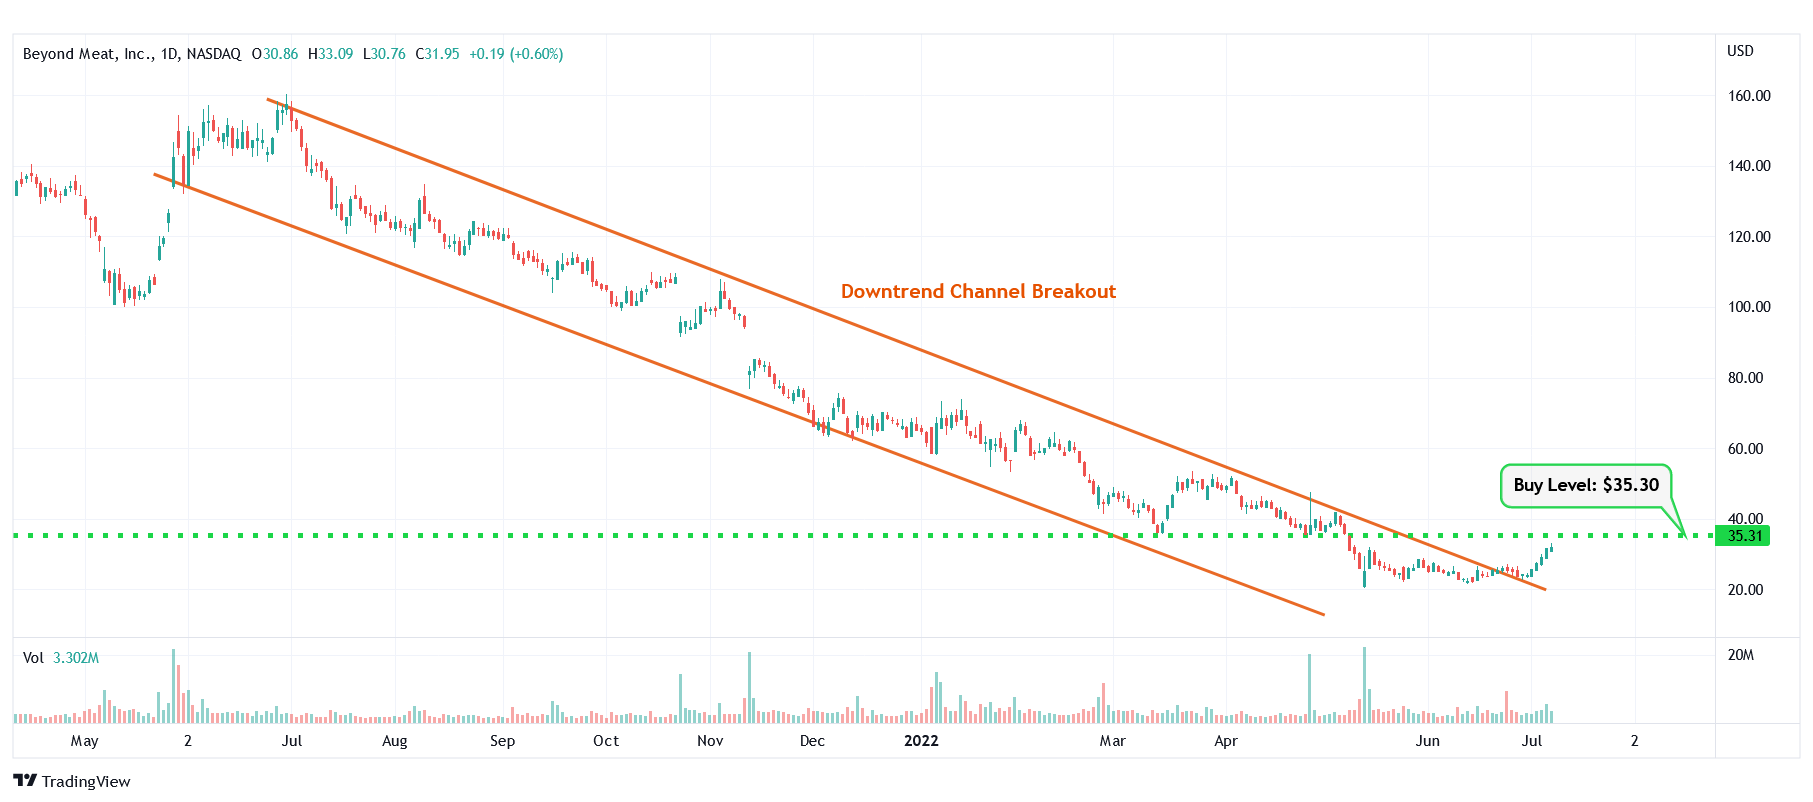
BYND -Downtrend Channel Breakout
#2 Crocs, Inc. (NASDAQ: CROX)
Sector: Consumer Cyclical | Footwear & Accessories
Reason: Falling Wedge Pattern Breakout
A falling wedge pattern is formed by joining two downward-sloping, converging trendlines having a contracting range. The pattern appears to be wide at the top and continues to contract as prices fall. A breakout from a falling wedge pattern can indicate either reversal or continuation depending on where the pattern appeared in the trend.
A stock that has broken out of a falling wedge pattern would have gained momentum and would have the potential to move higher.
Buy Level(s): The stock has currently broken out of a falling wedge pattern. However, the ideal buy level for CROX is above the nearest resistance level of $62.10. This is marked in the chart below as a green color dotted line.
Daily chart – CROX
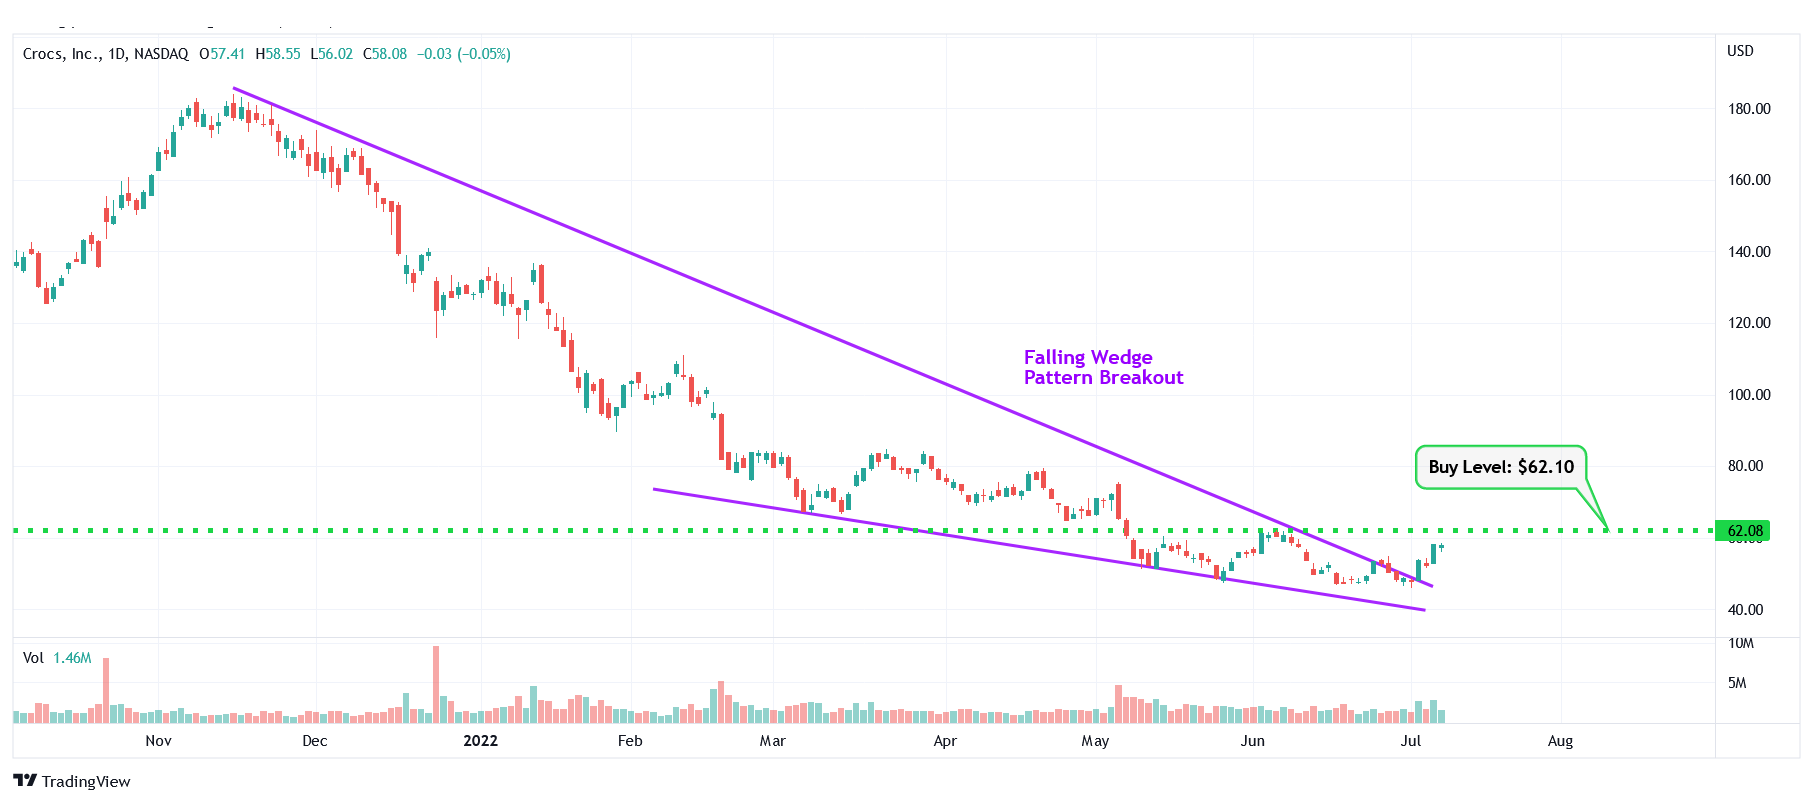
CROX – Falling Wedge Pattern Breakout
#3 Novavax, Inc. (NASDAQ: NVAX)
Sector: Healthcare | Biotechnology
Reason: Downtrend Channel Breakout
A downtrend or descending channel is the price action contained between downward sloping parallel lines. It is formed by two lines that are drawn by connecting the lower highs and lower lows of a stock’s price. Even though this is typically a bearish pattern, a breakout from the upper rail of this pattern is considered a good bullish indication.
Buy Level(s): The daily chart shows that the stock has currently broken out of a downtrend channel. However, there is a near-term resistance level for the stock. Hence, the ideal buy level for NVAX is if the stock has a daily close above $76.50. This is marked in the chart below as a green color dotted line.
Daily chart – NVAX
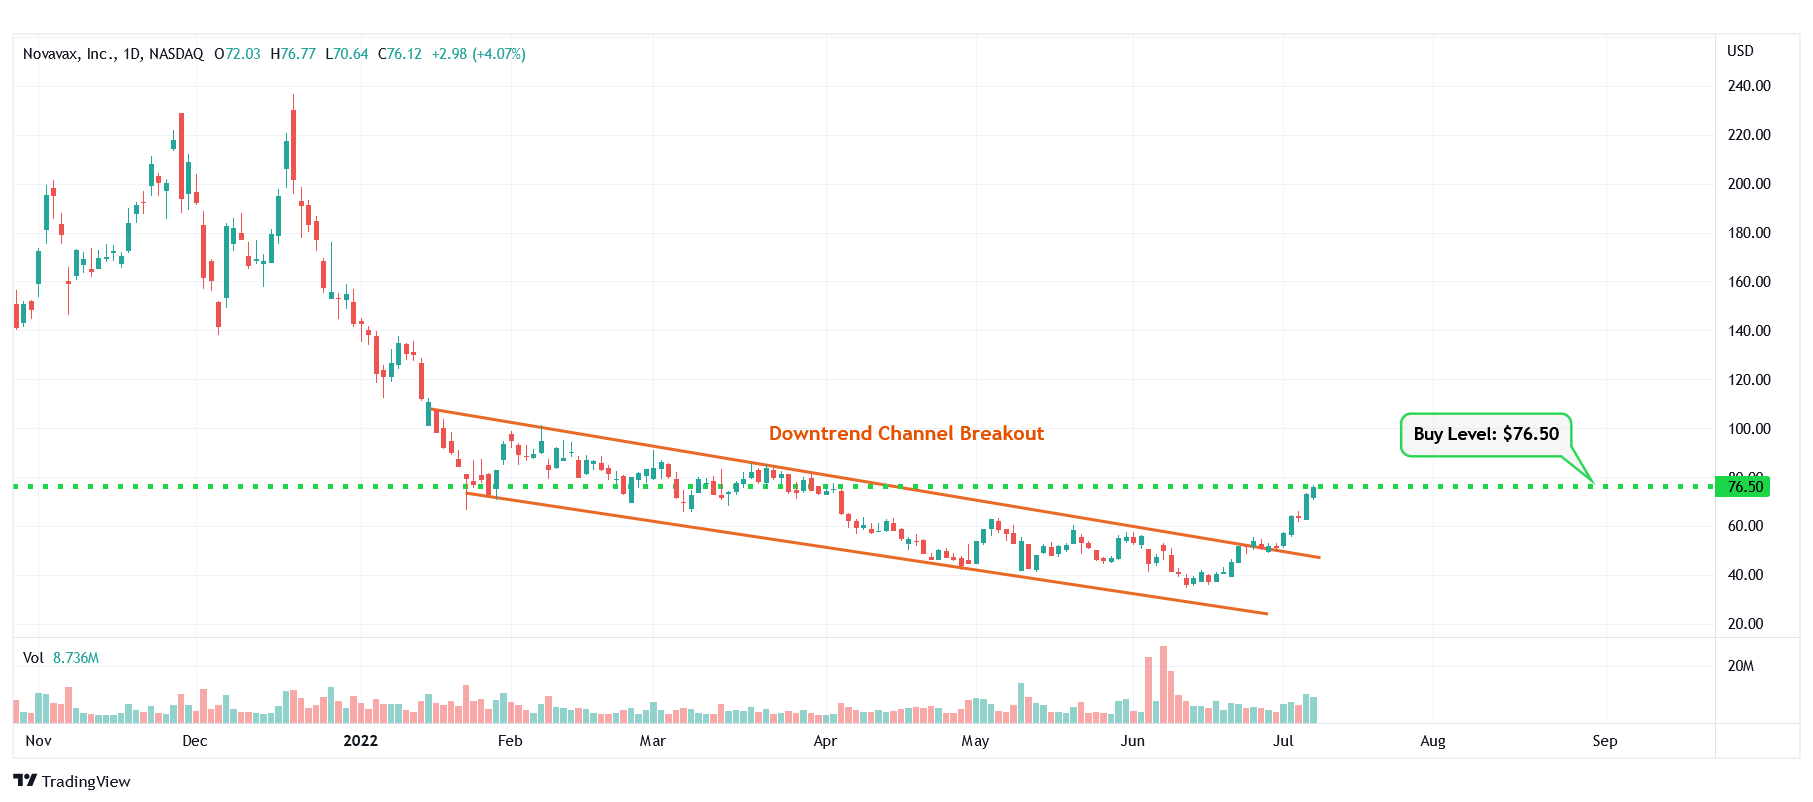
NVAX – Downtrend Channel Breakout
#4 ADTRAN, Inc. (NASDAQ: ADTN)
Sector: Technology | Communication Equipment
Reason: Symmetrical Triangle Pattern Breakout
A symmetrical triangle is a chart pattern formed by two converging trend lines connecting a series of sequential peaks and troughs. These two lines result in the formation of a triangle that appears to be symmetrical.
A symmetrical triangle pattern is usually formed when there is indecision in the price movements and there is uncertainty among the buyers and sellers. This chart pattern represents a period of consolidation before the price breaks out or breaks down. In case a breakout occurs from the upper trend line, it is a strong bullish indication as it signifies the start of a new bullish trend.
Buy Level(s): The stock has currently broken out of a symmetrical triangle pattern. However, the ideal buy level for ADTN is if the stock closes above the immediate resistance level of $20.70. This is marked in the chart below as a green color dotted line.
Daily chart – ADTN
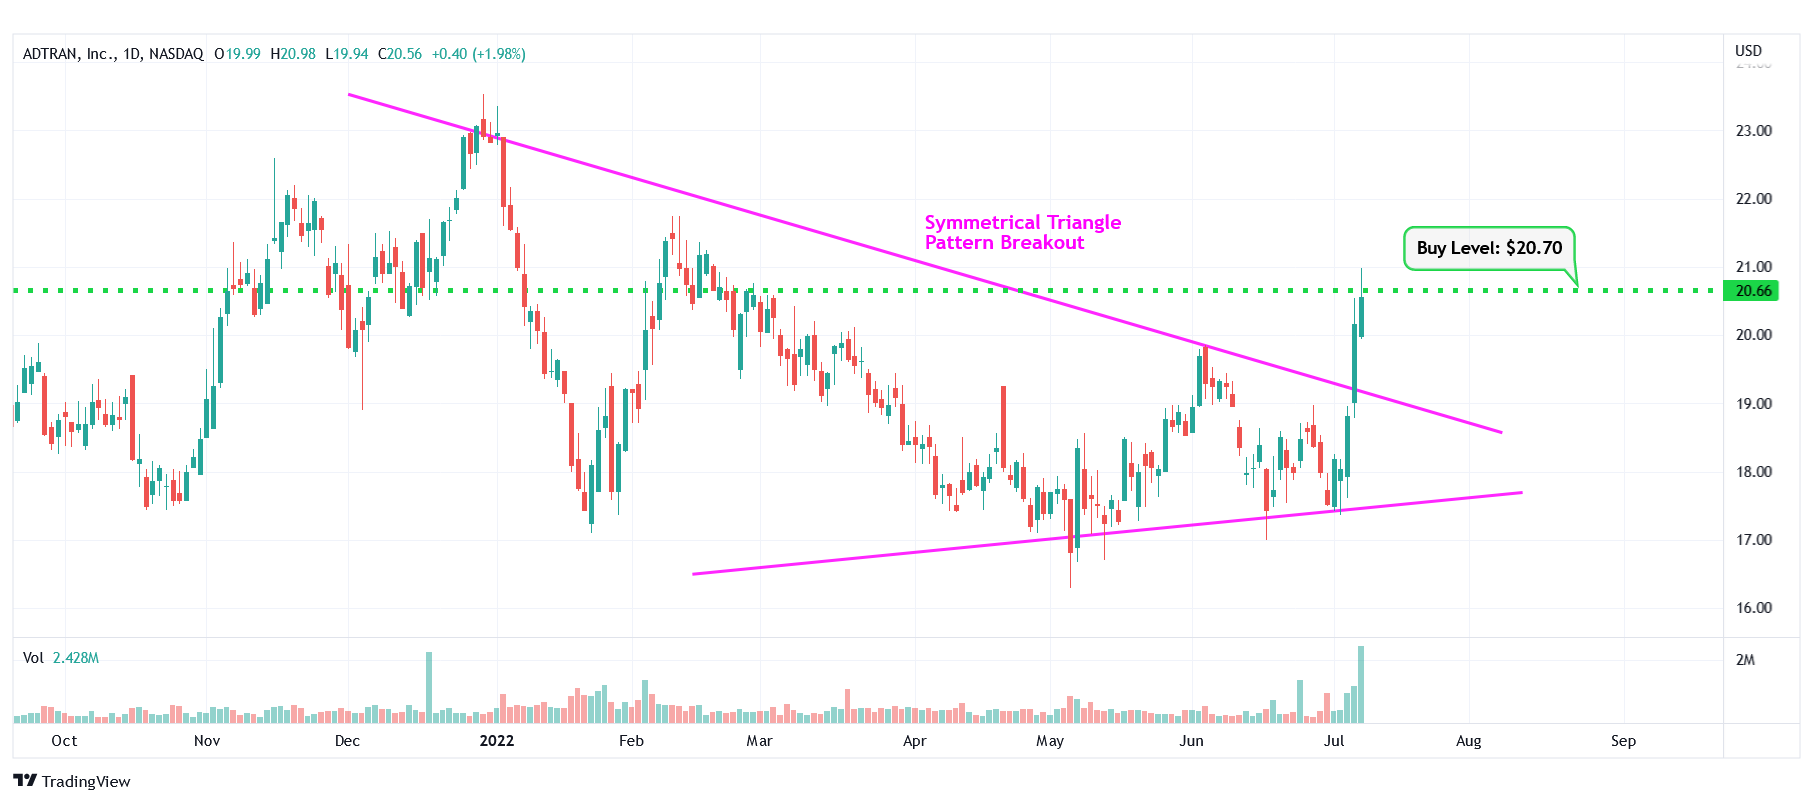
ADTN – Symmetrical Triangle Pattern Breakout
#5 ADC Therapeutics SA (NYSE: ADCT)
Sector: Healthcare | Biotechnology
Reason: Downtrend Channel Breakout
A downtrend or descending channel is the price action contained between downward sloping parallel lines. It is formed by two lines that are drawn by connecting the lower highs and lower lows of a stock’s price. Even though this is typically a bearish pattern, a breakout from the upper rail of this pattern is considered a good bullish indication.
Buy Level(s): The daily chart shows that the stock has currently broken out of a downtrend channel. However, there is a near-term resistance level for the stock. Hence, the ideal buy level for ADCT is if the stock has a daily close above $11.60. This is marked in the chart below as a green color dotted line.
Daily chart – ADCT

ADCT – Downtrend Channel Breakout
#6 iRhythm Technologies, Inc. (NASDAQ: IRTC)
Sector: Healthcare | Medical Instruments & Supplies
Reason: Formation of a Flag Pattern
A flag pattern is a short-term continuation pattern that marks a small consolidation before the previous move resumes. The pattern is formed when the market consolidates in a narrow range after a sharp move. For a stock in an uptrend, a breakout from this pattern is typically a strong bullish indication.
Buy Level(s): The ideal buy level for IRTC is if the stock breaks out of the flag pattern, at around $146.40. This is marked in the chart below as a green color dotted line.
Daily chart – IRTC
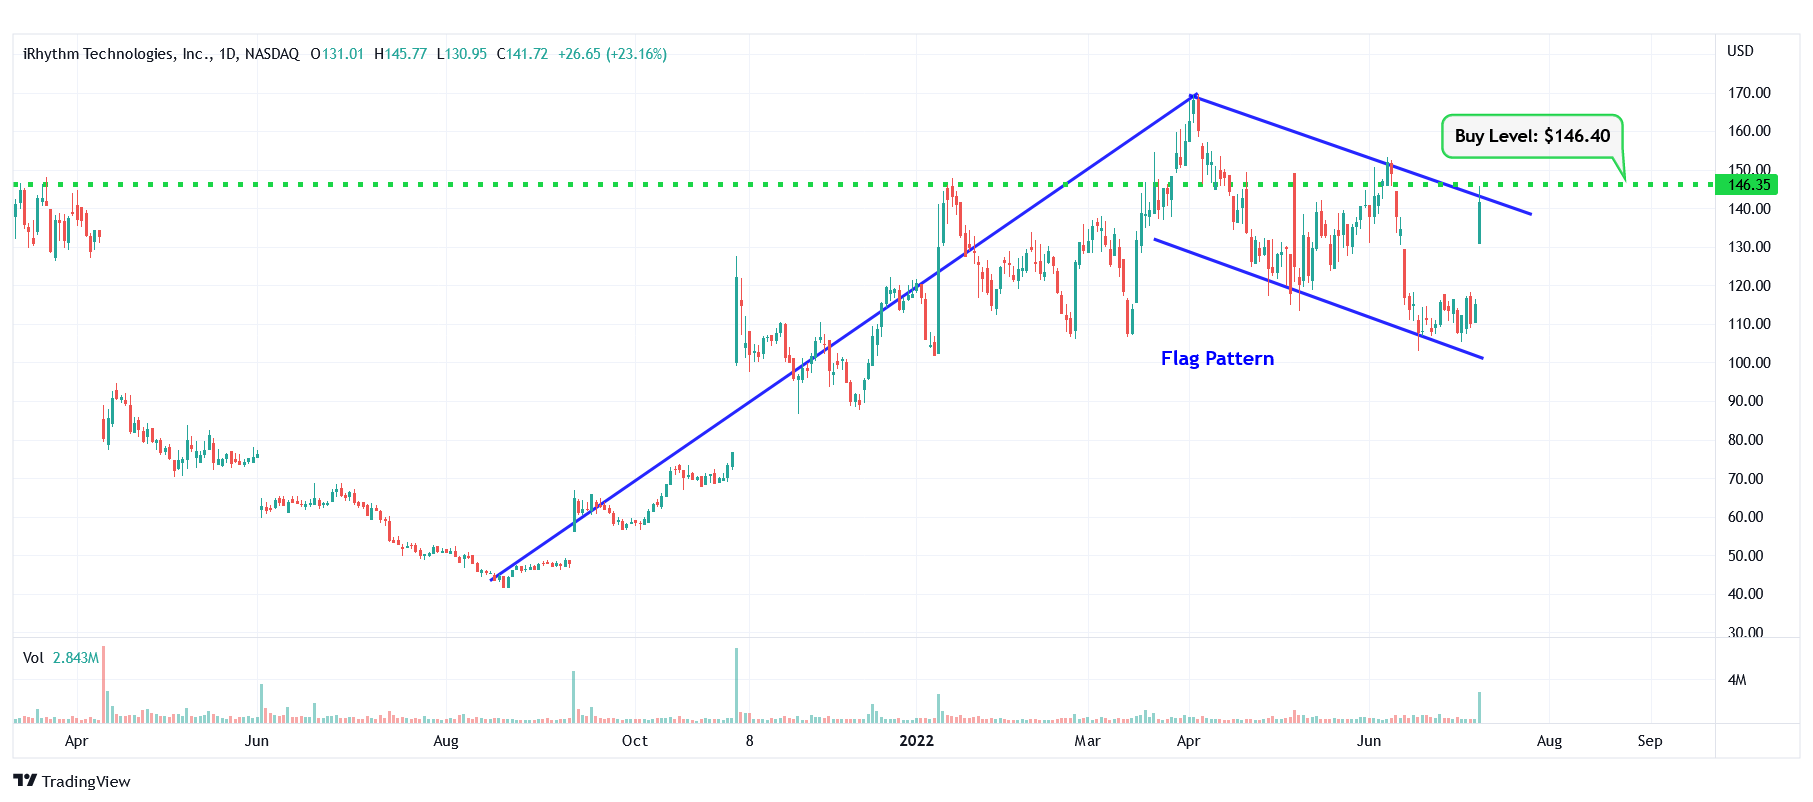
IRTC – Flag Pattern
#7 Ares Capital Corporation (NASDAQ: ARCC)
Sector: Financial | Asset Management
Reason: Formation of a Downtrend Channel
A downtrend or descending channel is the price action contained between downward sloping parallel lines. It is formed by two lines that are drawn by connecting the lower highs and lower lows of a stock’s price. Even though this is typically a bearish pattern, a breakout from the upper rail of this pattern is considered a good bullish indication.
Buy Level(s): The daily chart shows that the stock is currently forming a downtrend channel. The ideal buy level for ARCC is if the stock breaks out of the downtrend channel and has a daily close above $19.70. This is marked in the chart below as a green color dotted line.
Daily chart – ARCC
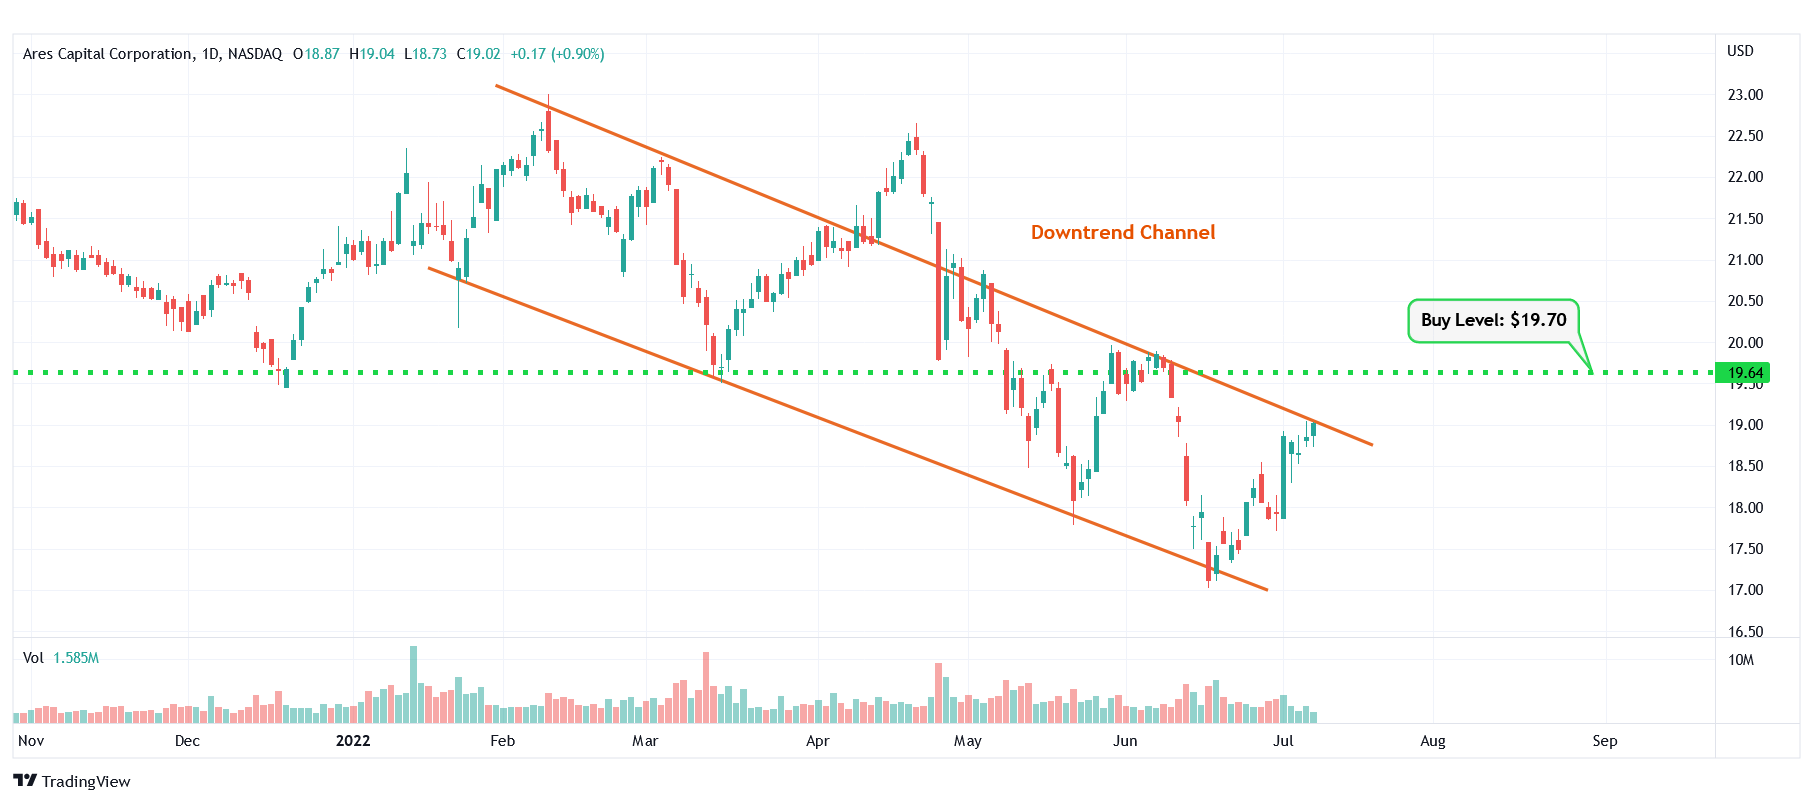
ARCC – Downtrend Channel
#8 Lucid Group, Inc. (NASDAQ: LCID)
Sector: Consumer Cyclical | Auto Manufacturers
Reason: Falling Wedge Pattern Breakout
A falling wedge pattern is formed by joining two downward-sloping, converging trendlines having a contracting range. The pattern appears to be wide at the top and continues to contract as prices fall. A breakout from a falling wedge pattern can indicate either reversal or continuation depending on where the pattern appeared in the trend.
A stock that has broken out of a falling wedge pattern would have gained momentum and would have the potential to move higher.
Buy Level(s): The stock has currently broken out of a falling wedge pattern. However, the ideal buy level for LCID is above the nearest resistance level of $20.50. This is marked in the chart below as a green color dotted line.
Daily chart – LCID
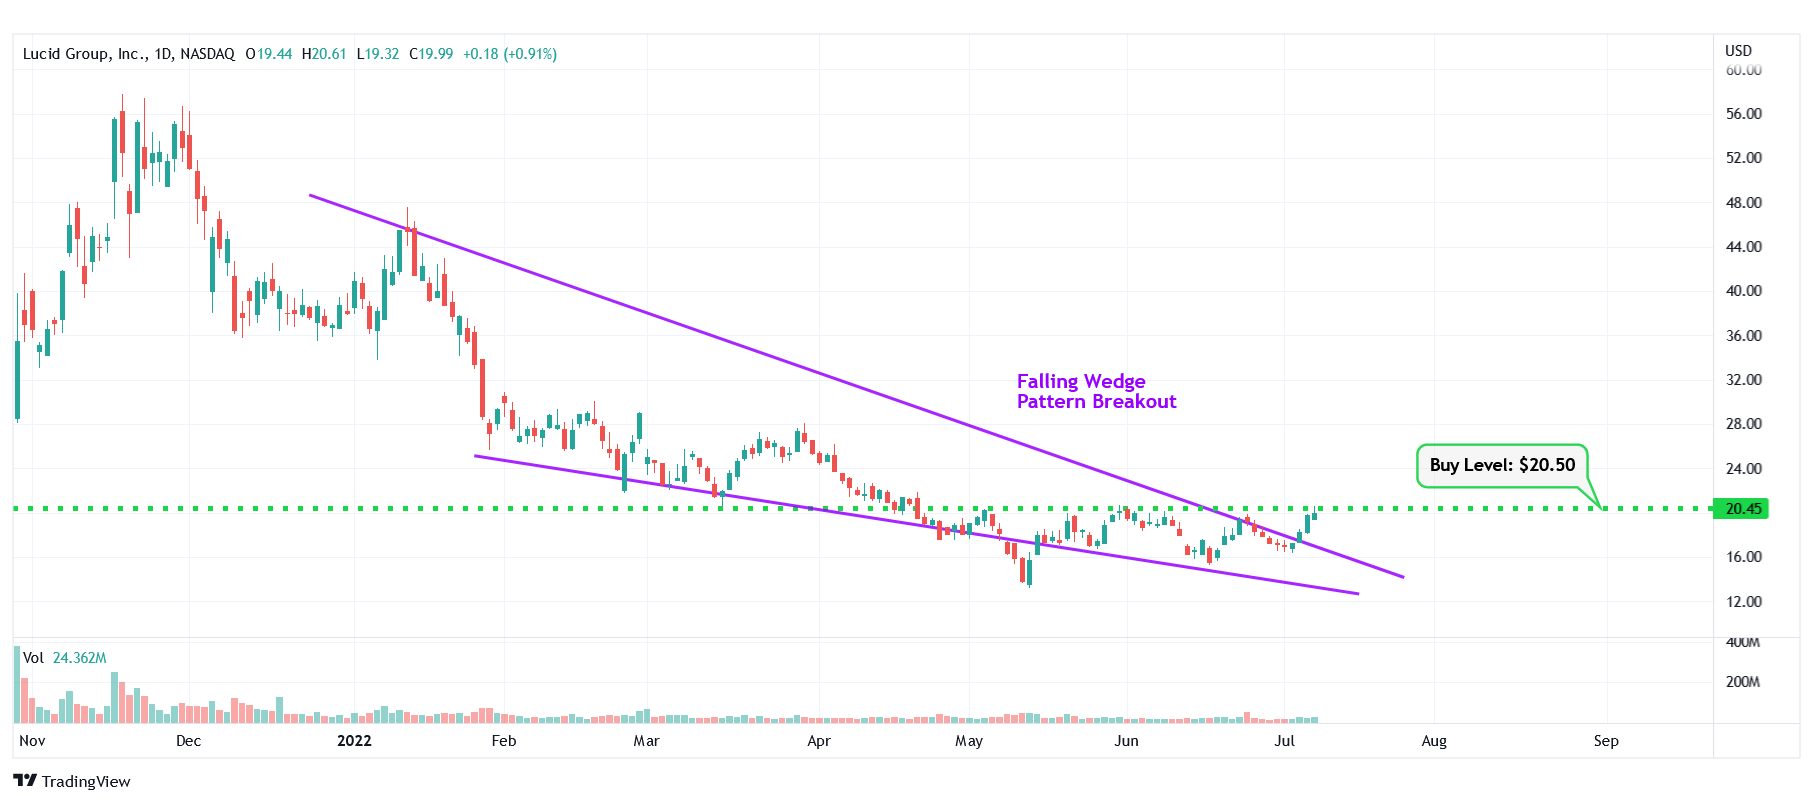
LCID – Falling Wedge Pattern Breakout
#9 Chewy, Inc. (NYSE: CHWY)
Sector: Consumer Cyclical | Internet Retail
Reason: Downtrend Channel Breakout
A downtrend or descending channel is the price action contained between downward sloping parallel lines. It is formed by two lines that are drawn by connecting the lower highs and lower lows of a stock’s price. Even though this is typically a bearish pattern, a breakout from the upper rail of this pattern is considered a good bullish indication.
Buy Level(s): The daily chart shows that the stock has currently broken out of a downtrend channel. However, there is a near-term resistance level for the stock. Hence, the ideal buy level for CHWY is if the stock has a daily close above $45.90. This is marked in the chart below as a green color dotted line.
Daily chart – CHWY
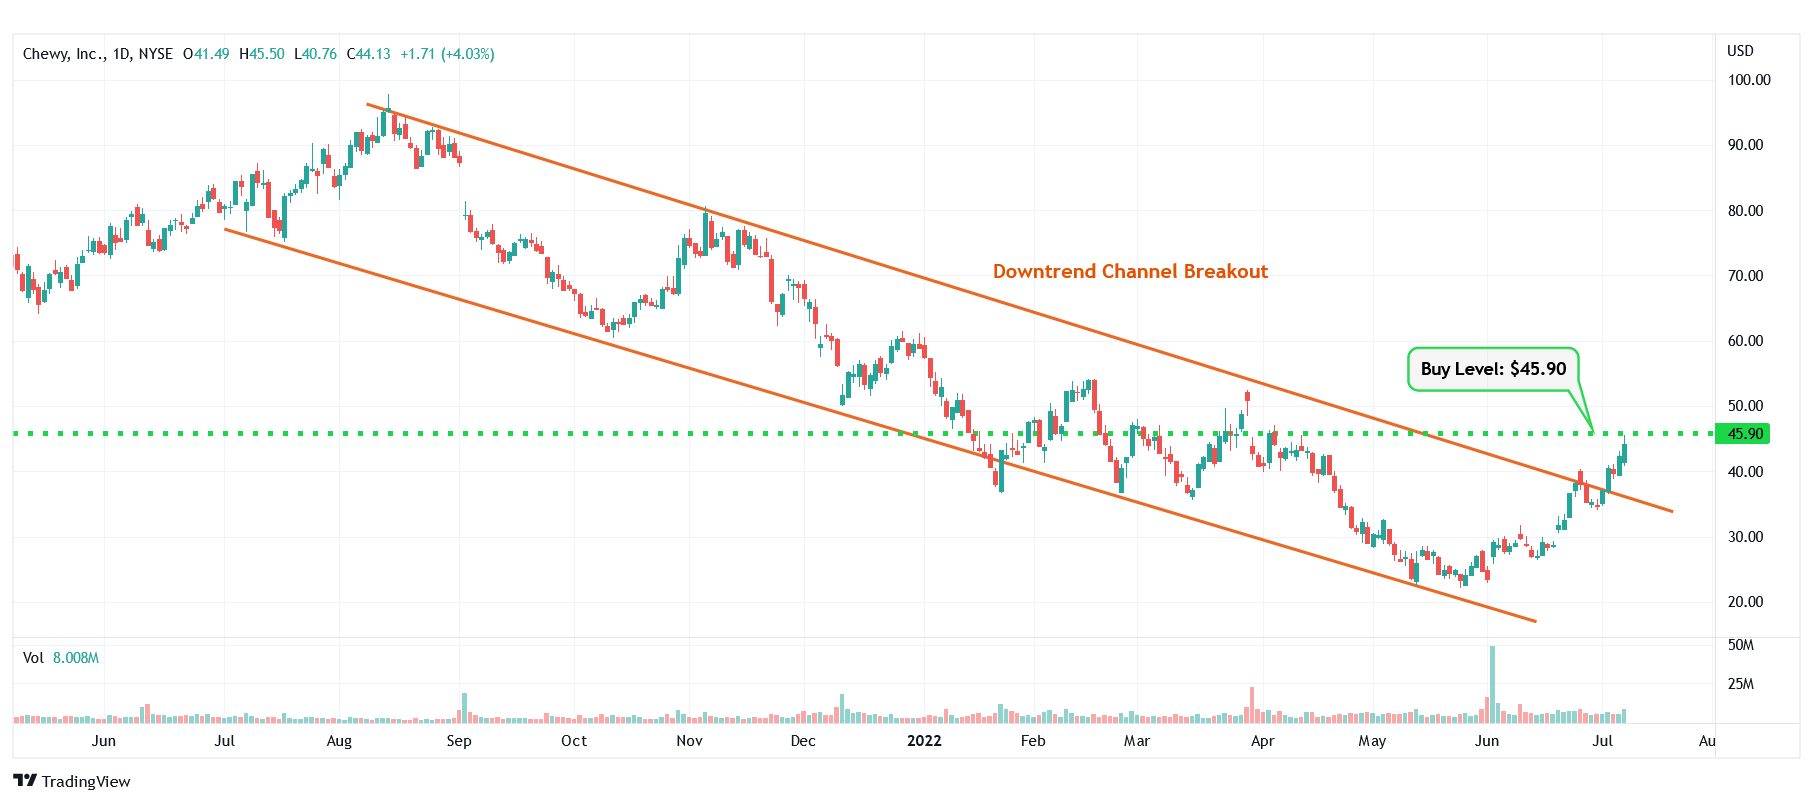
CHWY – Downtrend Channel Breakout
#10 Seritage Growth Properties (NYSE: SRG)
Sector: Real Estate | REIT – Retail
Reason: Formation of a Downtrend Channel
A downtrend or descending channel is the price action contained between downward sloping parallel lines. It is formed by two lines that are drawn by connecting the lower highs and lower lows of a stock’s price. Even though this is typically a bearish pattern, a breakout from the upper rail of this pattern is considered a good bullish indication.
Buy Level(s): The daily chart shows that the stock is currently forming a downtrend channel. The ideal buy level for SRG is if the stock breaks out of the downtrend channel and has a daily close above $12.40. This is marked in the chart below as a green color dotted line.
Daily chart – SRG
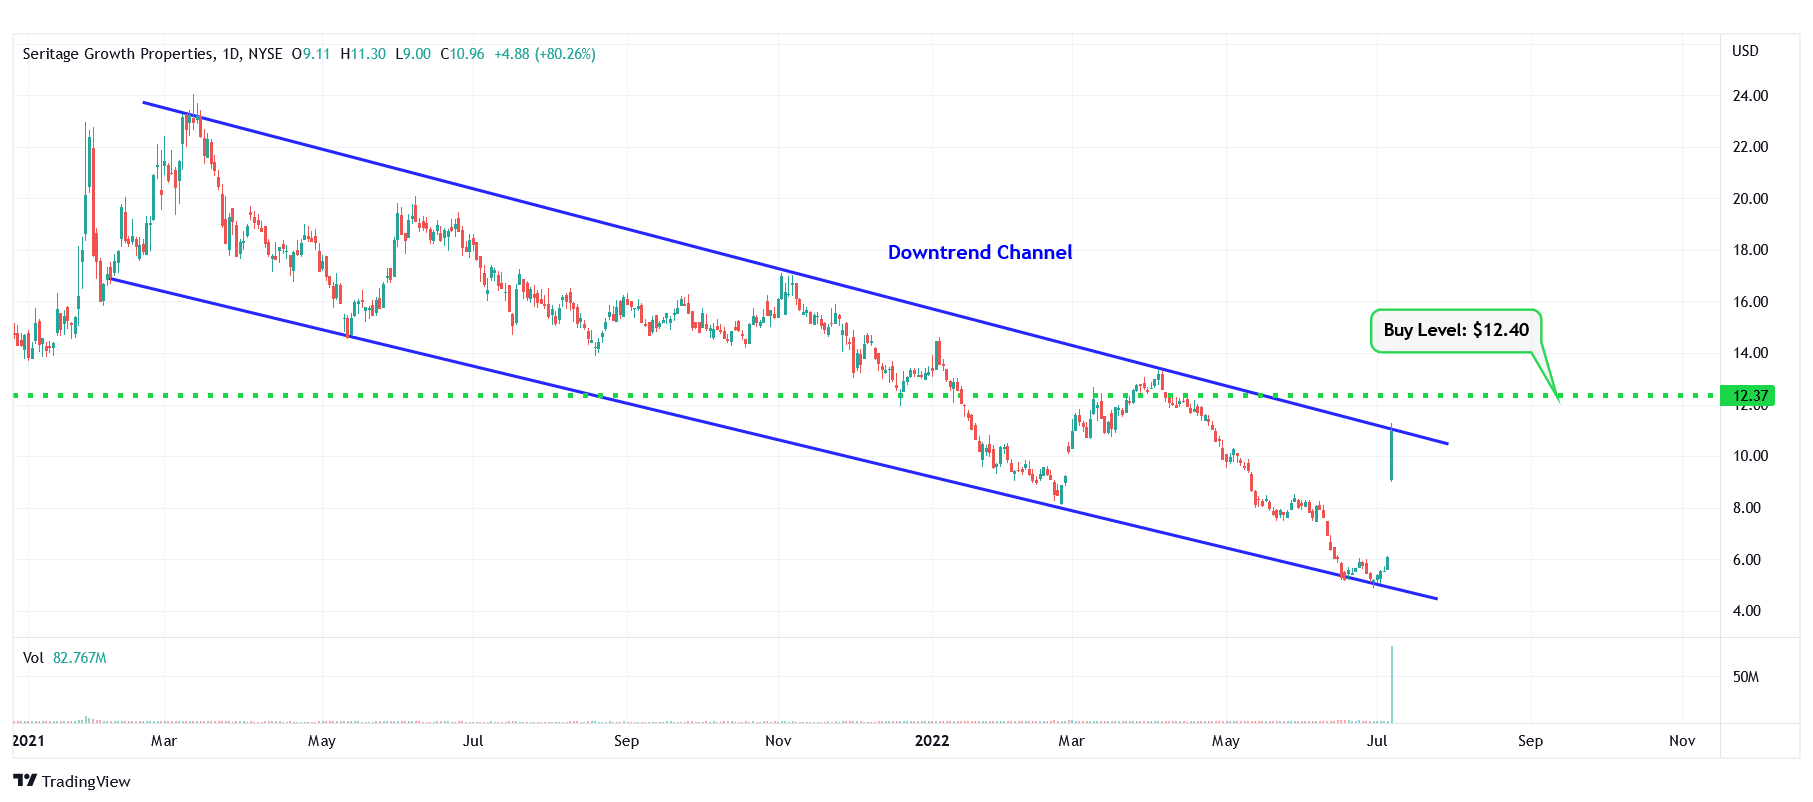
SRG – Downtrend Channel
Happy Trading!
Trades of The Day Research Team
Motley Fool Stock Advisor's average stock pick is up over 350%*, beating the market by an incredible 4-1 margin. Here’s what you get if you join up with us today: Two new stock recommendations each month. A short list of Best Buys Now. Stocks we feel present the most timely buying opportunity, so you know what to focus on today. There's so much more, including a membership-fee-back guarantee. New members can join today for only $99/year.
Source: Trades of the Day
