
Picking a winning trade on a consistent basis is not simply a stroke of luck. It’s the result of calculated screening, planning, and deliberation.
With this in mind, we have started a new weekly series on our top 10 stocks to watch this week — stocks that look poised for a possible breakout in the coming days. Traders should add these stocks to their watchlist now.
The Top 10 Stocks to Watch This Week for Possible Breakouts
| Sl # | Name of the Stock | Stock Ticker | Last Close | Buy Level(s) | Reason |
| 1 | Aurinia Pharmaceuticals Inc. | NASDAQ: AUPH | $11.39 | $12.90 | Falling Wedge Pattern |
| 2 | American Water Works Company, Inc. | NYSE: AWK | $153.43 | $157.00 | Downtrend Channel |
| 3 | Accel Entertainment, Inc. | NYSE: ACEL | $11.14 | $11.20 | Double Bottom Pattern |
| 4 | Etsy, Inc. | NASDAQ: ETSY | $79.81 | $88.00 | Falling Wedge Pattern Breakout |
| 5 | D.R. Horton, Inc. | NYSE: DHI | $70.09 | $71.30 | Downtrend Channel |
| 6 | Franklin Covey Co. | NYSE: FC | $47.13 | $49.30 | Flag Pattern Breakout |
| 7 | Hercules Capital, Inc. | NYSE: HTGC | $14.01 | $14.60 | Falling Wedge Pattern Breakout |
| 8 | General Mills, Inc. | NYSE: GIS | $75.79 | $75.90 | Uptrend Channel Breakout |
| 9 | Olink Holding AB | NASDAQ: OLK | $15.65 | $16.60 | Falling Wedge Pattern Breakout |
| 10 | International Money Express, Inc. | NASDAQ: IMXI | $21.77 | $21.90 | Downtrend Channel Breakout |
Important: Typically, these trades offer a risk: reward ratio of 1:2 or 1:3 in the next 6 months, which implies 2x to 3x rewards when compared to risks. So, be sure to set your stop-loss levels and target prices accordingly to manage your risk. In addition, these trade ideas are triggered using daily closing prices, not intra-day pricing. So, if you participate in these trades, make sure that you only buy the stock once its daily close is above the recommended price level.
That said, here are the top 10 stocks to watch for a breakout, in no particular order.
#1 Aurinia Pharmaceuticals Inc. (NASDAQ: AUPH)
Sector: Healthcare | Biotechnology
Reason: Formation of a Falling Wedge Pattern
A falling wedge pattern is formed by joining two downward-sloping, converging trendlines having a contracting range. The pattern appears to be wide at the top and continues to contract as prices fall. A breakout from a falling wedge pattern can indicate either reversal or continuation depending on where the pattern appeared in the trend.
A stock that has broken out of a falling wedge pattern would have gained momentum and would have the potential to move higher.
Buy Level(s): The ideal buy level for AUPH is if the stock breaks out of the falling wedge pattern, at a price of around $12.90. This is marked in the chart below as a green color dotted line.
Daily chart – AUPH
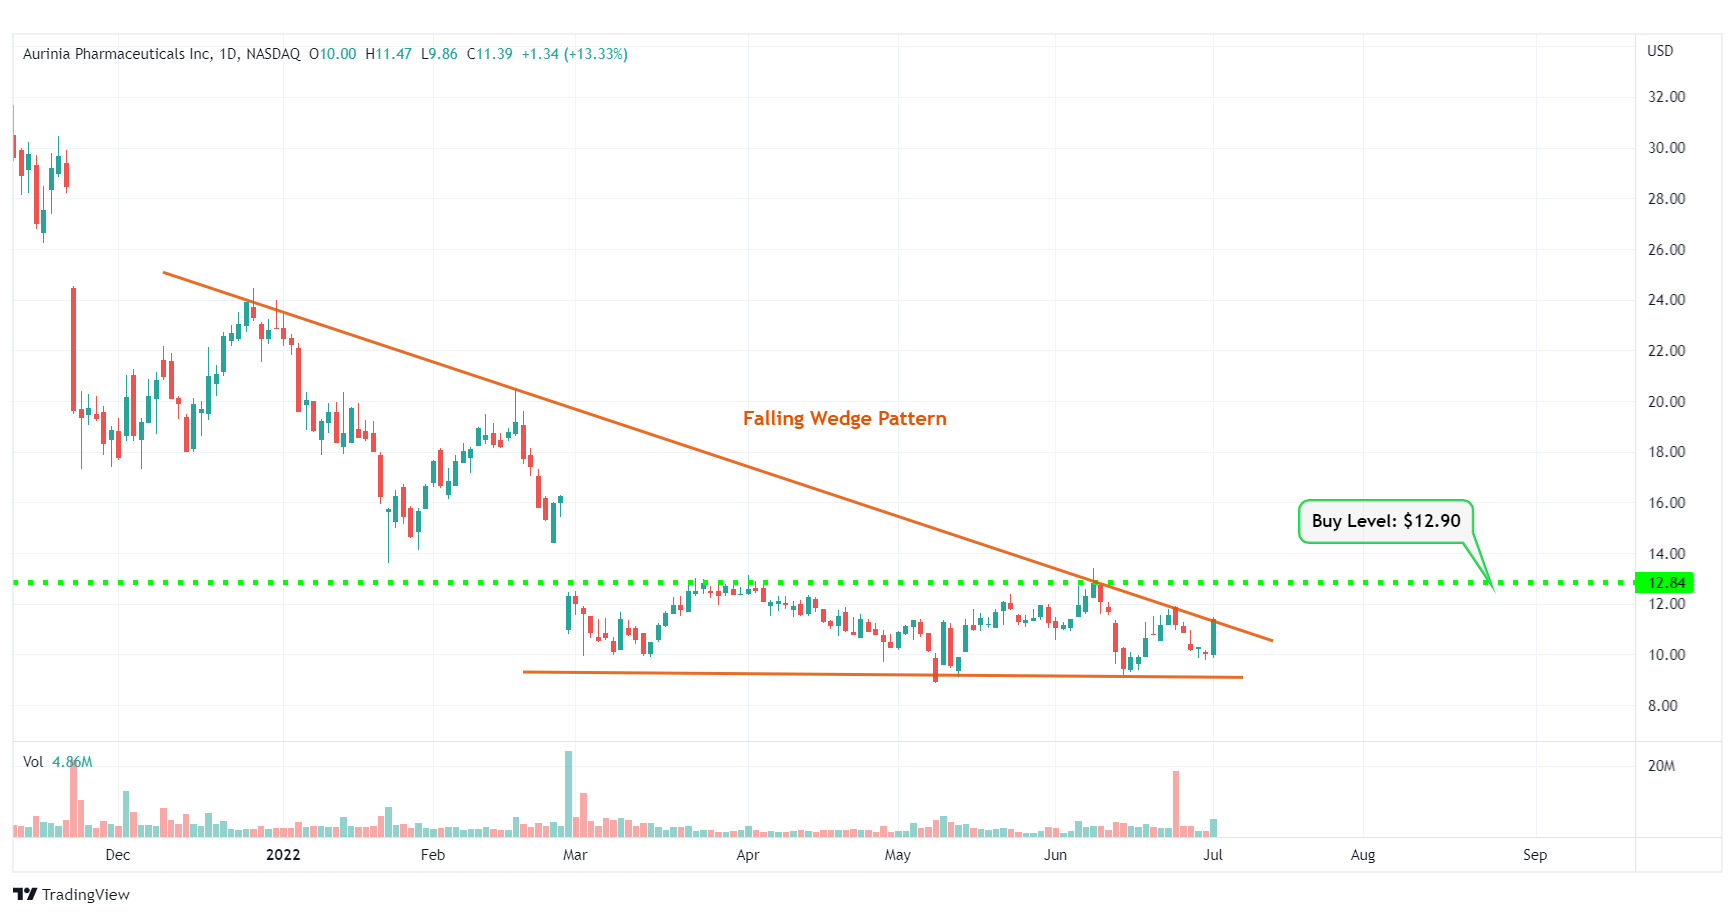
AUPH – Falling Wedge Pattern
#2 American Water Works Company, Inc. (NYSE: AWK)
Sector: Utilities | Utilities – Regulated Water
Reason: Formation of a Downtrend Channel
A downtrend or descending channel is the price action contained between downward sloping parallel lines. It is formed by two lines that are drawn by connecting the lower highs and lower lows of a stock’s price. Even though this is typically a bearish pattern, a breakout from the upper rail of this pattern is considered a good bullish indication.
Buy Level(s): The daily chart shows that the stock is currently forming a downtrend channel. The ideal buy level for AWK is if the stock breaks out of the downtrend channel and has a daily close above $157.00. This is marked in the chart below as a green color dotted line.
Daily chart – AWK

AWK – Downtrend Channel
#3 Accel Entertainment, Inc. (NYSE: ACEL)
Sector: Consumer Cyclical | Gambling
Reason: Formation of a Double Bottom Pattern
A Double Bottom Pattern looks like the letter W and is characterized by two well-defined lows at approximately the same price level. This twice-touched low is usually a very strong support level. The high point between the two bottoms’ resistance level is called the neckline. Once a breakout happens from this key price level (neckline), it signifies the start of a bullish move.
Buy Level(s): The stock currently looks poised for a breakout from the double bottom pattern. The ideal buy level for ACEL is above the near-term resistance level of around $11.20. This is marked in the chart below as a green color dotted line.
Daily chart – ACEL
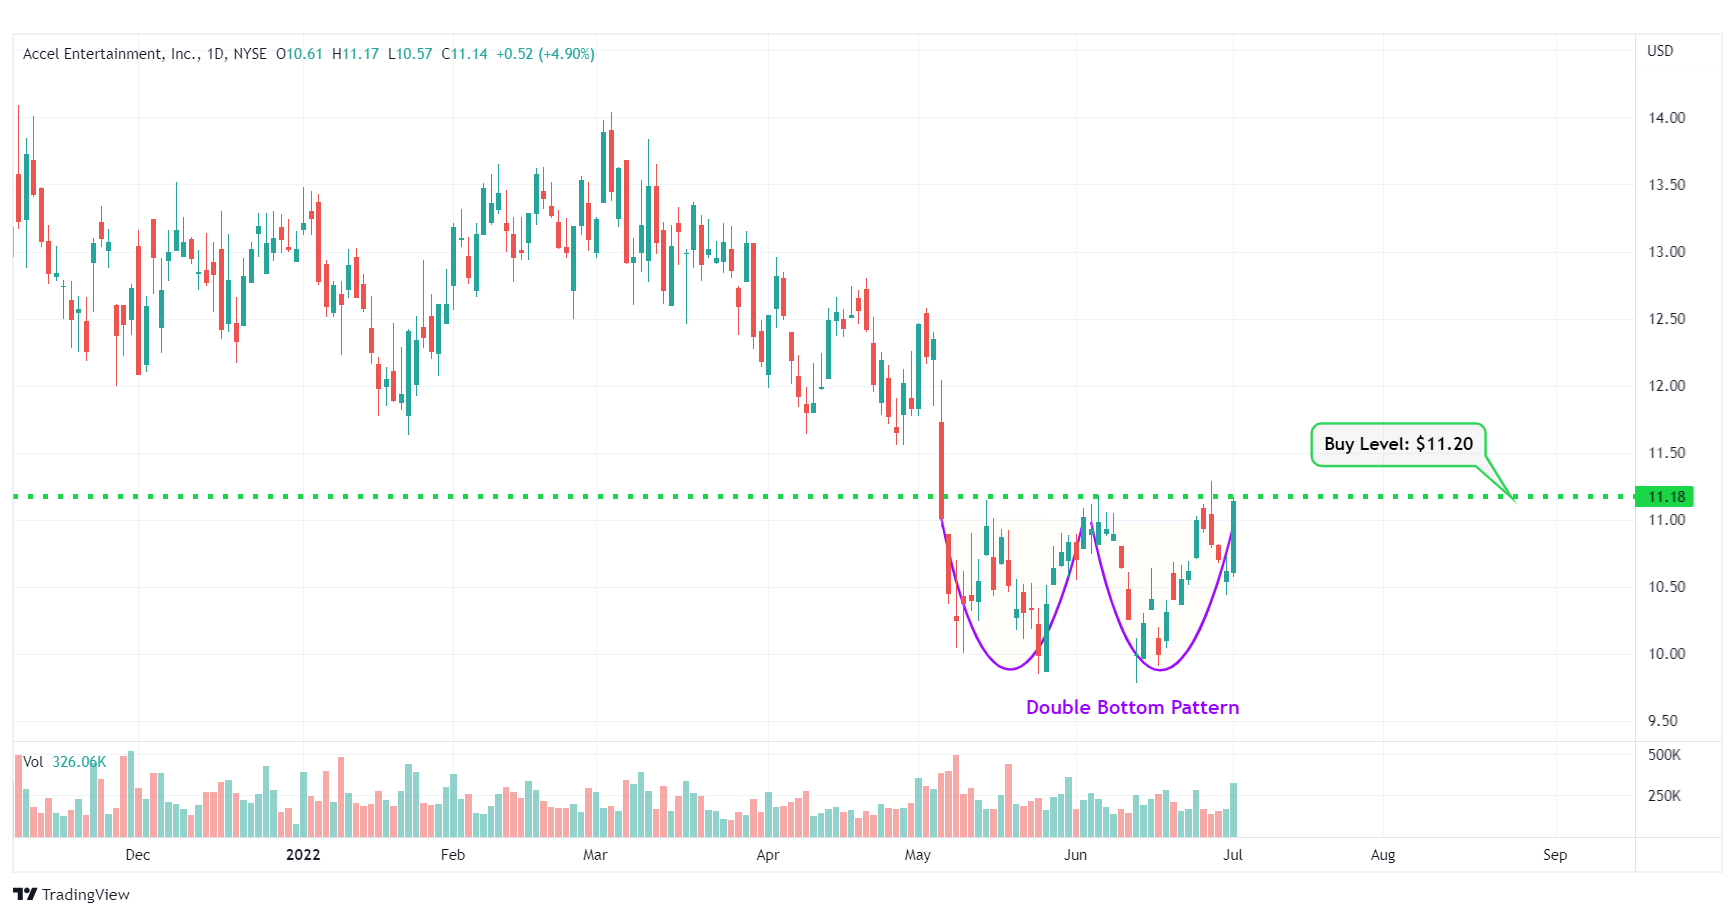
ACEL – Double Bottom Pattern
#4 Etsy, Inc. (NASDAQ: ETSY)
Sector: Consumer Cyclical | Internet Retail
Reason: Falling Wedge Pattern Breakout
A falling wedge pattern is formed by joining two downward-sloping, converging trendlines having a contracting range. The pattern appears to be wide at the top and continues to contract as prices fall. A breakout from a falling wedge pattern can indicate either reversal or continuation depending on where the pattern appeared in the trend.
A stock that has broken out of a falling wedge pattern would have gained momentum and would have the potential to move higher.
Buy Level(s): The stock has currently broken out of a falling wedge pattern. However, the ideal buy level for ETSY is above the nearest resistance level of $88.00. This is marked in the chart below as a green color dotted line.
Daily chart – ETSY
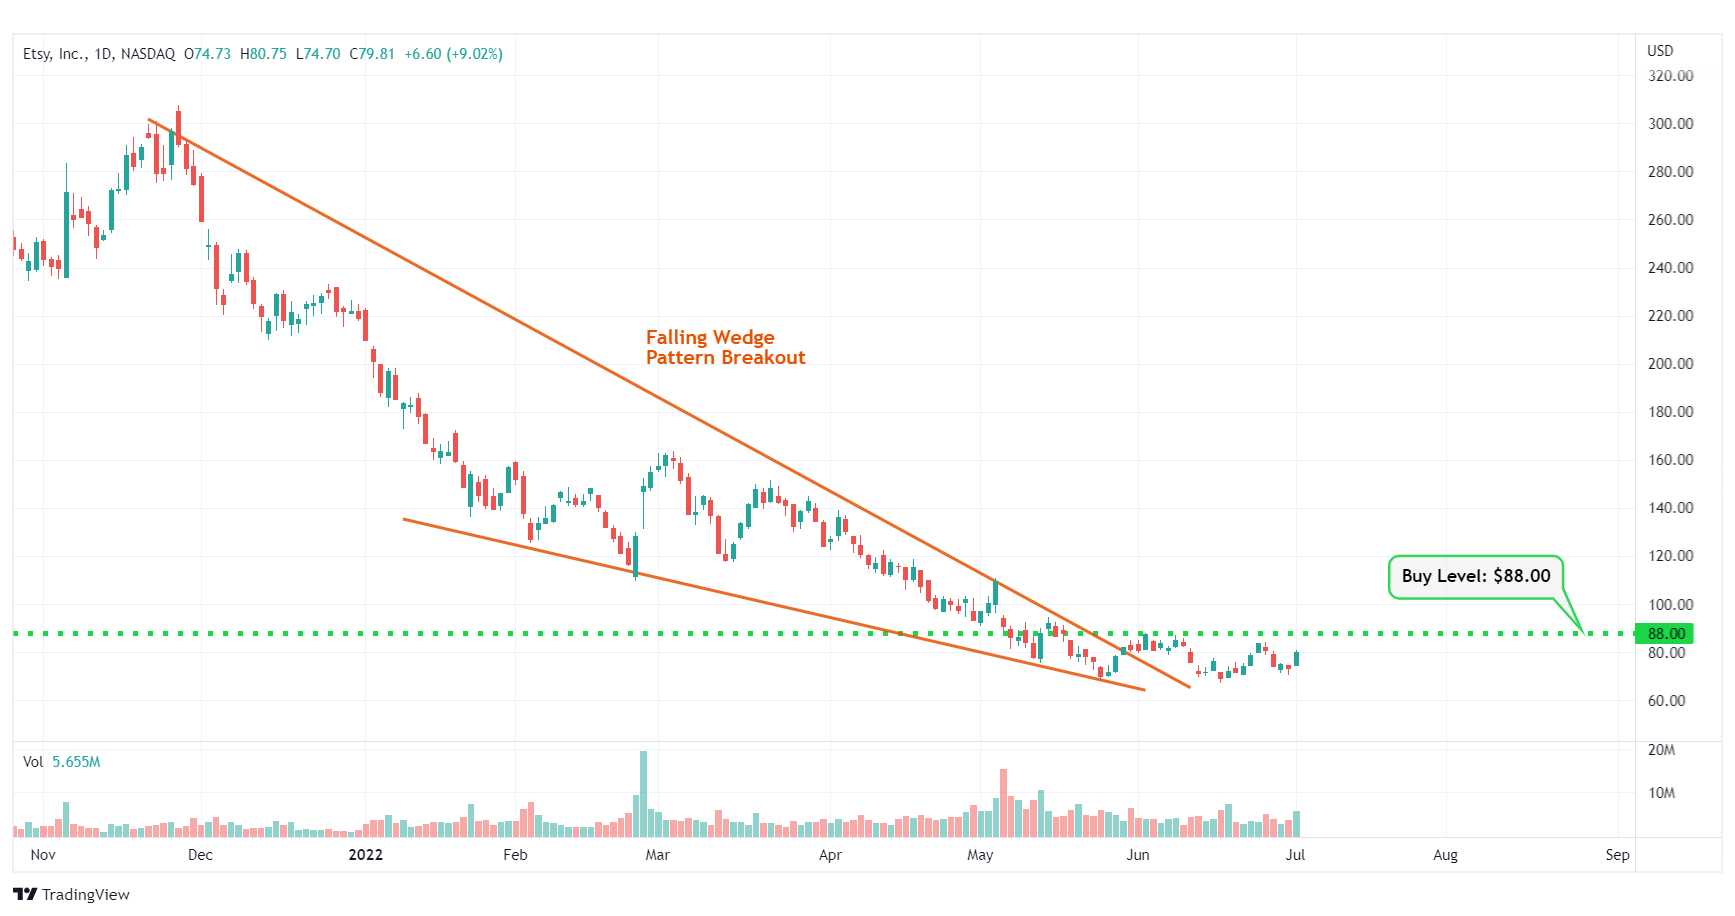
ETSY – Falling Wedge Pattern Breakout
#5 D.R. Horton, Inc. (NYSE: DHI)
Sector: Consumer Cyclical | Residential Construction
Reason: Formation of a Downtrend Channel
A downtrend or descending channel is the price action contained between downward sloping parallel lines. It is formed by two lines that are drawn by connecting the lower highs and lower lows of a stock’s price. Even though this is typically a bearish pattern, a breakout from the upper rail of this pattern is considered a good bullish indication.
Buy Level(s): The daily chart shows that the stock is currently forming a downtrend channel. The ideal buy level for DHI is if the stock breaks out of the downtrend channel and has a daily close above $71.30. This is marked in the chart below as a green color dotted line.
Daily chart – DHI
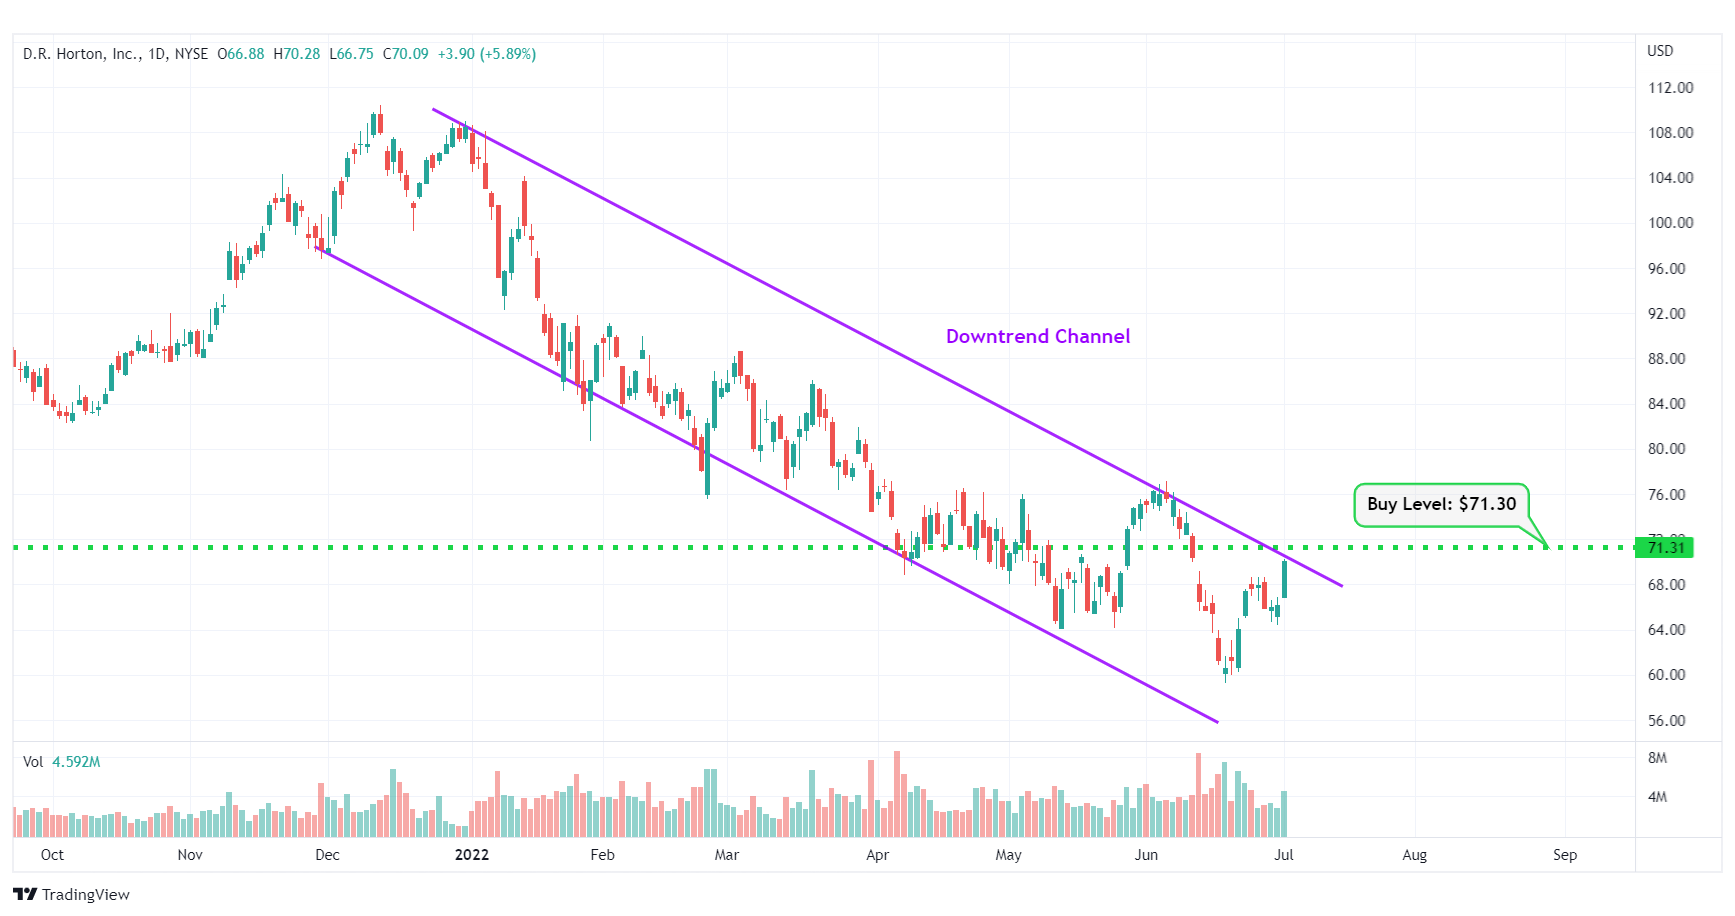
DHI – Downtrend Channel
#6 Franklin Covey Co. (NYSE: FC)
Sector: Industrials | Consulting Services
Reason: Breakout From a Flag Pattern
A flag pattern is a short-term continuation pattern that marks a small consolidation before the previous move resumes. The pattern is formed when the market consolidates in a narrow range after a sharp move. For a stock in an uptrend, a breakout from this pattern is typically a strong bullish indication.
Buy Level(s): Although the stock has currently broken out of the flag pattern, the ideal buy level for FC is above the near-term resistance level of $49.30. This is marked in the chart below as a green color dotted line.
Daily chart – FC
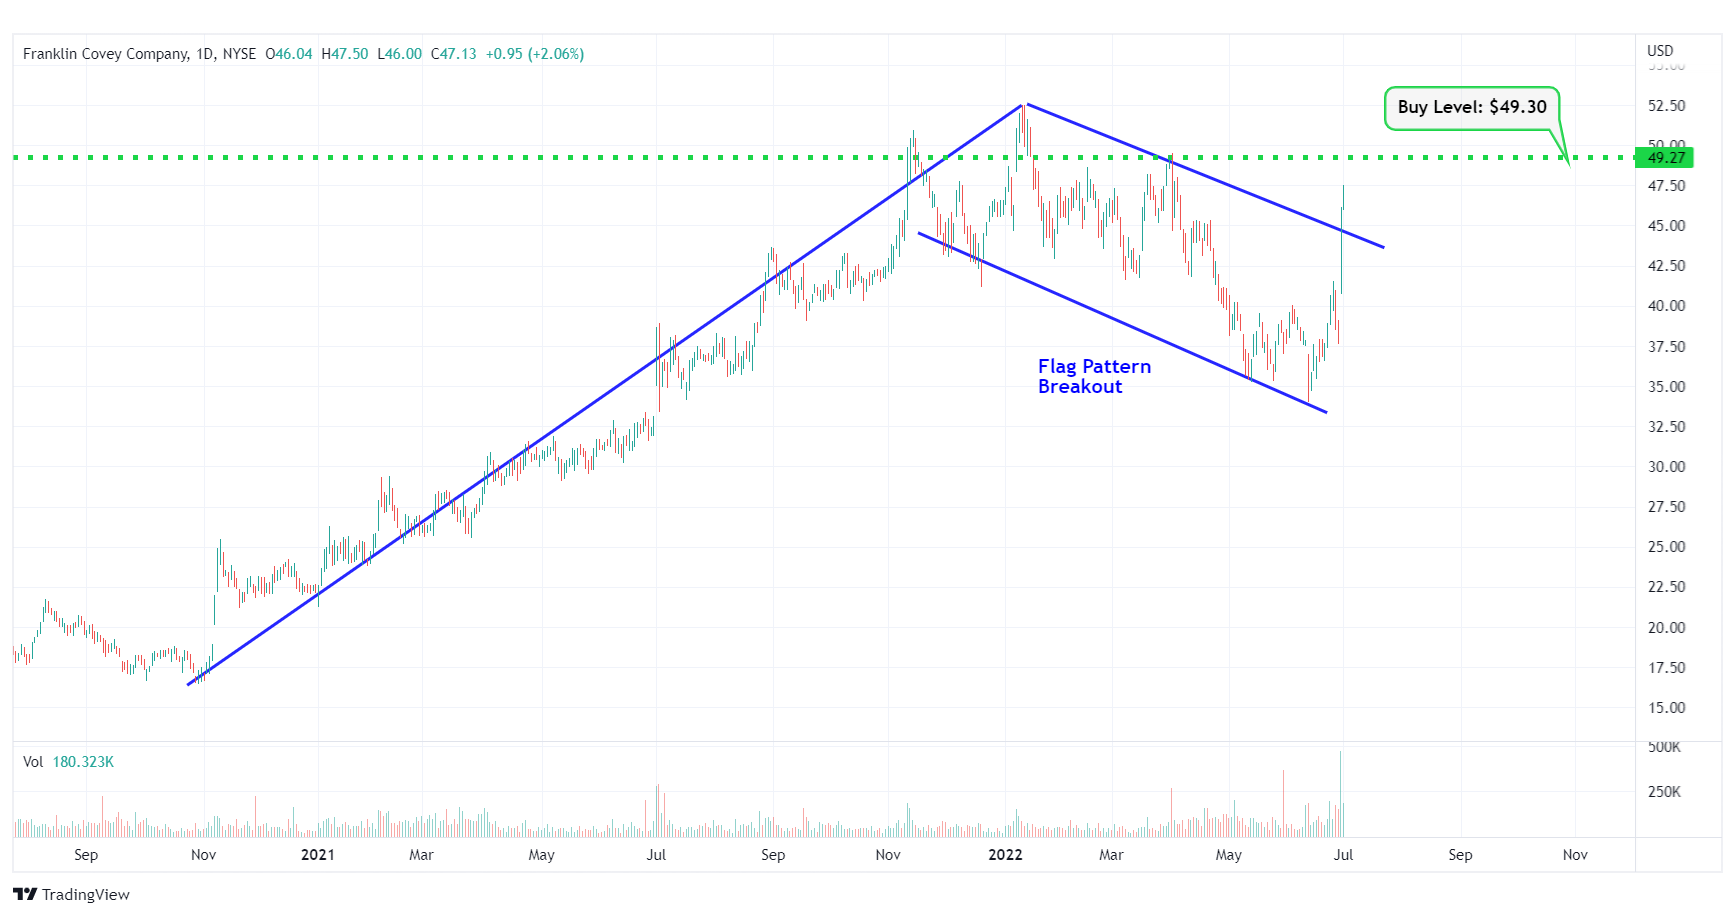
FC – Flag Pattern Breakout
#7 Hercules Capital, Inc. (NYSE: HTGC)
Sector: Financial | Mortgage Finance
Reason: Falling Wedge Pattern Breakout
A falling wedge pattern is formed by joining two downward-sloping, converging trendlines having a contracting range. The pattern appears to be wide at the top and continues to contract as prices fall. A breakout from a falling wedge pattern can indicate either reversal or continuation depending on where the pattern appeared in the trend.
A stock that has broken out of a falling wedge pattern would have gained momentum and would have the potential to move higher.
Buy Level(s): The stock has currently broken out of a falling wedge pattern. However, the ideal buy level for HTGC is above the nearest resistance level of $14.60. This is marked in the chart below as a green color dotted line.
Daily chart – HTGC
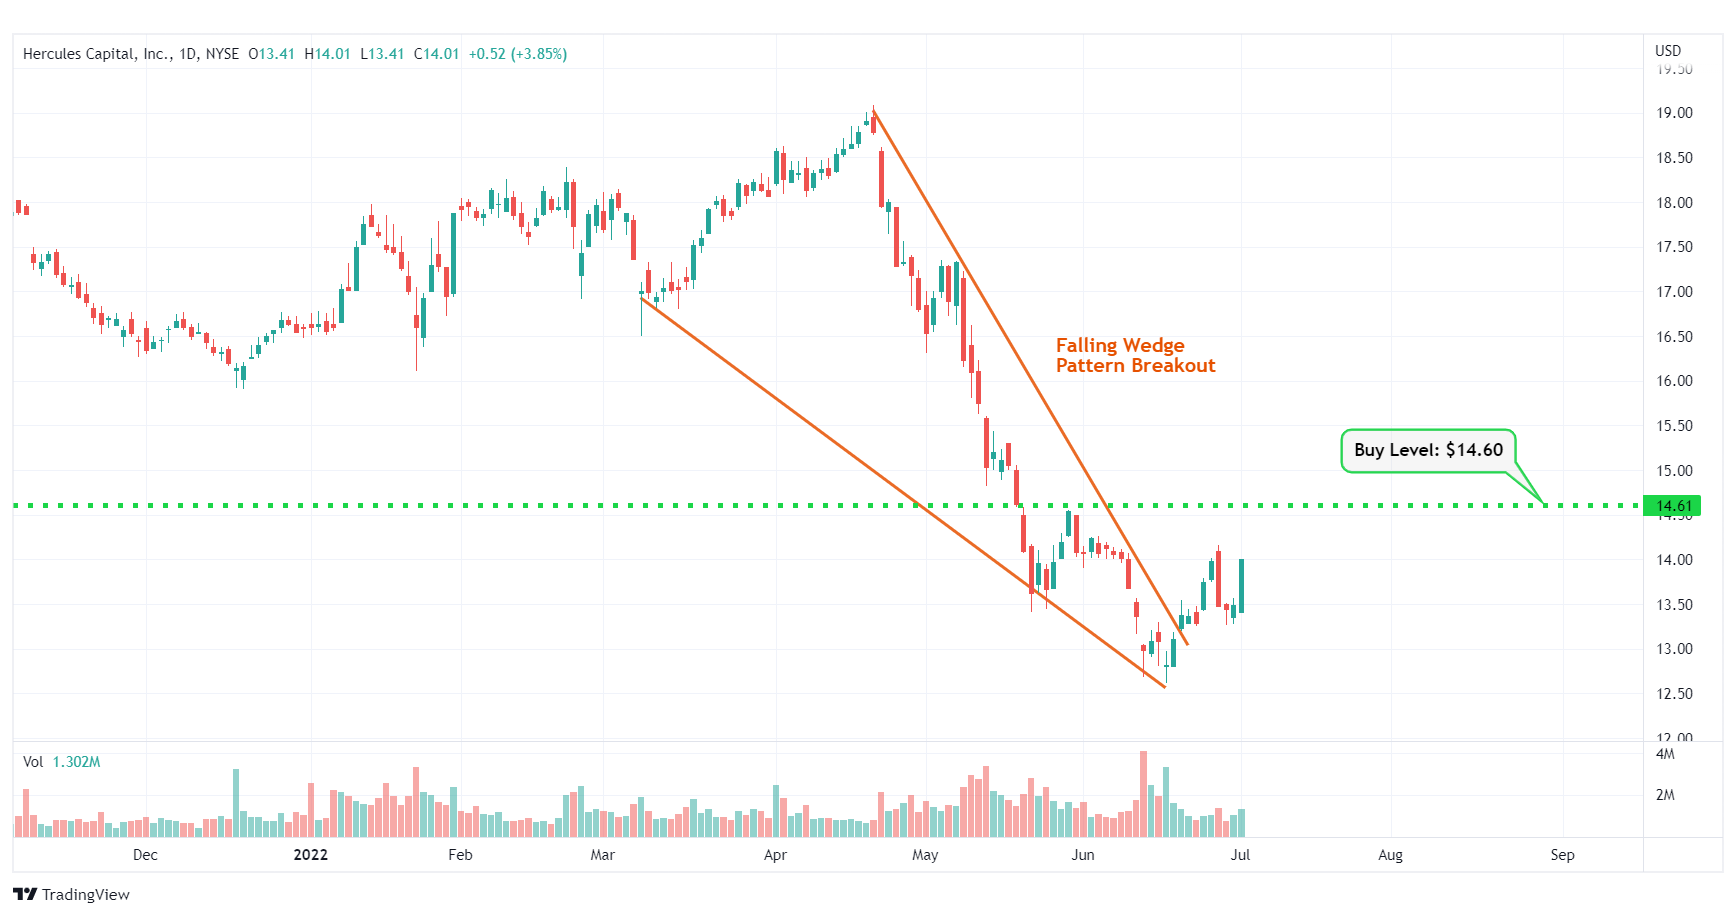
HTGC – Falling Wedge Pattern Breakout
#8 General Mills, Inc. (NYSE: GIS)
Sector: Consumer Defensive | Packaged Foods
Reason: Breakout From an Uptrend Channel
An uptrend channel or an ascending channel is the price action contained between upward sloping parallel lines. It is formed by a lower trend line that connects the swing lows, and an upper channel line that joins the swing highs. A stock usually trades between the two rails of the uptrend channel before finally breaking out from the upper rail.
Buy Level(s): The stock has currently broken out of the uptrend channel. However, the ideal buy level for GIS is if the stock has a daily close above the near-term resistance level of $75.90. This is marked in the chart below as a green color dotted line.
Daily chart – GIS

GIS – Uptrend Channel Breakout
#9 Olink Holding AB (NASDAQ: OLK)
Sector: Healthcare | Diagnostics & Research
Reason: Falling Wedge Pattern Breakout
A falling wedge pattern is formed by joining two downward-sloping, converging trendlines having a contracting range. The pattern appears to be wide at the top and continues to contract as prices fall. A breakout from a falling wedge pattern can indicate either reversal or continuation depending on where the pattern appeared in the trend.
A stock that has broken out of a falling wedge pattern would have gained momentum and would have the potential to move higher.
Buy Level(s): The stock has currently broken out of a falling wedge pattern. However, the ideal buy level for OLK is above the nearest resistance level of $16.60. This is marked in the chart below as a green color dotted line.
Daily chart – OLK
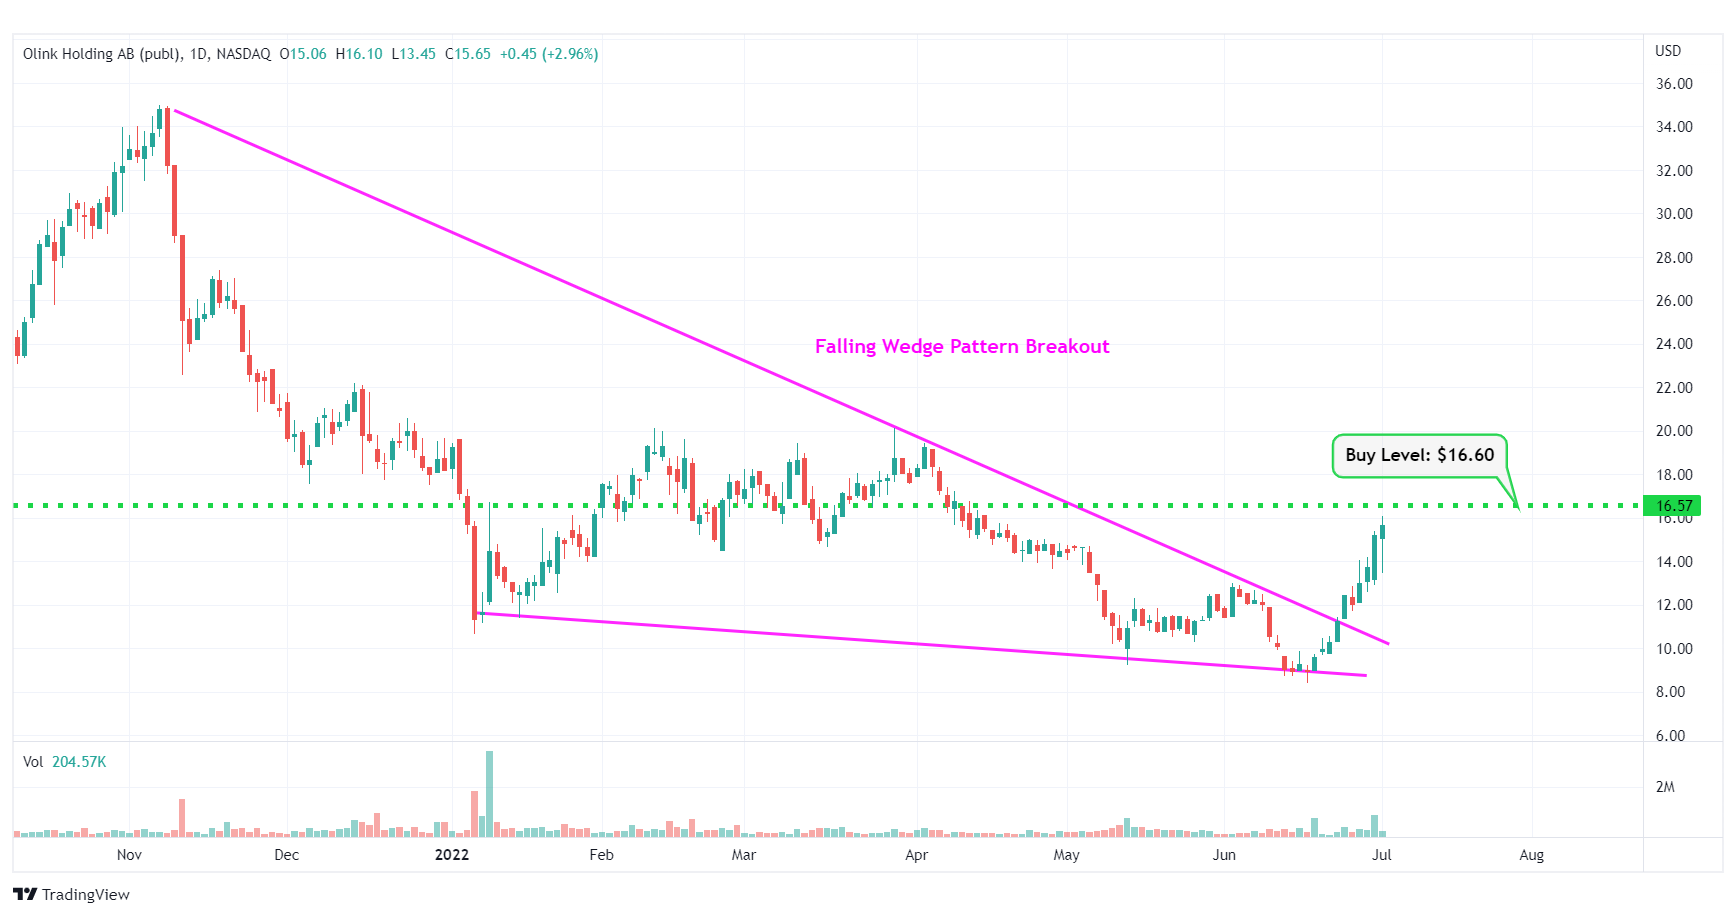
OLK – Falling Wedge Pattern Breakout
#10 International Money Express, Inc. (NASDAQ: IMXI)
Sector: Technology | Information Technology Services
Reason: Downtrend Channel Breakout
A downtrend or descending channel is the price action contained between downward sloping 0parallel lines. It is formed by two lines that are drawn by connecting the lower highs and lower lows of a stock’s price. Even though this is typically a bearish pattern, a breakout from the upper rail of this pattern is considered a good bullish indication.
Buy Level(s): Although the stock has currently broken out of the downtrend channel, the ideal buy level for IMXI is above the near-term resistance area, which translates to a price of around $21.90. This is marked in the chart below as a green color dotted line.
Daily chart – IMXI
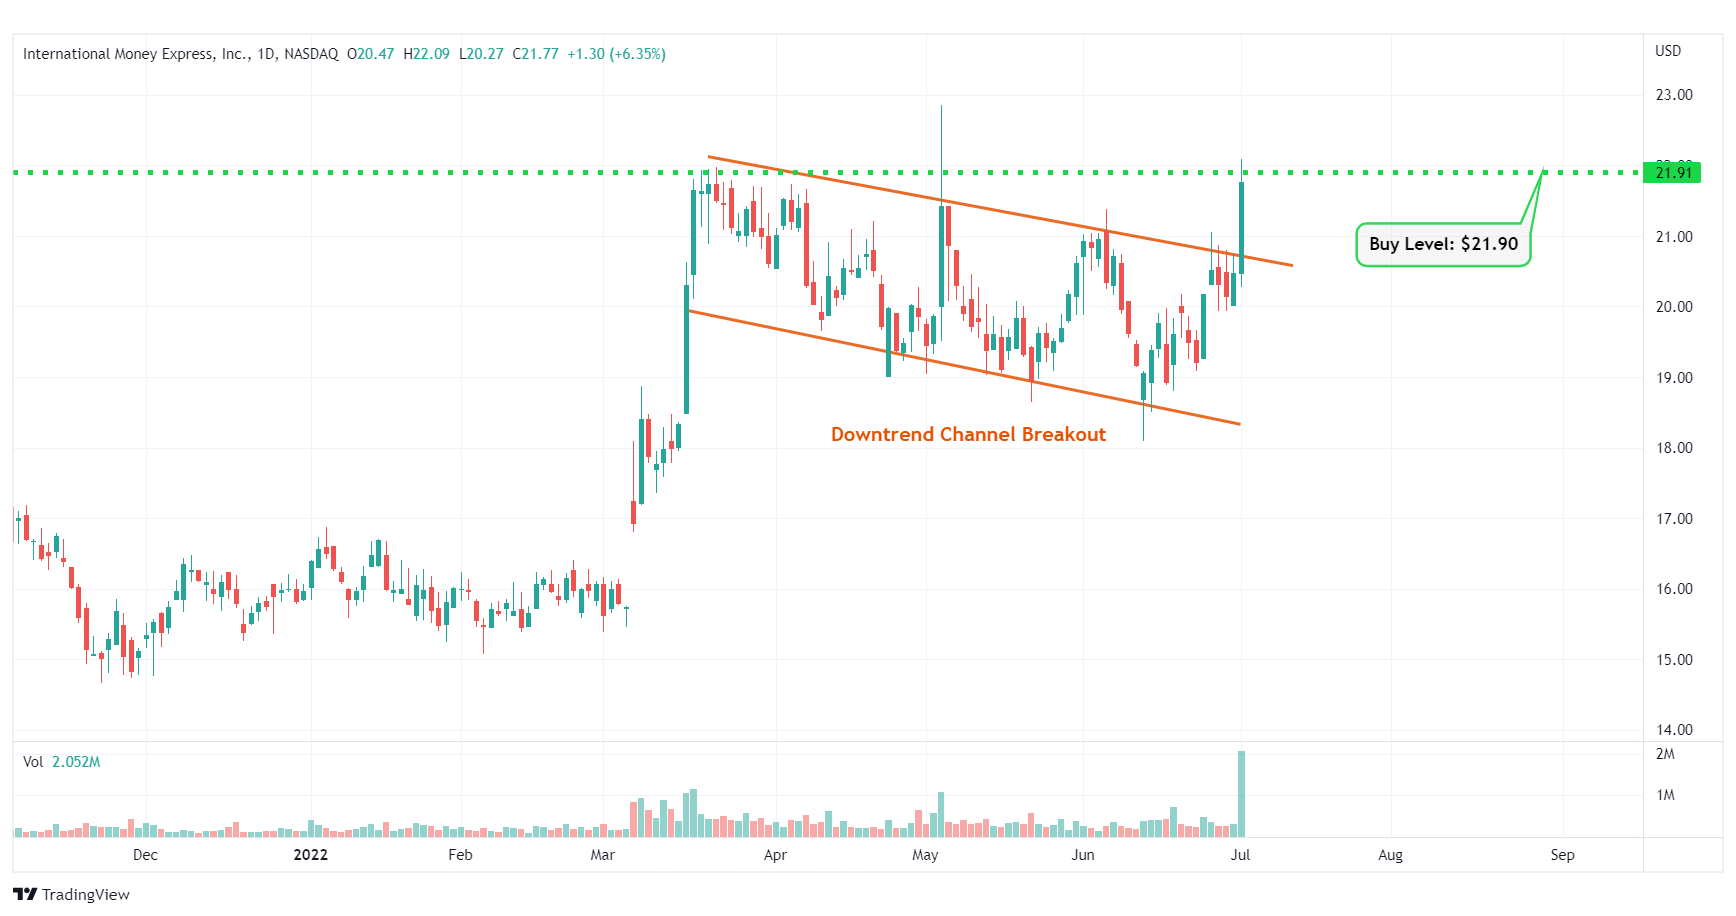
IMXI – Downtrend Channel Breakout
Happy Trading!
— Trades of The Day Research Team
The goal? To build a reliable, growing income stream by making regular investments in high-quality dividend-paying companies. Click here to access our Income Builder Portfolio and see what we’re buying this month.
Source: Trades of the Day
