
Picking a winning trade on a consistent basis is not simply a stroke of luck. It’s the result of calculated screening, planning, and deliberation.
With this in mind, we have started a new weekly series on our top 10 stocks to watch this week — stocks that look poised for a possible breakout in the coming days. Traders should add these stocks to their watchlist now.
The Top 10 Stocks to Watch This Week for Possible Breakouts
| Sl # | Name of the Stock | Stock Ticker | Last Close | Buy Level(s) | Reason |
| 1 | Barrick Gold Corporation | NYSE: GOLD | $23.14 | $24.90 | Symmetrical Triangle Pattern Breakout |
| 2 | Social Capital Hedosophia Holdings Corp. VI | NYSE: IPOF | $10.05 | $10.30 | Falling Wedge Pattern |
| 3 | CommScope Holding Company, Inc. | NASDAQ: COMM | $10.35 | $11.70 | Falling Wedge Pattern Breakout |
| 4 | Altria Group, Inc. | NYSE: MO | $51.74 | $52.50 | Ascending Triangle Pattern Breakout |
| 5 | Macy’s, Inc. | NYSE: M | $25.70 | $27.20 | Symmetrical Triangle Pattern |
| 6 | Ocugen, Inc. | NASDAQ: OCGN | $3.46 | $5.25 | Falling Wedge Pattern |
| 7 | Marriott Vacations Worldwide Corporation | NYSE: VAC | $166.14 | $176.50 | Ascending Triangle Pattern |
| 8 | Royal Gold, Inc. | NASDAQ: RGLD | $120.06 | $121.50 | Symmetrical Triangle Pattern Breakout |
| 9 | Union Pacific Corporation | NYSE: UNP | $251.19 | $255.40 | Consolidation Area |
| 10 | Ventas, Inc. | NYSE: VTR | $52.94 | $54.10 | Symmetrical Triangle Pattern Breakout |
Important: Typically, these trades offer a risk: reward ratio of 1:2 or 1:3 in the next 6 months, which implies 2x to 3x rewards when compared to risks. So, be sure to set your stop-loss levels and target prices accordingly to manage your risk. In addition, these trade ideas are triggered using daily closing prices, not intra-day pricing. So, if you participate in these trades, make sure that you only buy the stock once its daily close is above the recommended price level.
That said, here are the top 10 stocks to watch for a breakout, in no particular order.
#1 Barrick Gold Corporation (NYSE: GOLD)
Sector: Basic Materials | Gold
Reason: Symmetrical Triangle Pattern Breakout
A symmetrical triangle is a chart pattern formed by two converging trend lines connecting a series of sequential peaks and troughs. These two lines result in the formation of a triangle that appears to be symmetrical.
A symmetrical triangle pattern is usually formed when there is an indecision in the price movements and there is uncertainty among the buyers and sellers. This chart pattern represents a period of consolidation before the price breaks out or breaks down. In case a breakout occurs from the upper trend line, it is a strong bullish indication as it signifies the start of a new bullish trend.
Buy Level(s): The stock has currently broken out of a symmetrical triangle pattern. However, the ideal buy level for GOLD is if the stock closes above the immediate resistance level of $24.90. This is marked in the chart below as a green color dotted line.
Daily chart – GOLD
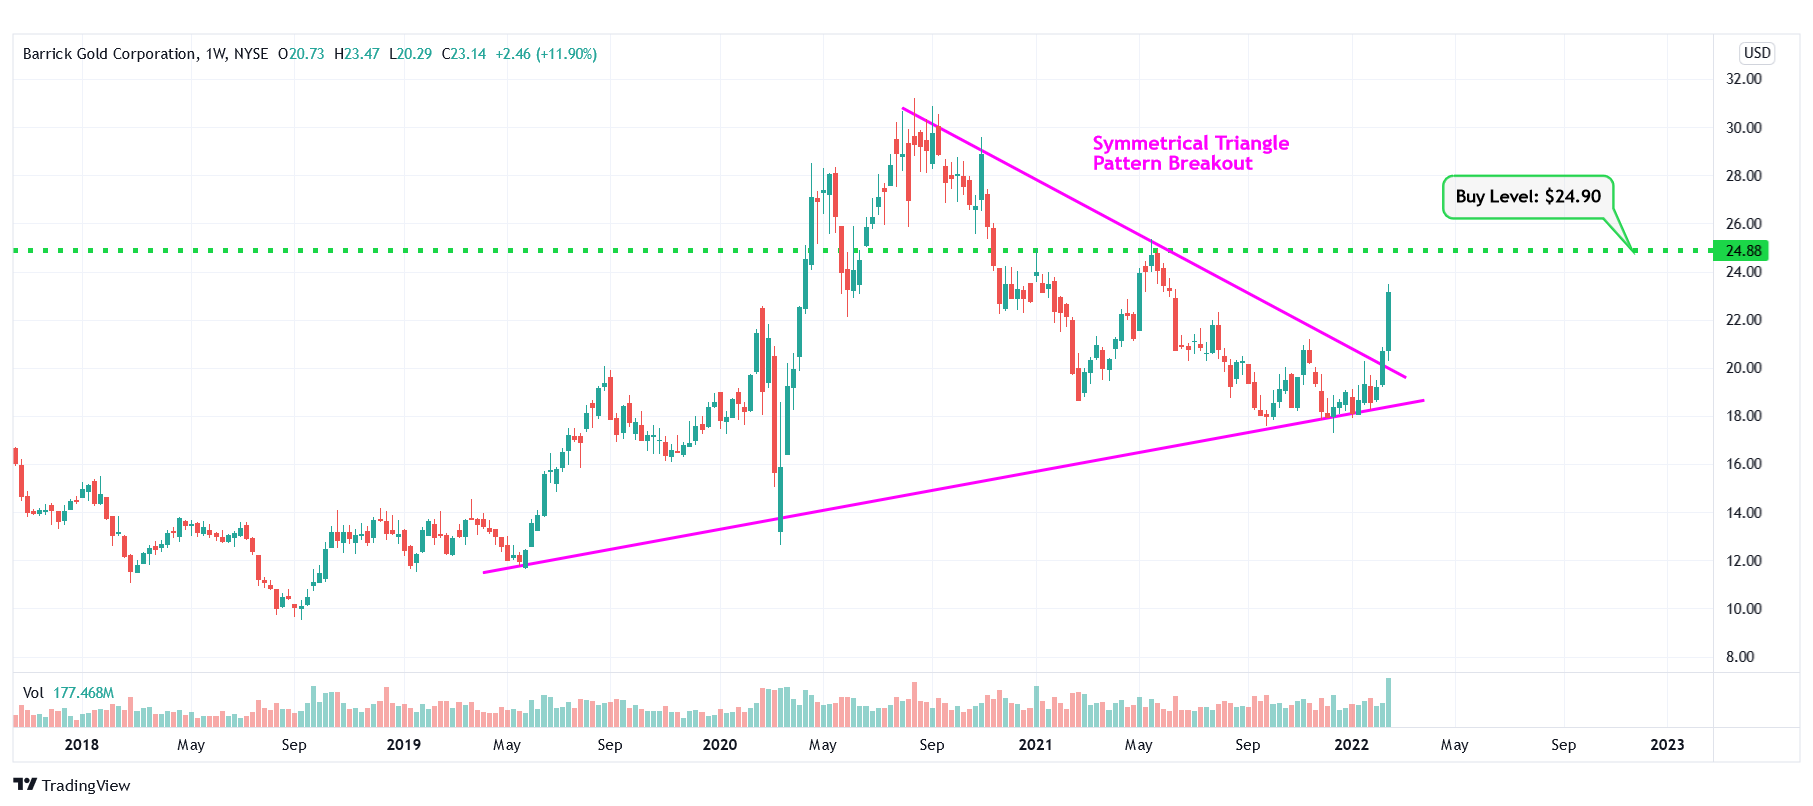
GOLD – Symmetrical Triangle Pattern Breakout
#2 Social Capital Hedosophia Holdings Corp. VI (NYSE: IPOF)
Sector: Financial | Shell Companies
Reason: Formation of a Falling Wedge Pattern
A falling wedge pattern is formed by joining two downward-sloping, converging trendlines having a contracting range. The pattern appears to be wide at the top and continues to contract as prices fall. A breakout from a falling wedge pattern can indicate either reversal or continuation depending on where the pattern appeared in the trend.
A stock that has broken out of a falling wedge pattern would have gained momentum and would have the potential to move higher.
Buy Level(s): The ideal buy level for IPOF is if the stock breaks out of the falling wedge pattern, at a price of around $10.30. This is marked in the chart below as a green color dotted line.
Daily chart – IPOF
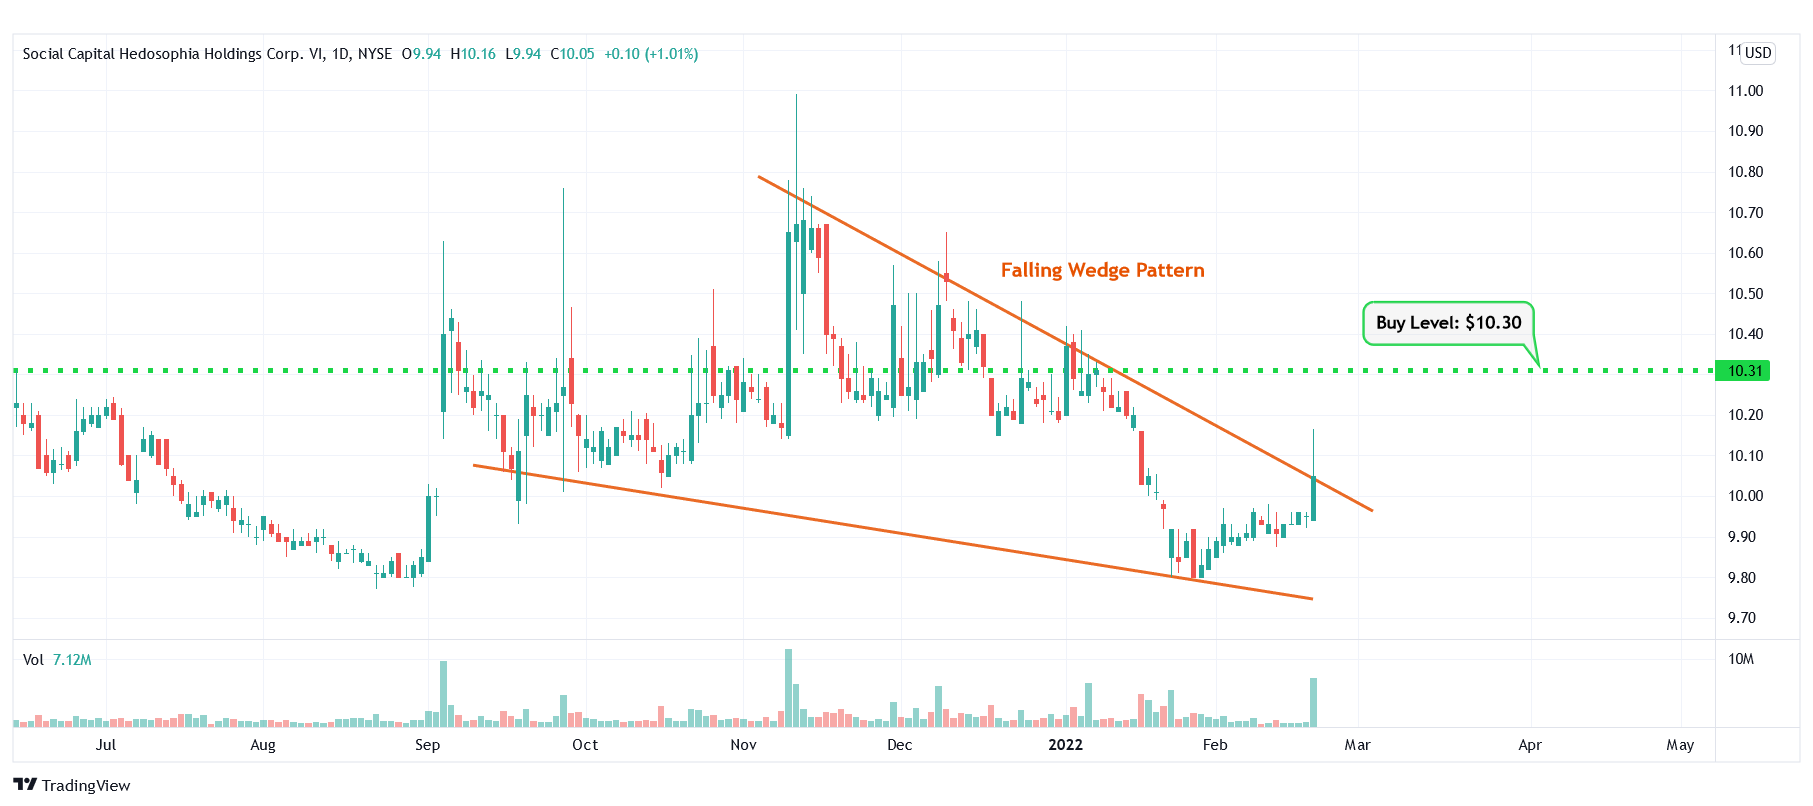
IPOF – Falling Wedge Pattern
#3 CommScope Holding Company, Inc. (NASDAQ: COMM)
Sector: Technology | Communication Equipment
Reason: Falling Wedge Pattern Breakout
A falling wedge pattern is formed by joining two downward-sloping, converging trendlines having a contracting range. The pattern appears to be wide at the top and continues to contract as prices fall. A breakout from a falling wedge pattern can indicate either reversal or continuation depending on where the pattern appeared in the trend.
A stock that has broken out of a falling wedge pattern would have gained momentum and would have the potential to move higher.
Buy Level(s): The stock has currently broken out of a falling wedge pattern. However, the ideal buy level for COMM is above the nearest resistance level of $11.70. This is marked in the chart below as a green color dotted line.
Daily chart – COMM
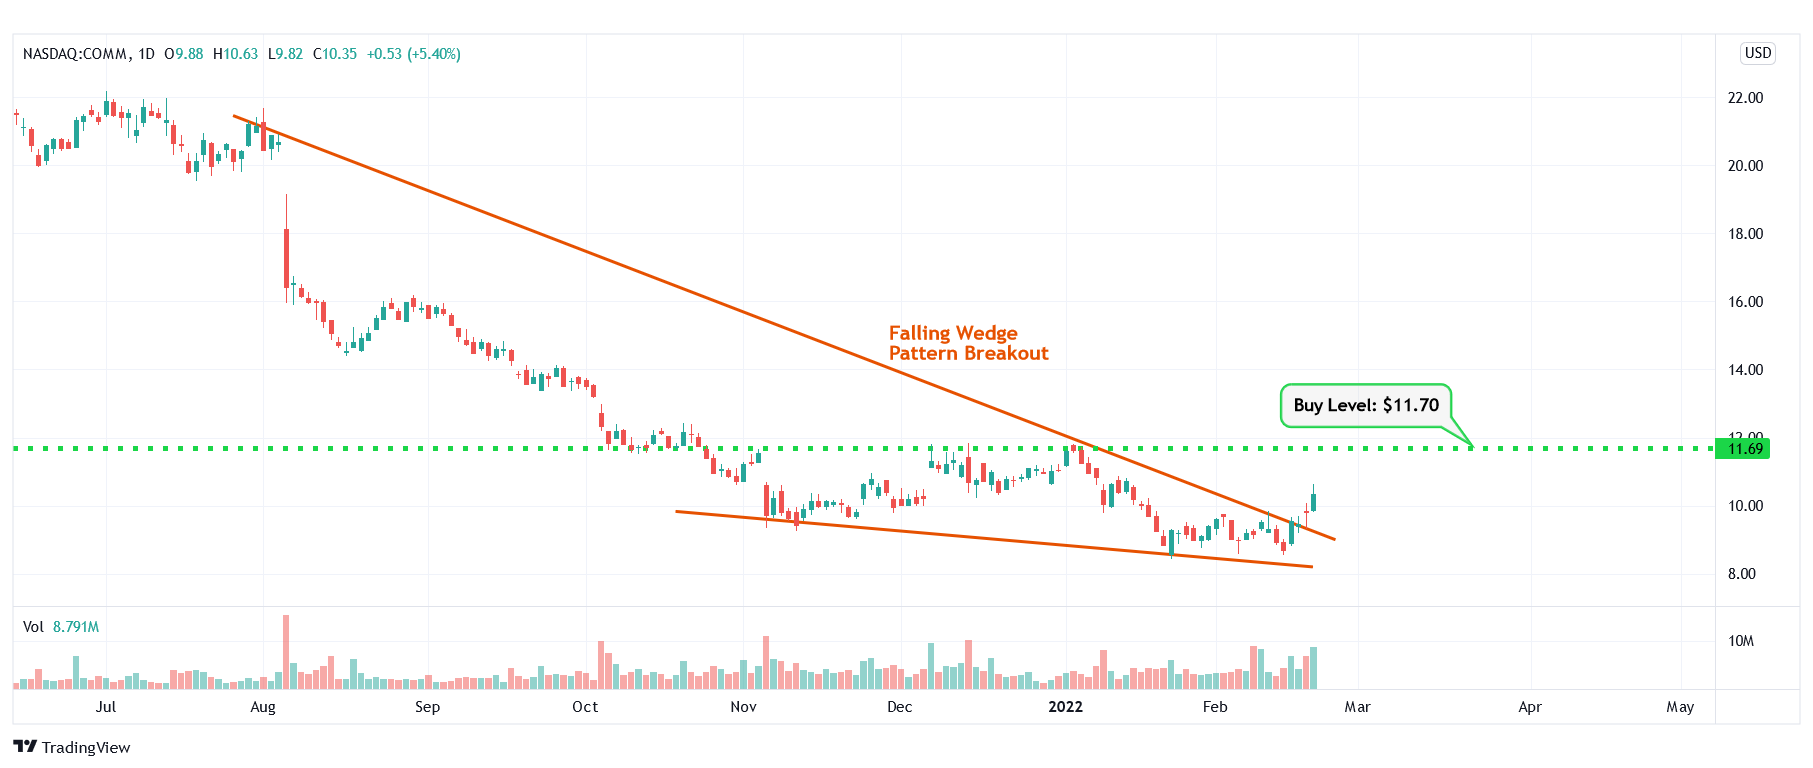
COMM – Falling Wedge Pattern Breakout
#4 Altria Group, Inc. (NYSE: MO)
Sector: Consumer Defensive | Tobacco
Reason: Breakout From an Ascending Triangle Pattern
An ascending triangle pattern is a bullish pattern formed by drawing a horizontal line along the swing highs, and a rising trendline along the swing lows. These two lines result in the formation of a triangle. A breakout from this pattern is typically a strong bullish indication.
Buy Level(s): Although the stock has broken out of the ascending triangle pattern, the ideal buy level for MO is if the stock has a daily close above the near-term resistance level of $52.50. This is marked in the chart below as a green color dotted line.
Daily chart – MO
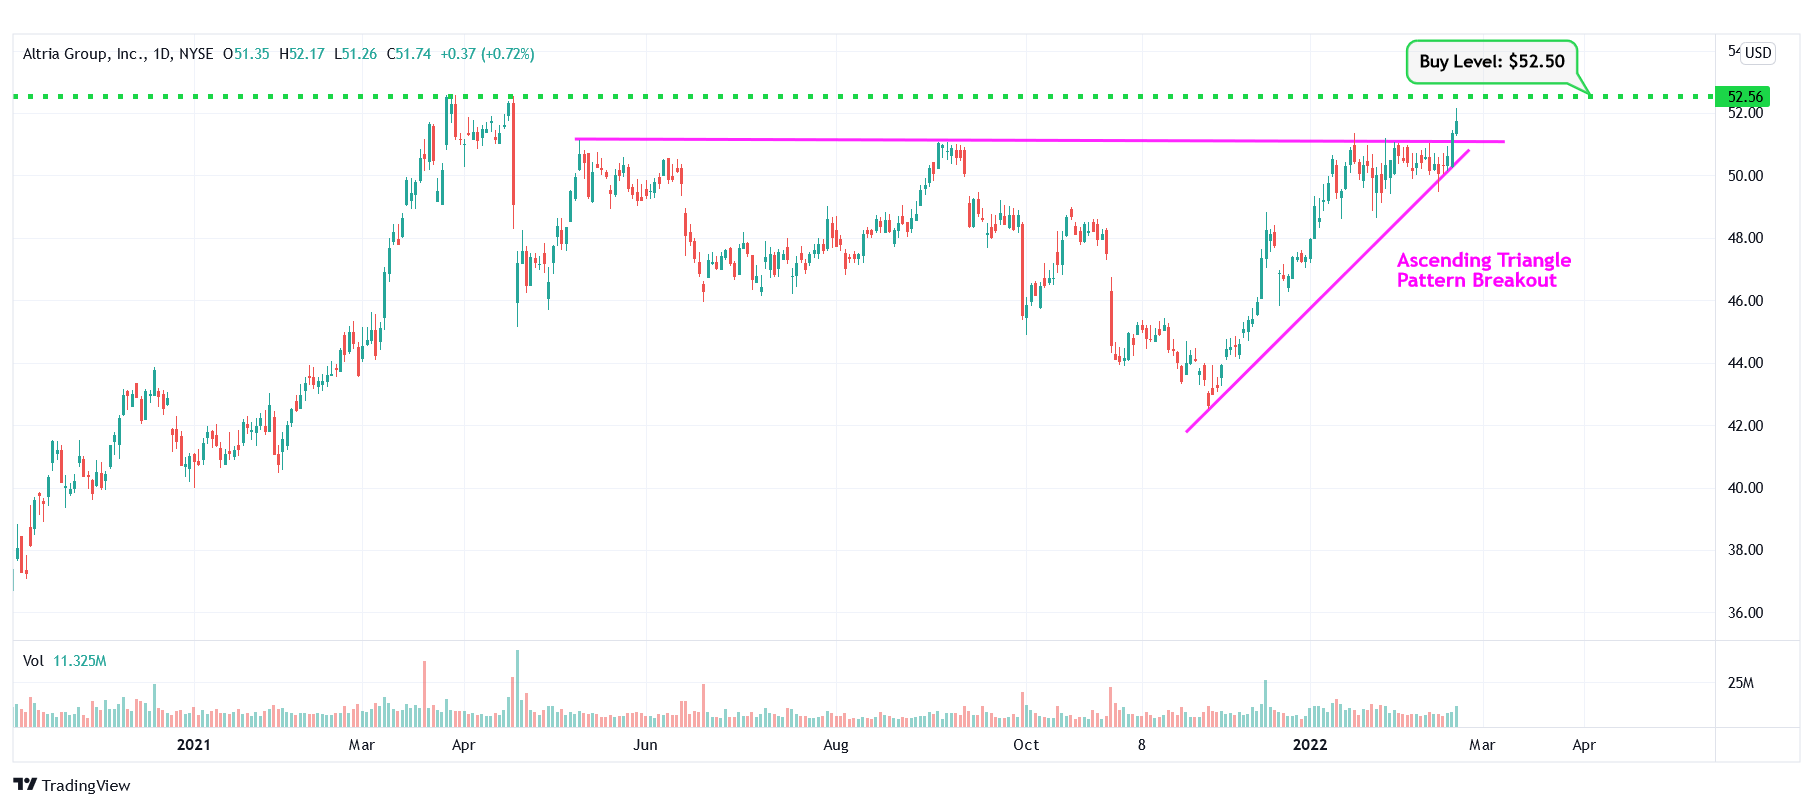
MO – Ascending Triangle Pattern Breakout
#5 Macy’s, Inc. (NYSE: M)
Sector: Consumer Cyclical | Department Stores
Reason: Formation of a Symmetrical Triangle Pattern
A symmetrical triangle is a chart pattern formed by two converging trend lines connecting a series of sequential peaks and troughs. These two lines result in the formation of a triangle that appears to be symmetrical.
A symmetrical triangle pattern is usually formed when there is an indecision in the price movements and there is uncertainty among the buyers and sellers. This chart pattern represents a period of consolidation before the price breaks out or breaks down. In case a breakout occurs from the upper trend line, it is a strong bullish indication as it signifies the start of a new bullish trend.
Buy Level(s): The ideal buy level for M is if the stock has a daily close above the breakout level of the symmetrical triangle pattern, at around $27.20. This is marked in the chart below as a green color dotted line.
Daily chart – M
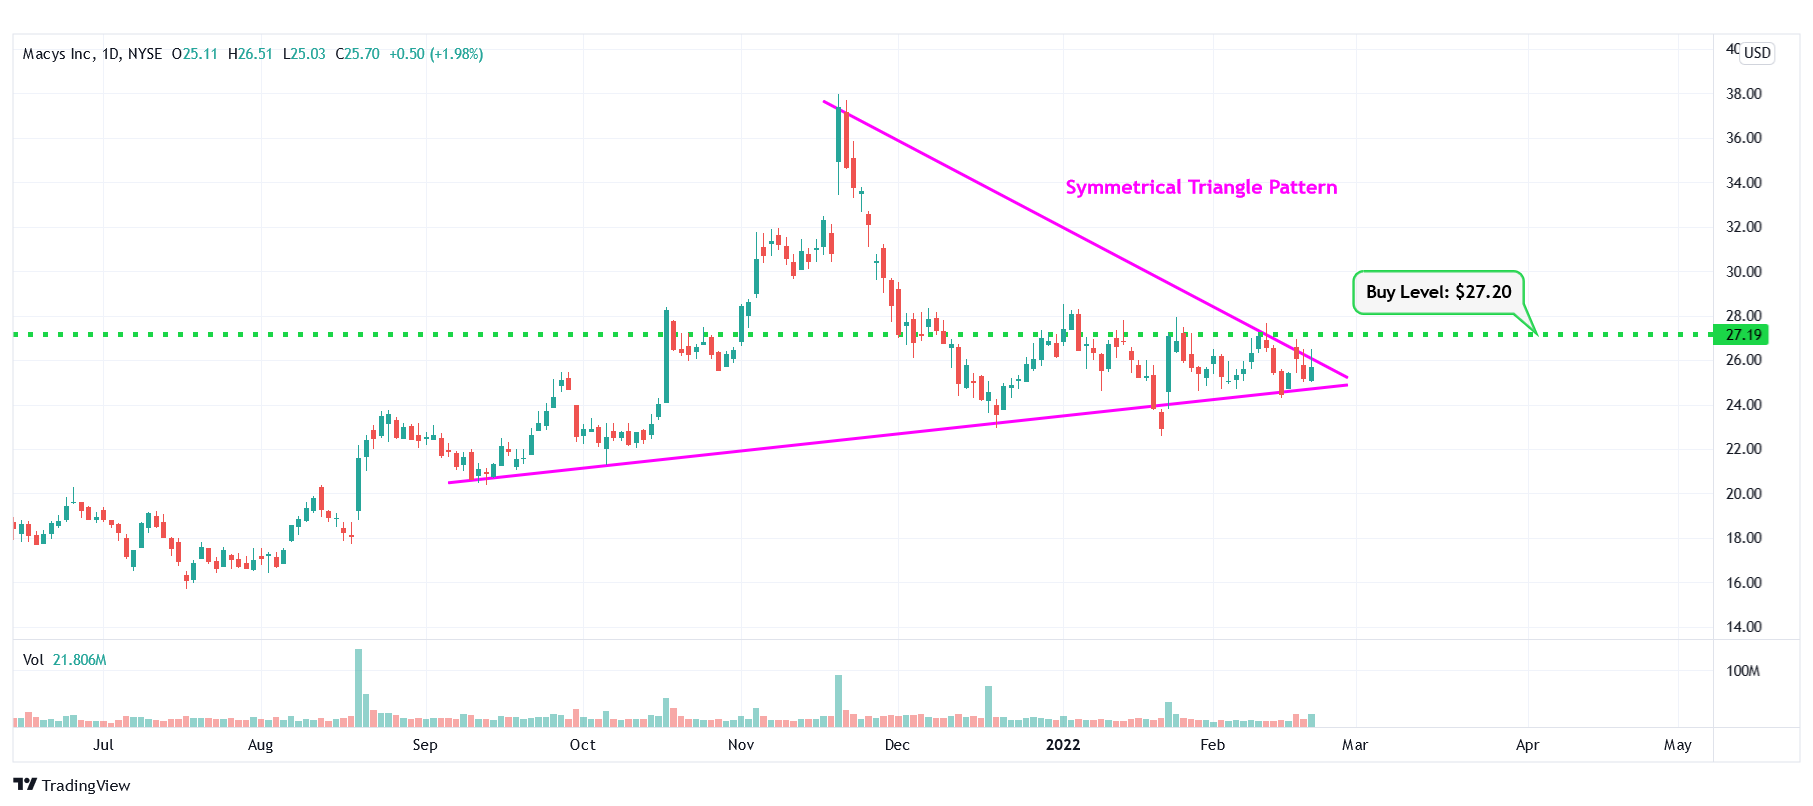
M – Symmetrical Triangle Pattern
#6 Ocugen, Inc. (NASDAQ: OCGN)
Sector: Healthcare | Biotechnology
Reason: Formation of a Falling Wedge Pattern
A falling wedge pattern is formed by joining two downward-sloping, converging trendlines having a contracting range. The pattern appears to be wide at the top and continues to contract as prices fall. A breakout from a falling wedge pattern can indicate either reversal or continuation depending on where the pattern appeared in the trend.
A stock that has broken out of a falling wedge pattern would have gained momentum and would have the potential to move higher.
Buy Level(s): The ideal buy level for OCGN is if the stock breaks out of the falling wedge pattern, at a price of around $5.25. This is marked in the chart below as a green color dotted line.
Daily chart – OCGN
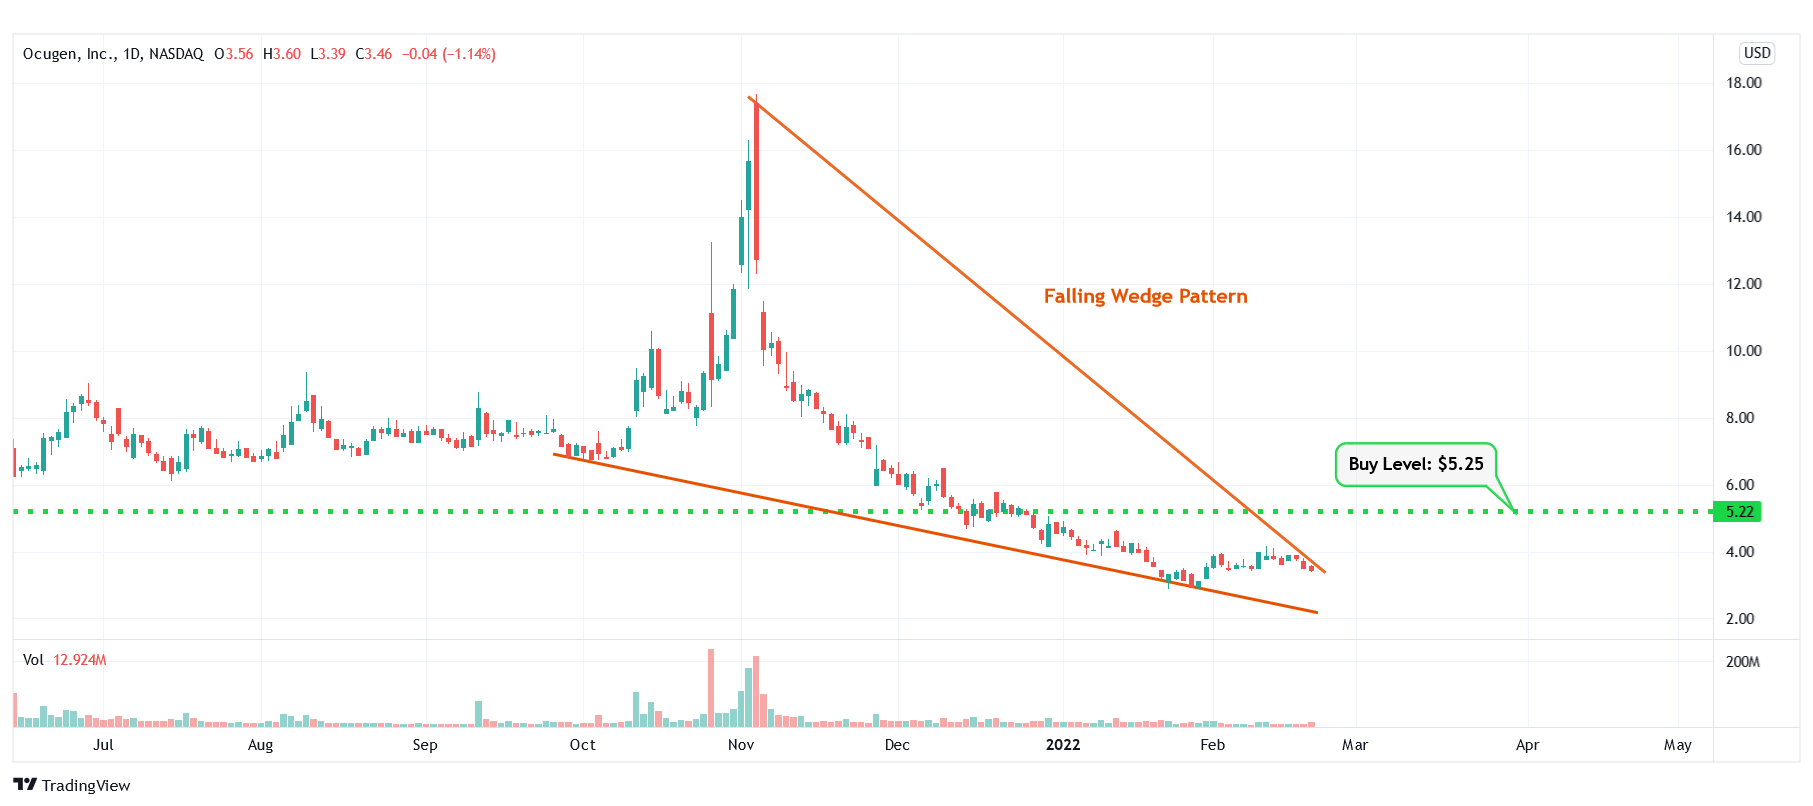
OCGN – Falling Wedge Pattern
#7 Marriott Vacations Worldwide Corporation (NYSE: VAC)
Sector: Consumer Cyclical | Resorts & Casinos
Reason: Formation of an Ascending Triangle Pattern
An ascending triangle pattern is a bullish pattern formed by drawing a horizontal line along the swing highs, and a rising trendline along the swing lows. These two lines result in the formation of a triangle. A breakout from this pattern is typically a strong bullish indication.
Buy Level(s): The ideal buy level for VAC is if the stock breaks out of the ascending triangle pattern and has a daily close above the near-term resistance level of $176.50. This is marked in the chart below as a green color dotted line.
Daily chart – VAC
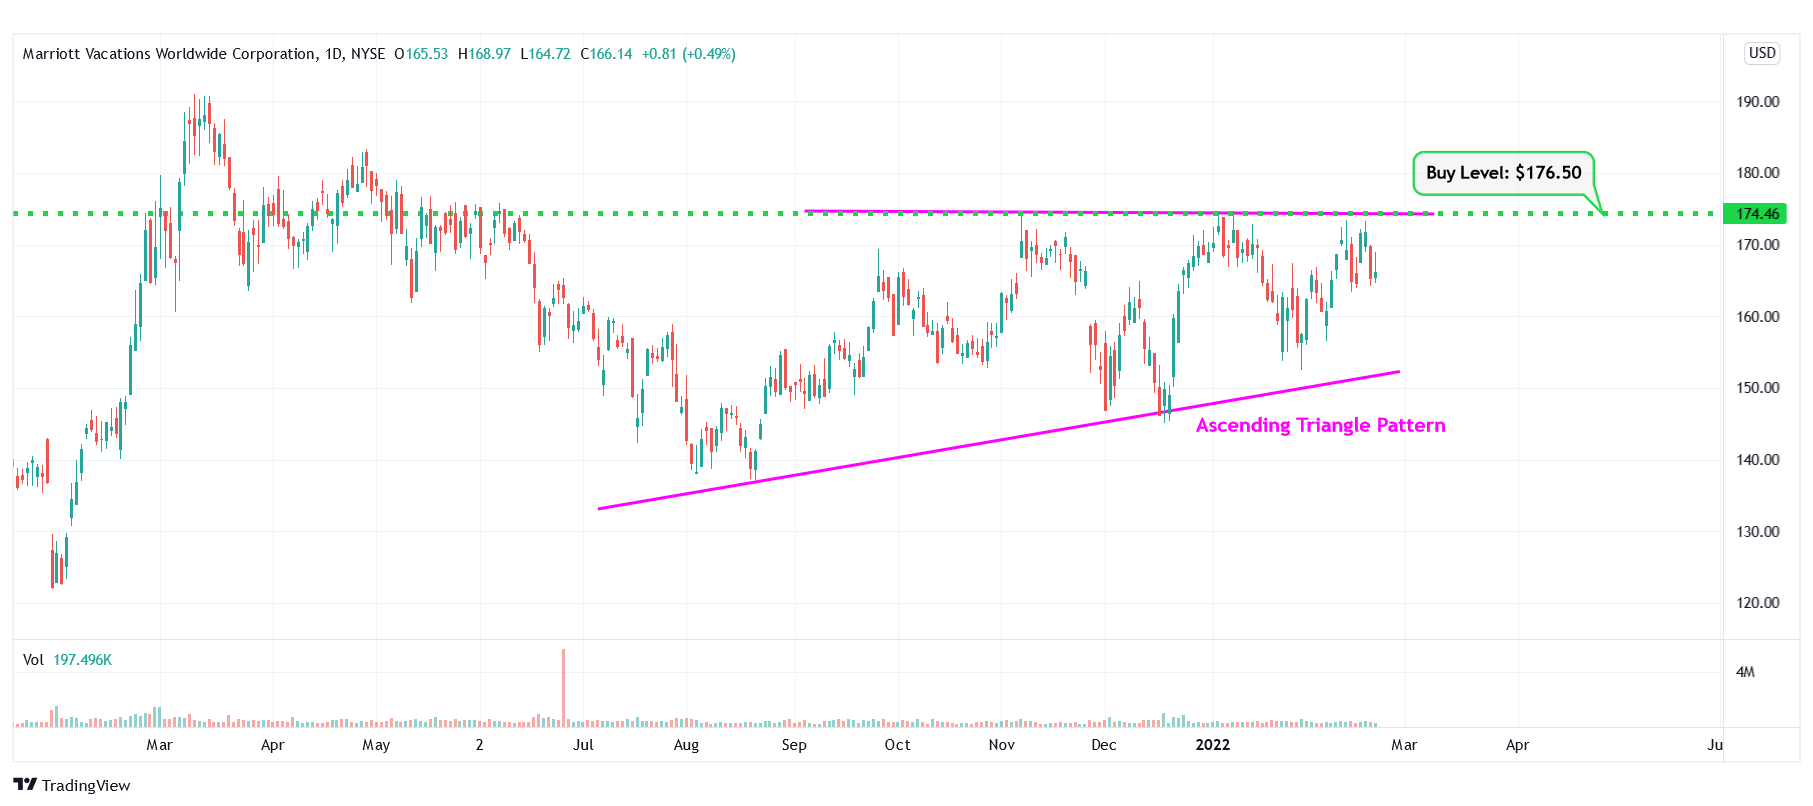
VAC – Ascending Triangle Pattern
#8 Royal Gold, Inc. (NASDAQ: RGLD)
Sector: Basic Materials | Gold
Reason: Symmetrical Triangle Pattern Breakout
A symmetrical triangle is a chart pattern formed by two converging trend lines connecting a series of sequential peaks and troughs. These two lines result in the formation of a triangle that appears to be symmetrical.
A symmetrical triangle pattern is usually formed when there is an indecision in the price movements and there is uncertainty among the buyers and sellers. This chart pattern represents a period of consolidation before the price breaks out or breaks down. In case a breakout occurs from the upper trend line, it is a strong bullish indication as it signifies the start of a new bullish trend.
Buy Level(s): The stock has currently broken out of a symmetrical triangle pattern. However, the ideal buy level for RGLD is if the stock closes above the immediate resistance level of $121.50. This is marked in the chart below as a green color dotted line.
Daily chart – RGLD
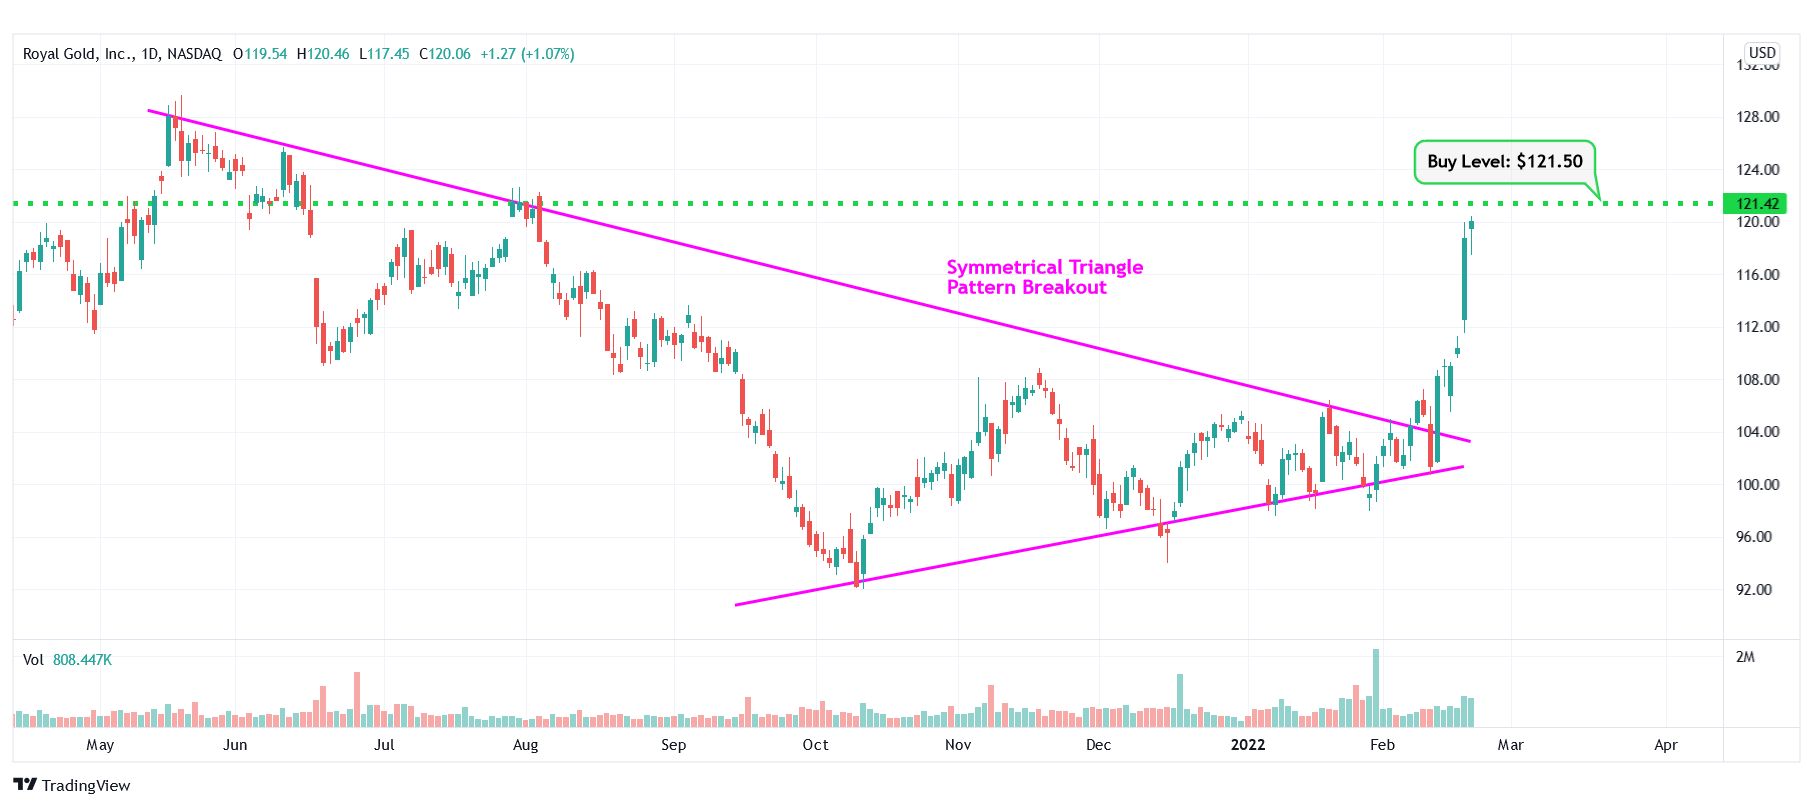
RGLD – Symmetrical Triangle Pattern Breakout
#9 Union Pacific Corporation (NYSE: UNP)
Sector: Industrials | Railroads
Reason: Formation of a Consolidation Area in the Daily Chart
A Consolidation Area is a price action contained between two parallel lines. It is formed by a lower line that connects the lows, and an upper line that joins the highs. A stock usually trades between the two lines of the consolidation area before finally breaking out from the upper rail.
Buy Level(s): The ideal buy level for UNP is above the breakout level of the consolidation area, at around $255.40. This is marked in the chart below as a green color dotted line.
Daily chart – UNP
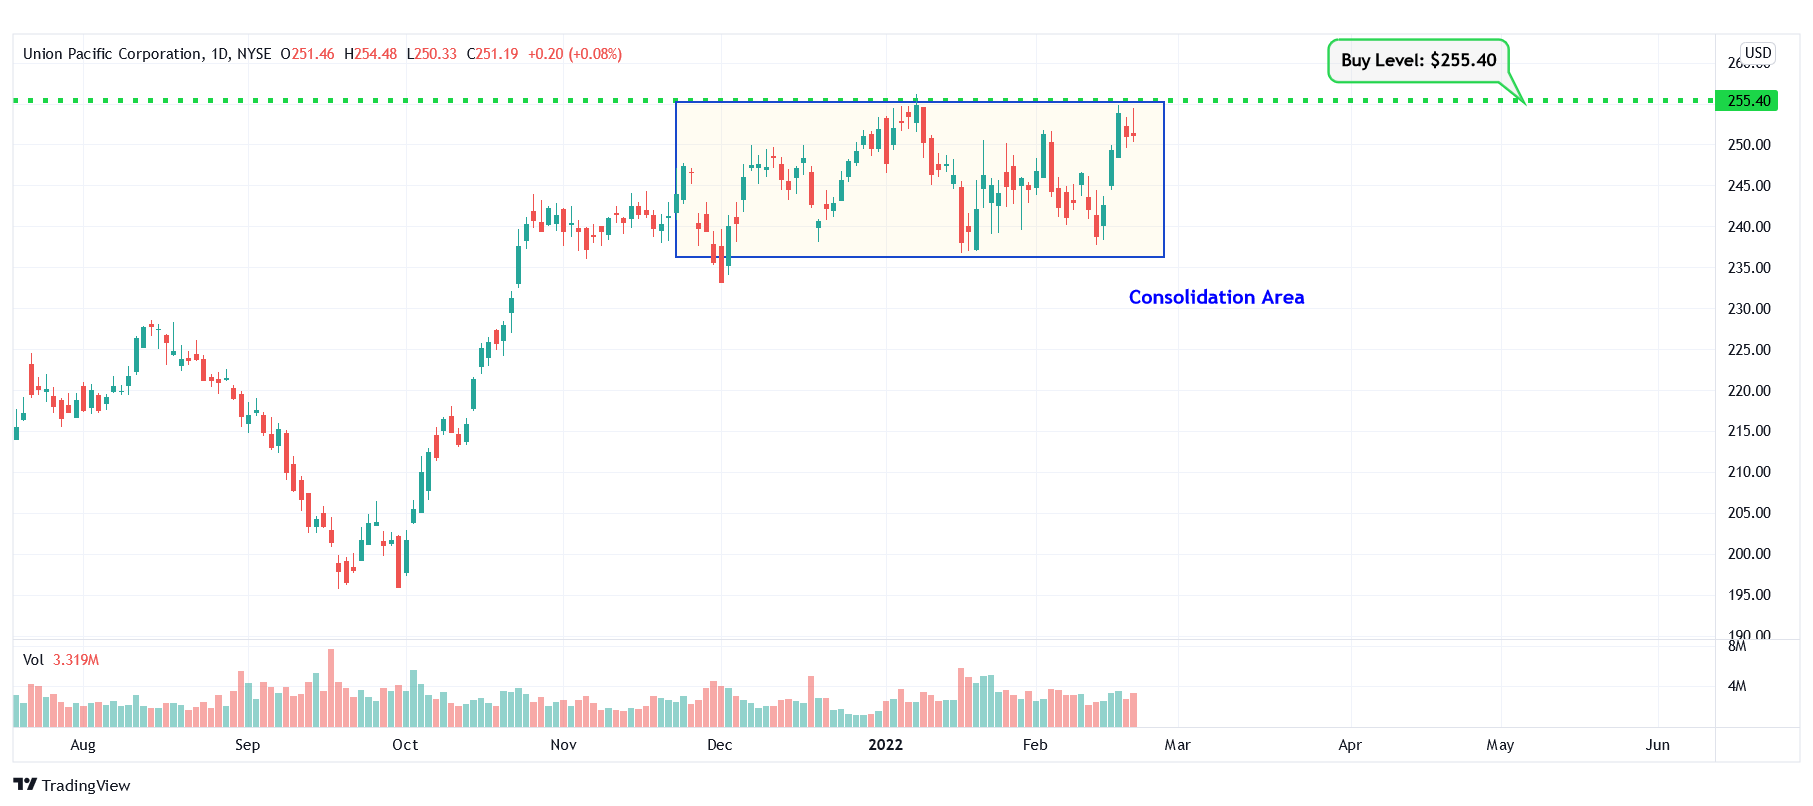
UNP – Consolidation Area
#10 Ventas, Inc. (NYSE: VTR)
Sector: Real Estate | REIT – Healthcare Facilities
Reason: Symmetrical Triangle Pattern Breakout
A symmetrical triangle is a chart pattern formed by two converging trend lines connecting a series of sequential peaks and troughs. These two lines result in the formation of a triangle that appears to be symmetrical.
A symmetrical triangle pattern is usually formed when there is an indecision in the price movements and there is uncertainty among the buyers and sellers. This chart pattern represents a period of consolidation before the price breaks out or breaks down. In case a breakout occurs from the upper trend line, it is a strong bullish indication as it signifies the start of a new bullish trend.
Buy Level(s): The stock has currently broken out of a symmetrical triangle pattern. However, the ideal buy level for VTR is if the stock closes above the immediate resistance level of $54.10. This is marked in the chart below as a green color dotted line.
Daily chart – VTR
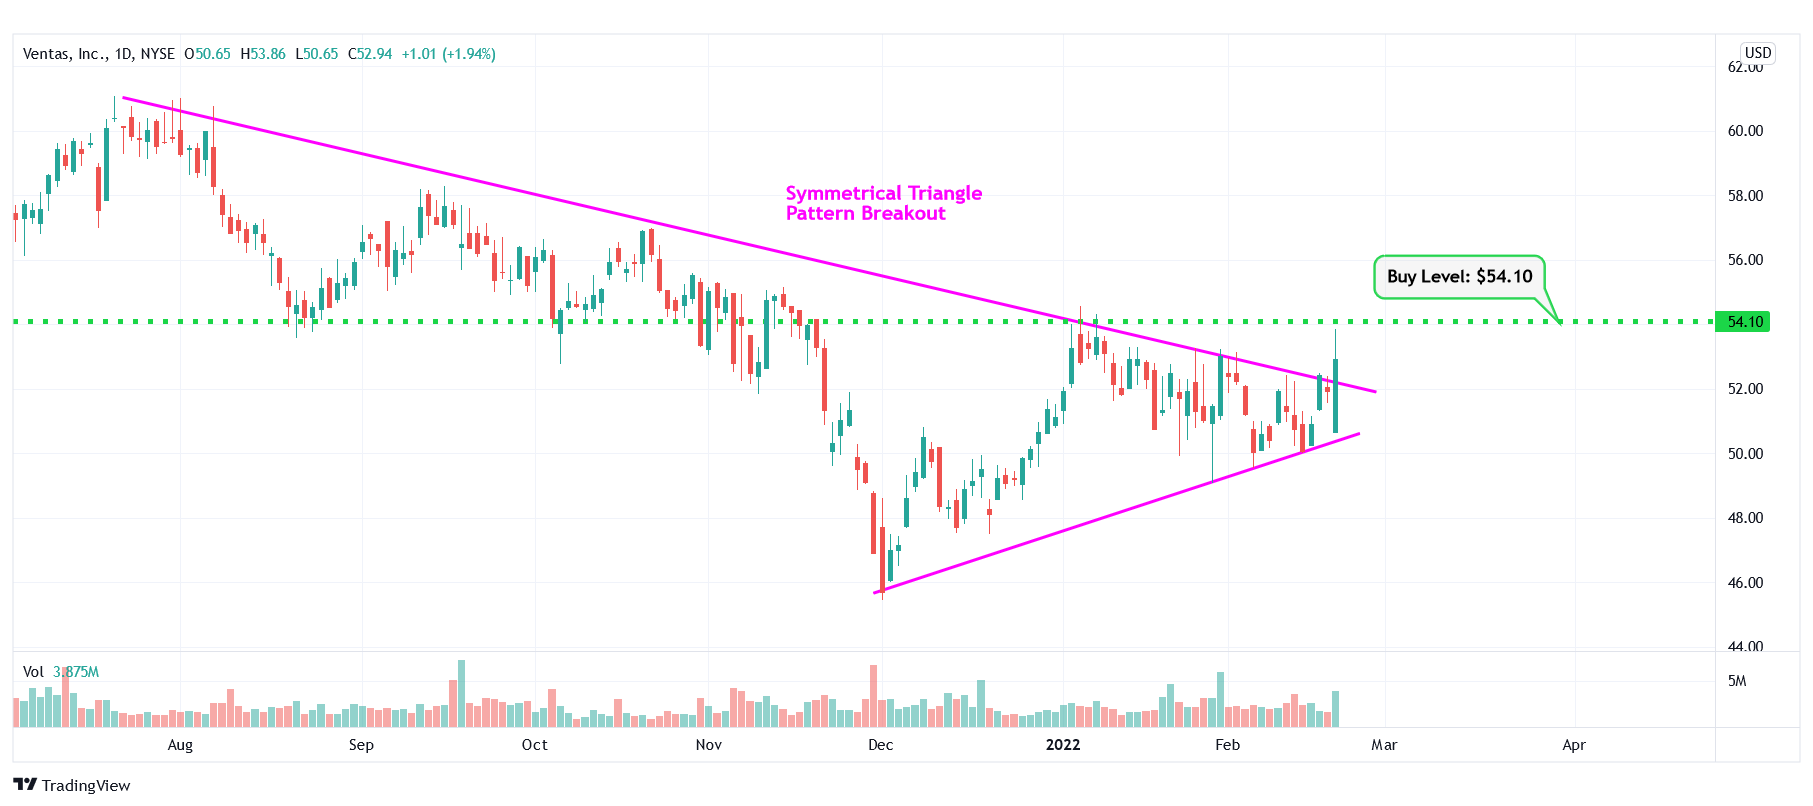
VTR – Symmetrical Triangle Pattern Breakout
Happy Trading!
— Trades of The Day Research Team
The goal? To build a reliable, growing income stream by making regular investments in high-quality dividend-paying companies. Click here to access our Income Builder Portfolio and see what we’re buying this month.
Source: Trades of the Day
