
Picking a winning trade on a consistent basis is not simply a stroke of luck. It’s the result of calculated screening, planning, and deliberation.
With this in mind, we have started a new weekly series on our top 10 stocks to watch this week — stocks that look poised for a possible breakout in the coming days. Traders should add these stocks to their watchlist now.
The Top 10 Stocks to Watch This Week for Possible Breakouts
| Sl # | Name of the Stock | Stock Ticker | Last Close | Buy Level(s) | Reason |
| 1 | Banco Santander-Chile | NYSE: BSAC | $20.04 | $20.60 | Downtrend Channel Breakout |
| 2 | Karyopharm Therapeutics Inc. | NASDAQ: KPTI | $8.28 | $8.50 | Symmetrical Triangle Pattern |
| 3 | Trip.com Group Limited | NASDAQ: TCOM | $25.77 | $29.00 | Falling Wedge Pattern |
| 4 | Dun & Bradstreet Holdings, Inc. | NYSE: DNB | $20.10 | $20.60 | Ascending Triangle Pattern |
| 5 | Peloton Interactive, Inc. | NASDAQ: PTON | $27.06 | $58.40 | Downtrend Channel |
| 6 | Azul S.A. | NYSE: AZUL | $15.09 | $16.20 | Double Bottom Pattern Breakout |
| 7 | Futu Holdings Limited | NASDAQ: FUTU | $45.41 | $49.90 | Falling Wedge Pattern Breakout |
| 8 | Companhia Paranaense de Energia – COPEL | NYSE: ELP | $5.96 | $6.70 | Symmetrical Triangle Pattern |
| 9 | Centrais Eletricas Brasileiras S.A. | NYSE: EBR | $6.19 | $6.70 | Downtrend Channel Breakout |
| 10 | Mondelez International, Inc. | NASDAQ: MDLZ | $68.36 | $68.60 | Consolidation Area Breakout |
Important: Typically, these trades offer a risk: reward ratio of 1:2 or 1:3 in the next 6 months, which implies 2x to 3x rewards when compared to risks. So, be sure to set your stop-loss levels and target prices accordingly to manage your risk. In addition, these trade ideas are triggered using daily closing prices, not intra-day pricing. So, if you participate in these trades, make sure that you only buy the stock once its daily close is above the recommended price level.
That said, here are the top 10 stocks to watch for a breakout, in no particular order.
#1 Banco Santander-Chile (NYSE: BSAC)
Sector: Financial | Banks – Regional
Reason: Downtrend Channel Breakout
A downtrend or descending channel is the price action contained between downward sloping parallel lines. It is formed by two lines that are drawn by connecting the lower highs and lower lows of a stock’s price. Even though this is typically a bearish pattern, a breakout from the upper rail of this pattern is considered a good bullish indication.
Buy Level(s): The daily chart shows that the stock has currently broken out of a downtrend channel. However, there is a near-term resistance level for the stock. Hence, the ideal buy level for BSAC is if the stock has a daily close above $20.60. This is marked in the chart below as a green color dotted line.
Daily chart – BSAC
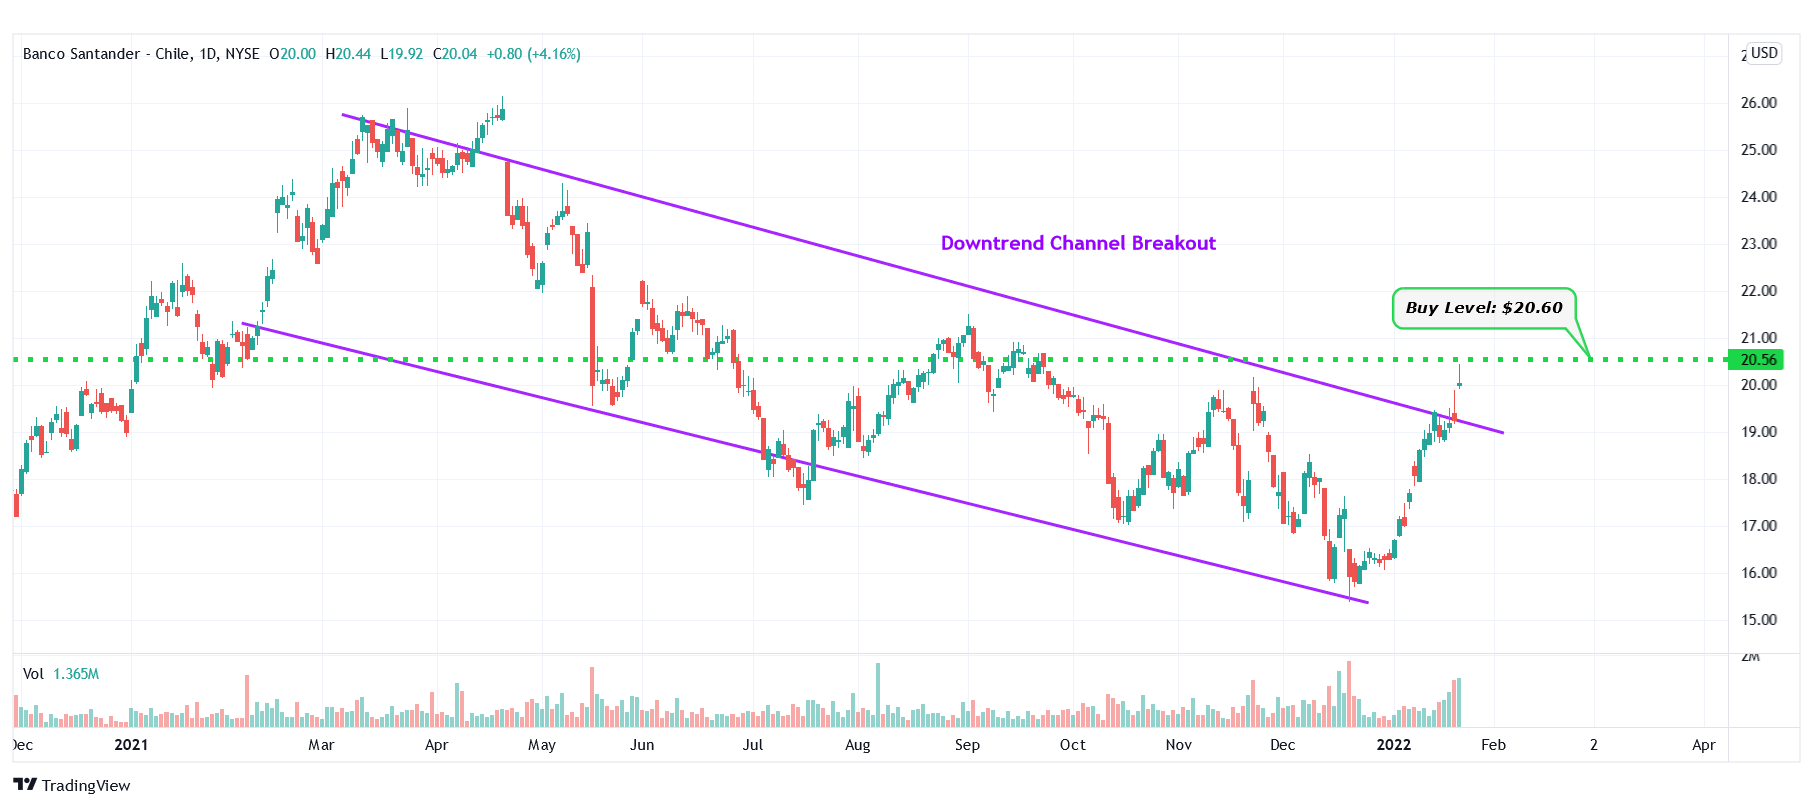
BSAC – Downtrend Channel Breakout
#2 Karyopharm Therapeutics Inc. (NASDAQ: KPTI)
Sector: Healthcare | Biotechnology
Reason: Formation of a Symmetrical Triangle Pattern
A symmetrical triangle is a chart pattern formed by two converging trend lines connecting a series of sequential peaks and troughs. These two lines result in the formation of a triangle that appears to be symmetrical.
A symmetrical triangle pattern is usually formed when there is an indecision in the price movements and there is uncertainty among the buyers and sellers. This chart pattern represents a period of consolidation before the price breaks out or breaks down. In case a breakout occurs from the upper trend line, it is a strong bullish indication as it signifies the start of a new bullish trend.
Buy Level(s): The ideal buy level for KPTI is if the stock has a daily close above the breakout level of the symmetrical triangle pattern, at around $8.50. This is marked in the chart below as a green color dotted line.
Daily chart – KPTI
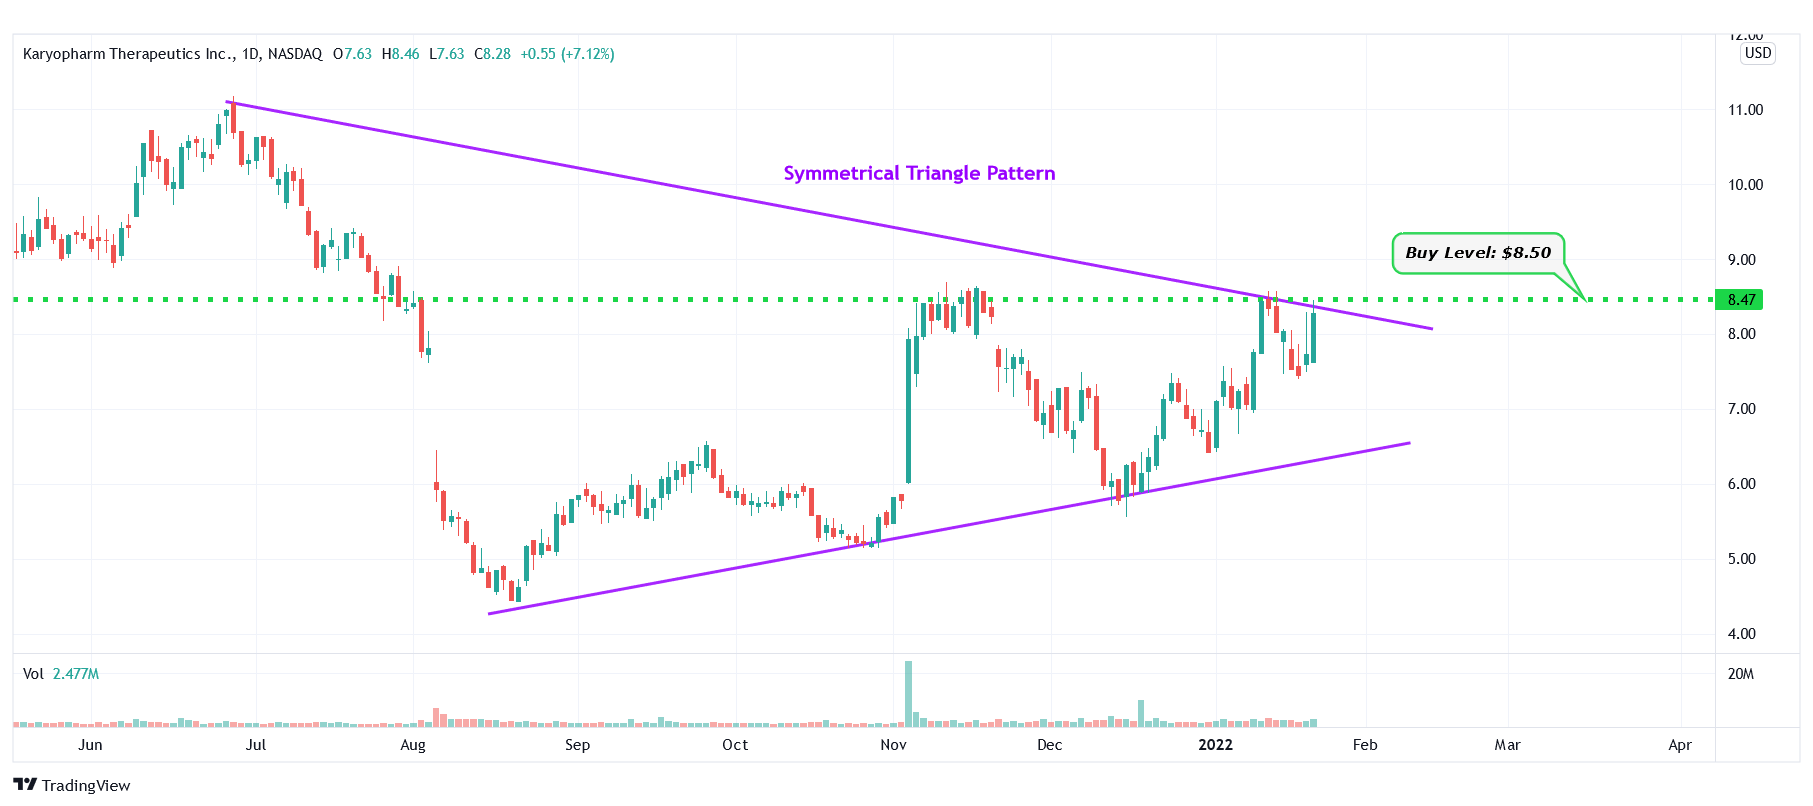
KPTI – Symmetrical Triangle Pattern
#3 Trip.com Group Limited (NASDAQ: TCOM)
Sector: Consumer Cyclical | Travel Services
Reason: Formation of a Falling Wedge Pattern
A falling wedge pattern is formed by joining two downward-sloping, converging trendlines having a contracting range. The pattern appears to be wide at the top and continues to contract as prices fall. A breakout from a falling wedge pattern can indicate either reversal or continuation depending on where the pattern appeared in the trend.
A stock that has broken out of a falling wedge pattern would have gained momentum and would have the potential to move higher.
Buy Level(s): The ideal buy level for TCOM is if the stock breaks out of the falling wedge pattern and closes above the nearest resistance level of $29.00. This is marked in the chart below as a green color dotted line.
Daily chart – TCOM
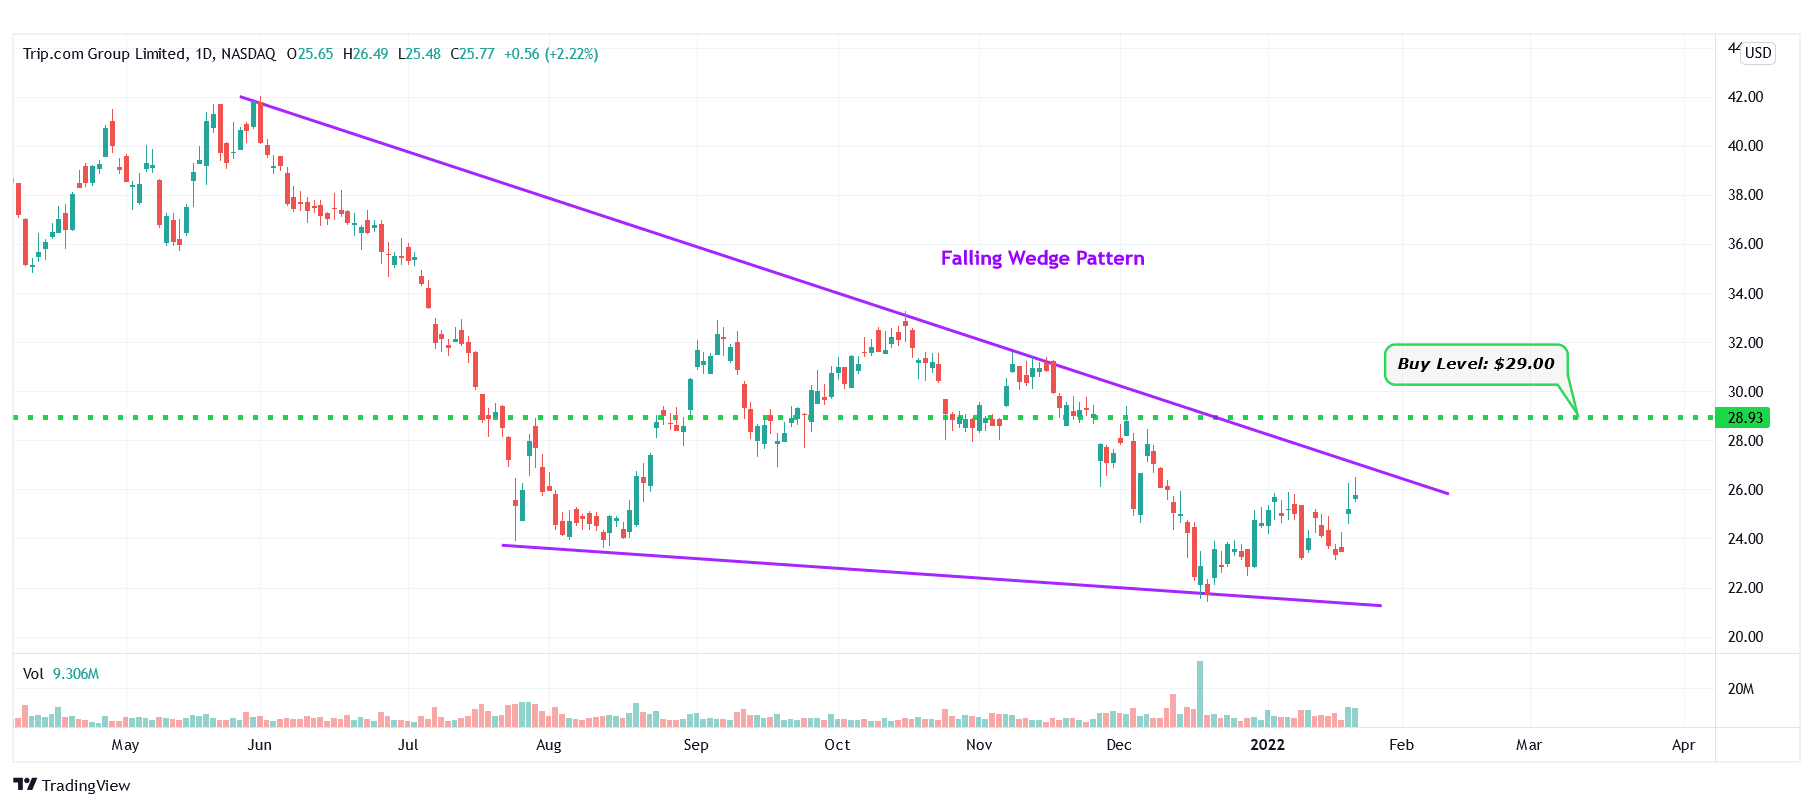
TCOM – Faling Wedge Pattern
#4 Dun & Bradstreet Holdings, Inc. (NYSE: DNB)
Sector: Technology | Information Technology Services
Reason: Formation of an Ascending Triangle Pattern
An ascending triangle pattern is a bullish pattern formed by drawing a horizontal line along the swing highs, and a rising trendline along the swing lows. These two lines result in the formation of a triangle. A breakout from this pattern is typically a strong bullish indication.
Buy Level(s): The ideal buy level for DNB is if the stock has a daily close above the breakout level of the ascending triangle pattern, at around $20.60. This is marked in the chart below as a green color dotted line.
Daily chart – DNB
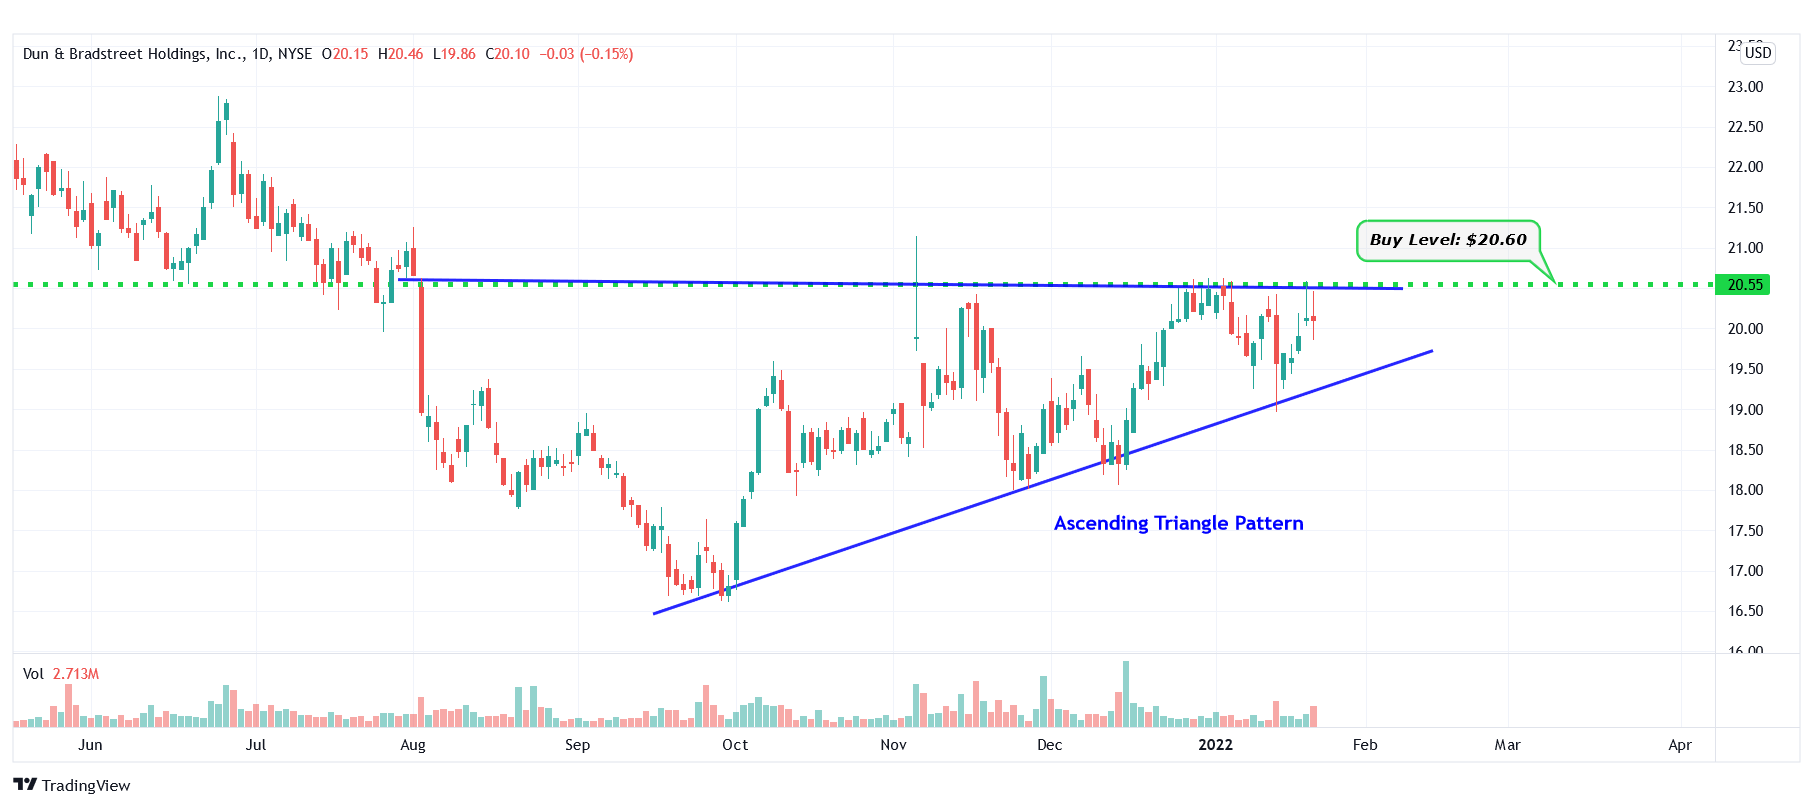
DNB – Ascending Triangle Pattern
#5 Peloton Interactive, Inc. (NASDAQ: PTON)
Sector: Consumer Cyclical | Leisure
Reason: Downtrend Channel Pattern
A downtrend or descending channel is the price action contained between downward sloping parallel lines. It is formed by two lines that are drawn by connecting the lower highs and lower lows of a stock’s price. Even though this is typically a bearish pattern, a breakout from the upper rail of this pattern is considered a good bullish indication.
Buy Level(s): The ideal buy level for PTON is if the stock breaks out of the downtrend channel and closes above the price of $58.40. This is marked in the chart below as a green color dotted line.
Daily chart – PTON
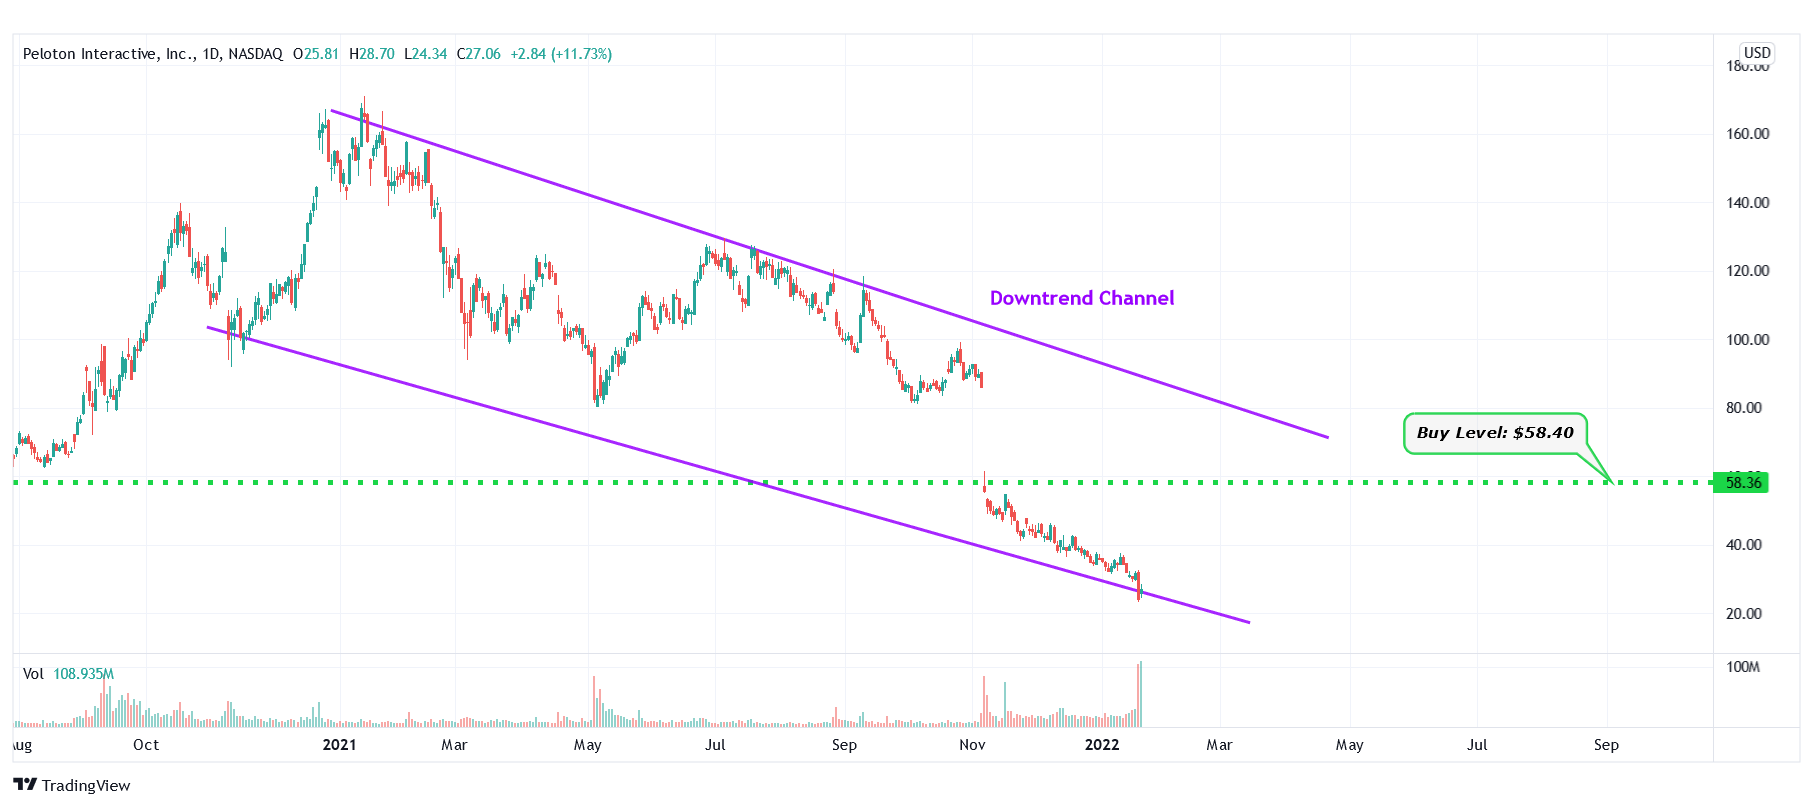
PTON – Downtrend Channel
#6 Azul S.A. (NYSE: AZUL)
Sector: Industrials | Airlines
Reason: Breakout From a Double Bottom Pattern
A Double Bottom Pattern looks like the letter W and is characterized by two well-defined lows at approximately the same price level. This twice-touched low is usually a very strong support level. The high point between the two bottoms’ resistance level is called a neckline. Once a breakout happens from this key price level (neckline), it signifies the start of a bullish move.
Buy Level(s): The stock has currently broken out of the double bottom pattern. However, the ideal buy level for AZUL is above the near-term resistance level of around $16.20. This is marked in the chart below as a green color dotted line.
Daily chart – AZUL
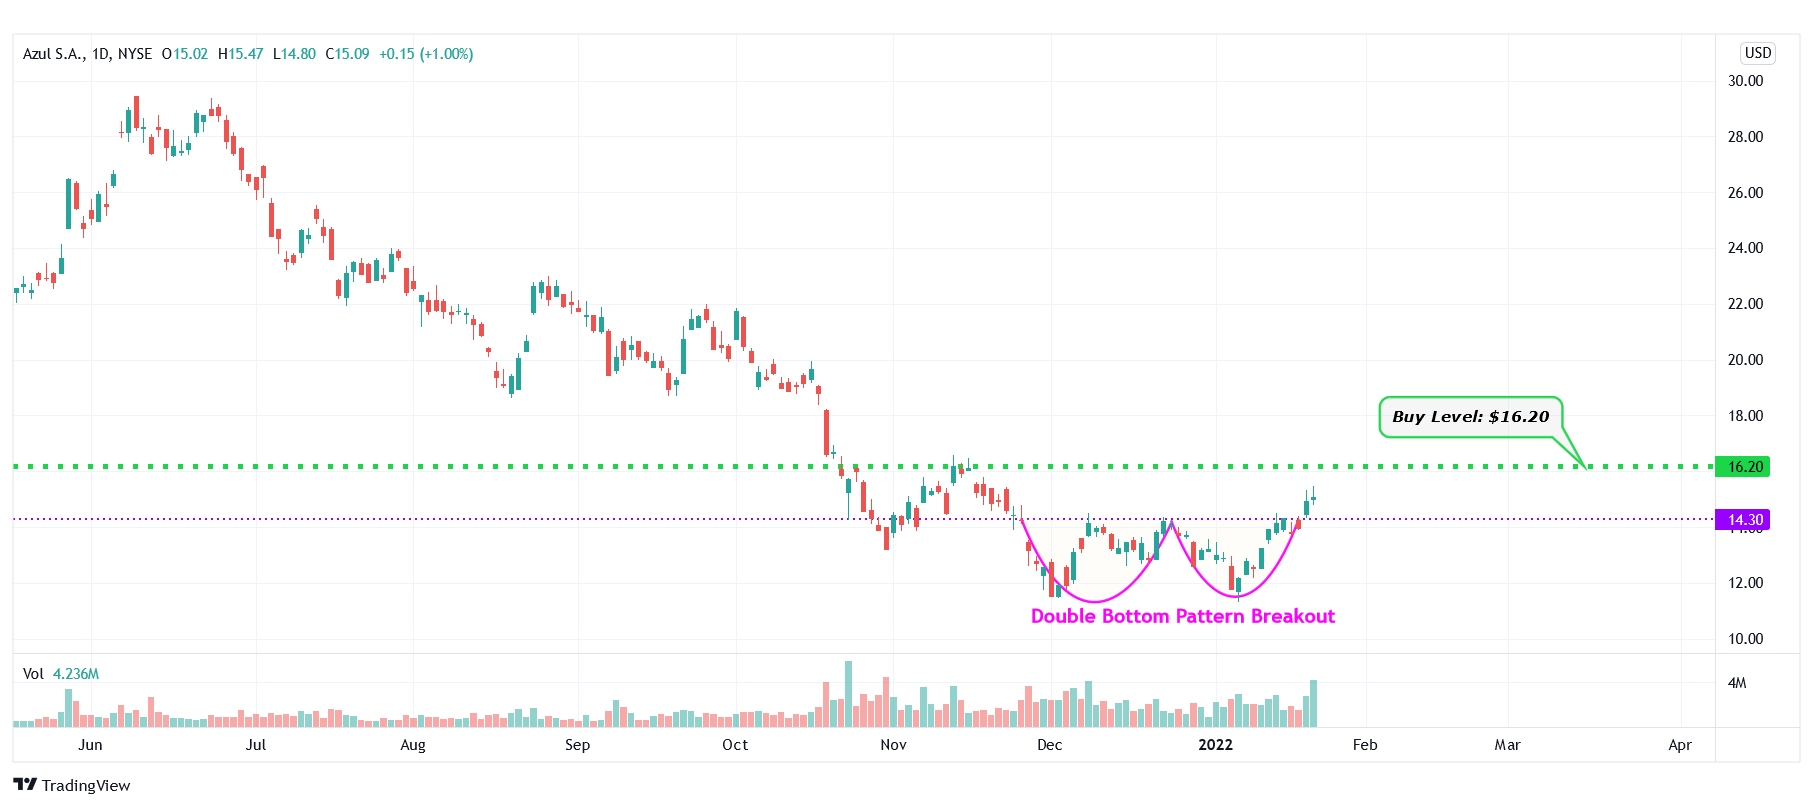
AZUL – Double Bottom Pattern Breakout
#7 Futu Holdings Limited (NASDAQ: FUTU)
Sector: Financial | Capital Markets
Reason: Falling Wedge Pattern Breakout
A falling wedge pattern is formed by joining two downward-sloping, converging trendlines having a contracting range. The pattern appears to be wide at the top and continues to contract as prices fall. A breakout from a falling wedge pattern can indicate either reversal or continuation depending on where the pattern appeared in the trend.
A stock that has broken out of a falling wedge pattern would have gained momentum and would have the potential to move higher.
Buy Level(s): The stock has currently broken out of a falling wedge pattern. However, the ideal buy level for FUTU is above the nearest resistance level of $49.90. This is marked in the chart below as a green color dotted line.
Daily chart – FUTU
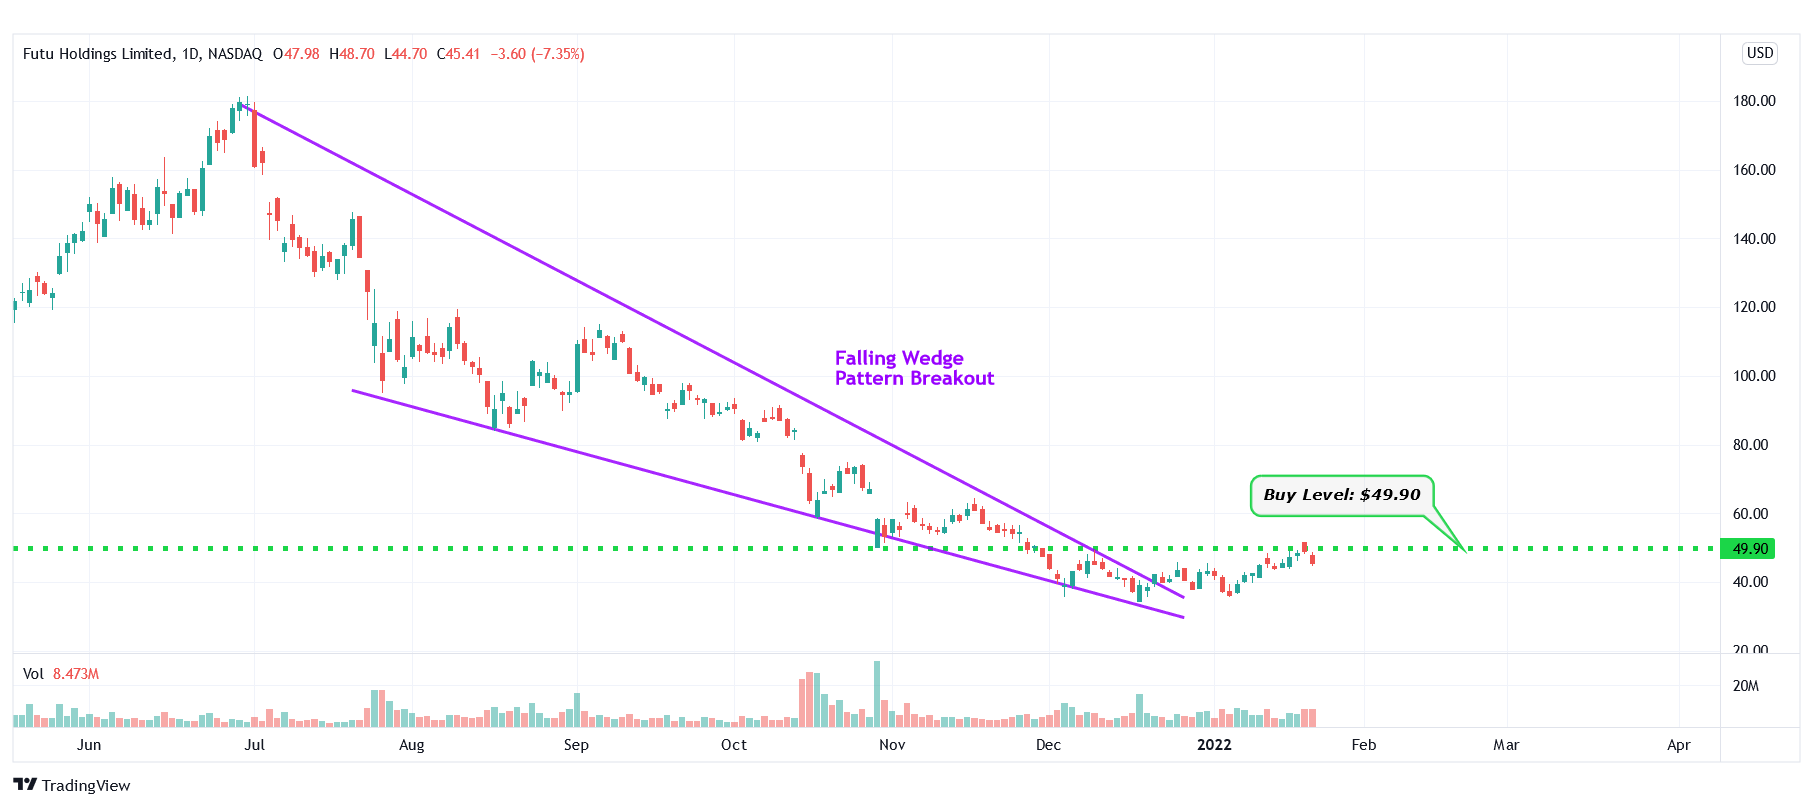
FUTU – Falling Wedge Pattern Breakout
#8 Companhia Paranaense de Energia – COPEL (NYSE: ELP)
Sector: Utilities | Utilities – Diversified
Reason: Formation of a Symmetrical Triangle Pattern
A symmetrical triangle is a chart pattern formed by two converging trend lines connecting a series of sequential peaks and troughs. These two lines result in the formation of a triangle that appears to be symmetrical.
A symmetrical triangle pattern is usually formed when there is an indecision in the price movements and there is uncertainty among the buyers and sellers. This chart pattern represents a period of consolidation before the price breaks out or breaks down. In case a breakout occurs from the upper trend line, it is a strong bullish indication as it signifies the start of a new bullish trend.
Buy Level(s): The ideal buy level for ELP is if the stock has a daily close above the breakout level of the symmetrical triangle pattern, at around $6.70. This is marked in the chart below as a green color dotted line.
Daily chart – ELP
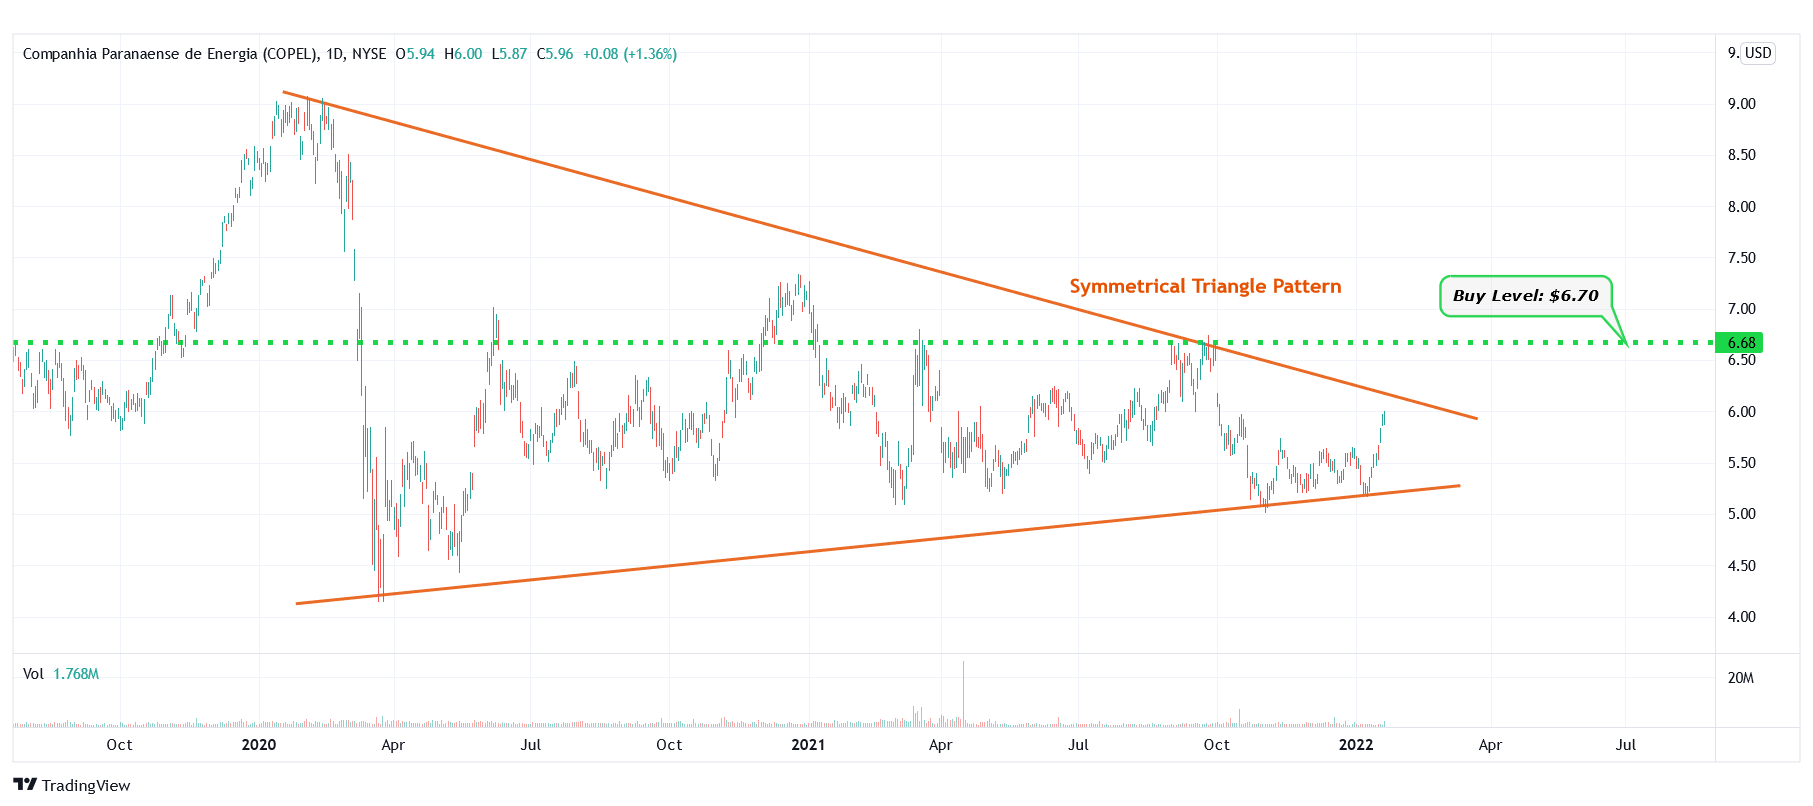
ELP – Symmetrical Triangle Pattern
#9 Centrais Eletricas Brasileiras S.A. (NYSE: EBR)
Sector: Utilities | Utilities – Regulated Electric
Reason: Downtrend Channel Breakout
A downtrend or descending channel is the price action contained between downward sloping parallel lines. It is formed by two lines that are drawn by connecting the lower highs and lower lows of a stock’s price. Even though this is typically a bearish pattern, a breakout from the upper rail of this pattern is considered a good bullish indication.
Buy Level(s): The daily chart shows that the stock has currently broken out of a downtrend channel. However, there is a near-term resistance level for the stock. Hence, the ideal buy level for EBR is if the stock has a daily close above $6.70. This is marked in the chart below as a green color dotted line.
Daily chart – EBR
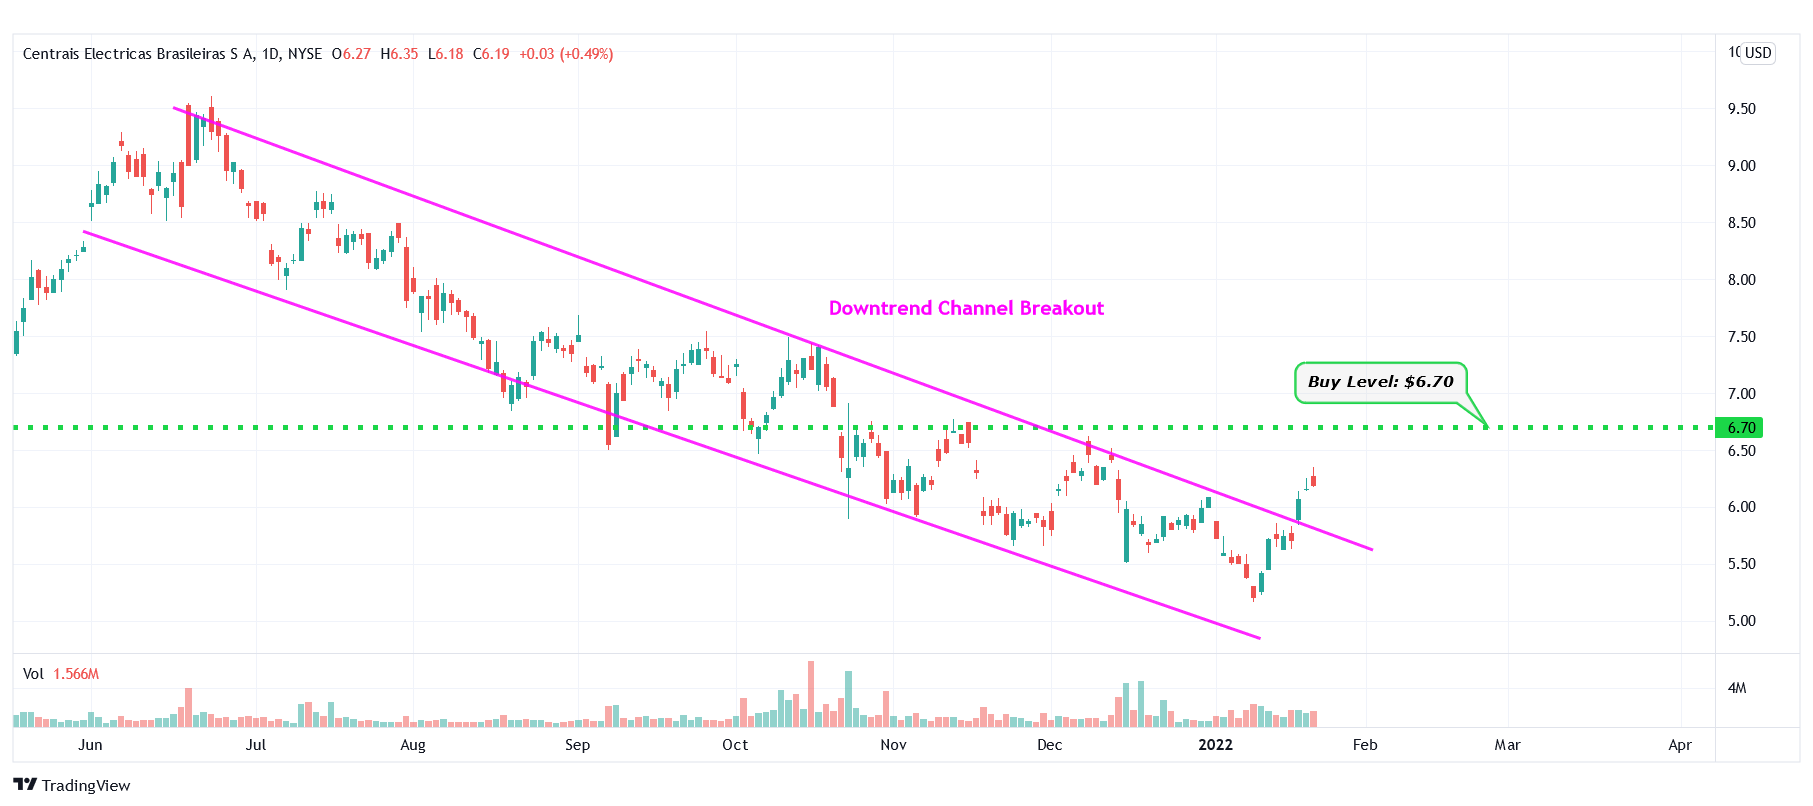
EBR – Downtrend Channel Breakout
#10 Mondelez International, Inc. (NASDAQ: MDLZ)
Sector: Consumer Defensive | Confectioners
Reason: Breakout From a Consolidation Area in the Daily Chart
A Consolidation Area is a price action contained between two parallel lines. It is formed by a lower line that connects the lows, and an upper line that joins the highs. A stock usually trades between the two lines of the consolidation area before finally breaking out from the upper rail.
Buy Level(s): Although the stock has currently broken out of a consolidation area, the ideal buy level for MDLZ is above the near-term resistance area, which translates to a price of around $68.60. This is marked in the chart below as a green color dotted line.
Daily chart – MDLZ
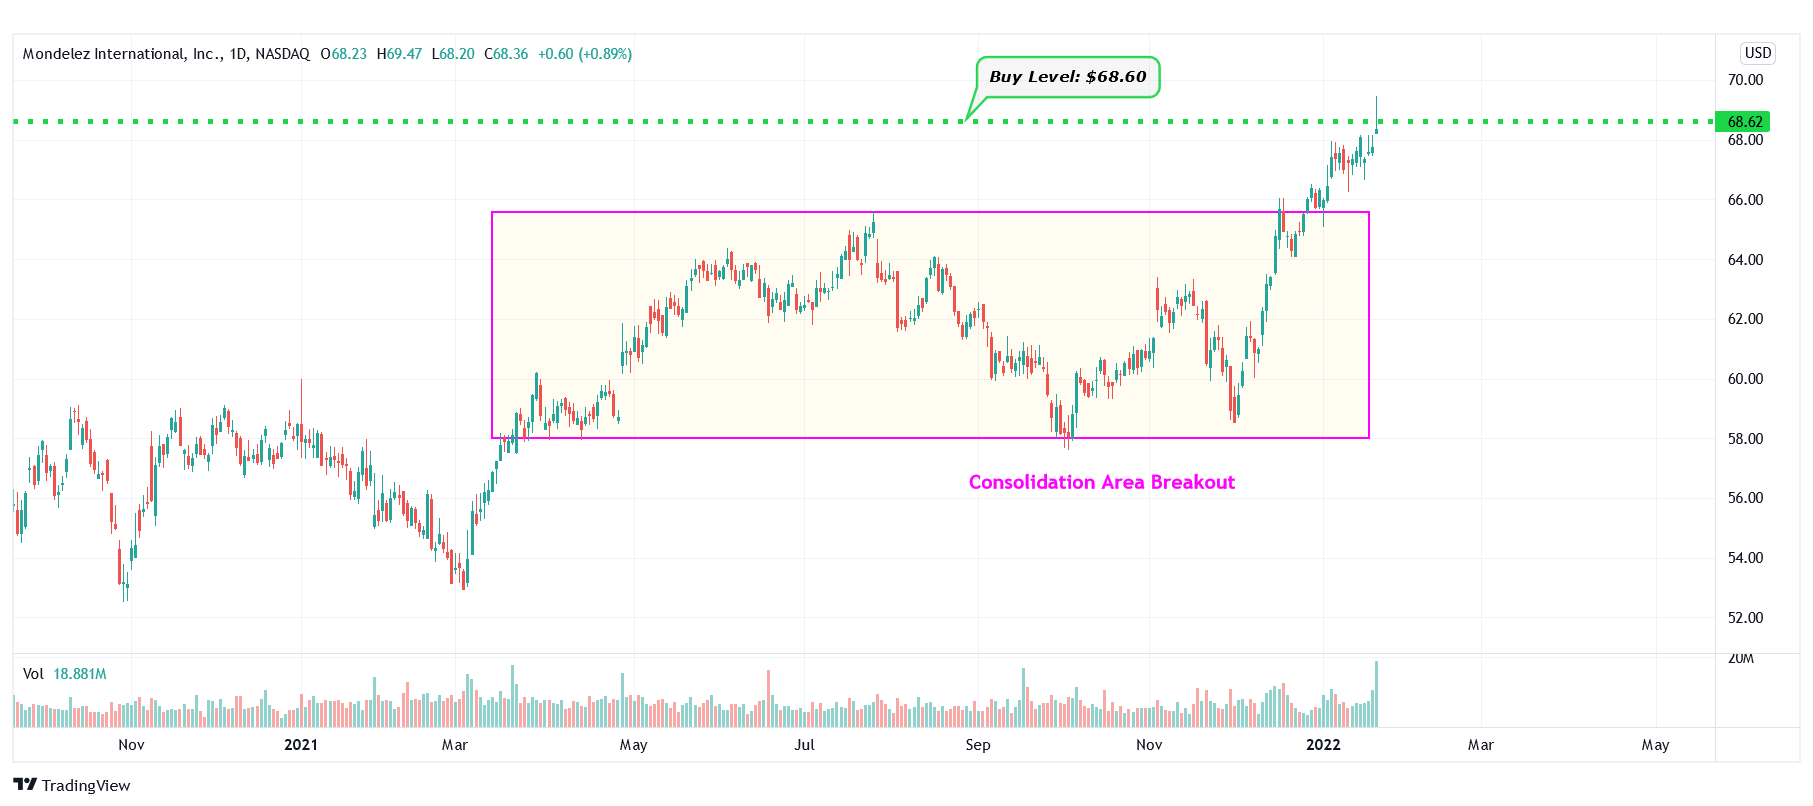
MDLZ – Consolidation Area Breakout
Happy Trading!
Trades of The Day Research Team
Motley Fool Stock Advisor's average stock pick is up over 350%*, beating the market by an incredible 4-1 margin. Here’s what you get if you join up with us today: Two new stock recommendations each month. A short list of Best Buys Now. Stocks we feel present the most timely buying opportunity, so you know what to focus on today. There's so much more, including a membership-fee-back guarantee. New members can join today for only $99/year.
Source: Trades of the Day
