

Picking a winning trade on a consistent basis is not simply a stroke of luck. It’s the result of calculated screening, planning, and deliberation.
With this in mind, we have started a new weekly series on our top 10 stocks to watch this week — stocks that look poised for a possible breakout in the coming days. Traders should add these stocks to their watchlist now.
The Top 10 Stocks to Watch This Week for Possible Breakouts
| Sl # | Name of the Stock | Stock Ticker | Last Close | Buy Level(s) | Reason |
| 1 | Molson Coors Beverage Company | NYSE: TAP | $51.69 | $52.30 | Falling Wedge Pattern Breakout |
| 2 | Digital World Acquisition Corp. | NASDAQ: DWAC | $70.88 | $73.30 | Symmetrical Triangle Pattern Breakout |
| 3 | The Southern Company | NYSE: SO | $68.66 | $68.80 | Double Bottom Pattern |
| 4 | Ovintiv Inc. | NYSE: OVV | $41.33 | $42.00 | Uptrend Channel |
| 5 | Vodafone Group Public Limited Company | NASDAQ: VOD | $16.45 | $17.00 | Falling Wedge Pattern Breakout |
| 6 | HollyFrontier Corporation | NYSE: HFC | $37.67 | $37.70 | Ascending Triangle Pattern |
| 7 | Morgan Stanley | NYSE: MS | $98.88 | $106.30 | Consolidation Area |
| 8 | Las Vegas Sands Corp. | NYSE: LVS | $42.99 | $44.60 | Symmetrical Triangle Pattern Breakout |
| 9 | Faraday Future Intelligent Electric Inc. | NASDAQ: FFIE | $5.65 | $6.70 | Downtrend Channel |
| 10 | Melco Resorts & Entertainment Limited | NASDAQ: MLCO | $11.10 | $11.70 | Falling Wedge Pattern Breakout |
Important: Typically, these trades offer a risk: reward ratio of 1:2 or 1:3 in the next 6 months, which implies 2x to 3x rewards when compared to risks. So, be sure to set your stop-loss levels and target prices accordingly to manage your risk. In addition, these trade ideas are triggered using daily closing prices, not intra-day pricing. So, if you participate in these trades, make sure that you only buy the stock once its daily close is above the recommended price level.
That said, here are the top 10 stocks to watch for a breakout, in no particular order.
#1 Molson Coors Beverage Company (NYSE: TAP)
Sector: Consumer Defensive | Beverages – Brewers
Reason: Falling Wedge Pattern Breakout
A falling wedge pattern is formed by joining two downward-sloping, converging trendlines having a contracting range. The pattern appears to be wide at the top and continues to contract as prices fall. A breakout from a falling wedge pattern can indicate either reversal or continuation depending on where the pattern appeared in the trend.
A stock that has broken out of a falling wedge pattern would have gained momentum and would have the potential to move higher.
Buy Level(s): The stock has currently broken out of a falling wedge pattern. However, the ideal buy level for TAP is above the nearest resistance level of $52.30. This is marked in the chart below as a green color dotted line.
Daily chart – TAP

TAP – Falling Wedge Pattern Breakout
#2 Digital World Acquisition Corp. (NASDAQ: DWAC)
Sector: Financial | Shell Companies
Reason: Symmetrical Triangle Pattern Breakout
A symmetrical triangle is a chart pattern formed by two converging trend lines connecting a series of sequential peaks and troughs. These two lines result in the formation of a triangle that appears to be symmetrical.
A symmetrical triangle pattern is usually formed when there is an indecision in the price movements and there is uncertainty among the buyers and sellers. This chart pattern represents a period of consolidation before the price breaks out or breaks down. In case a breakout occurs from the upper trend line, it is a strong bullish indication as it signifies the start of a new bullish trend.
Buy Level(s): The stock has currently broken out of a symmetrical triangle pattern. However, the ideal buy level for DWAC is if the stock closes above the immediate resistance level of $73.30. This is marked in the chart below as a green color dotted line.
Daily chart – DWAC
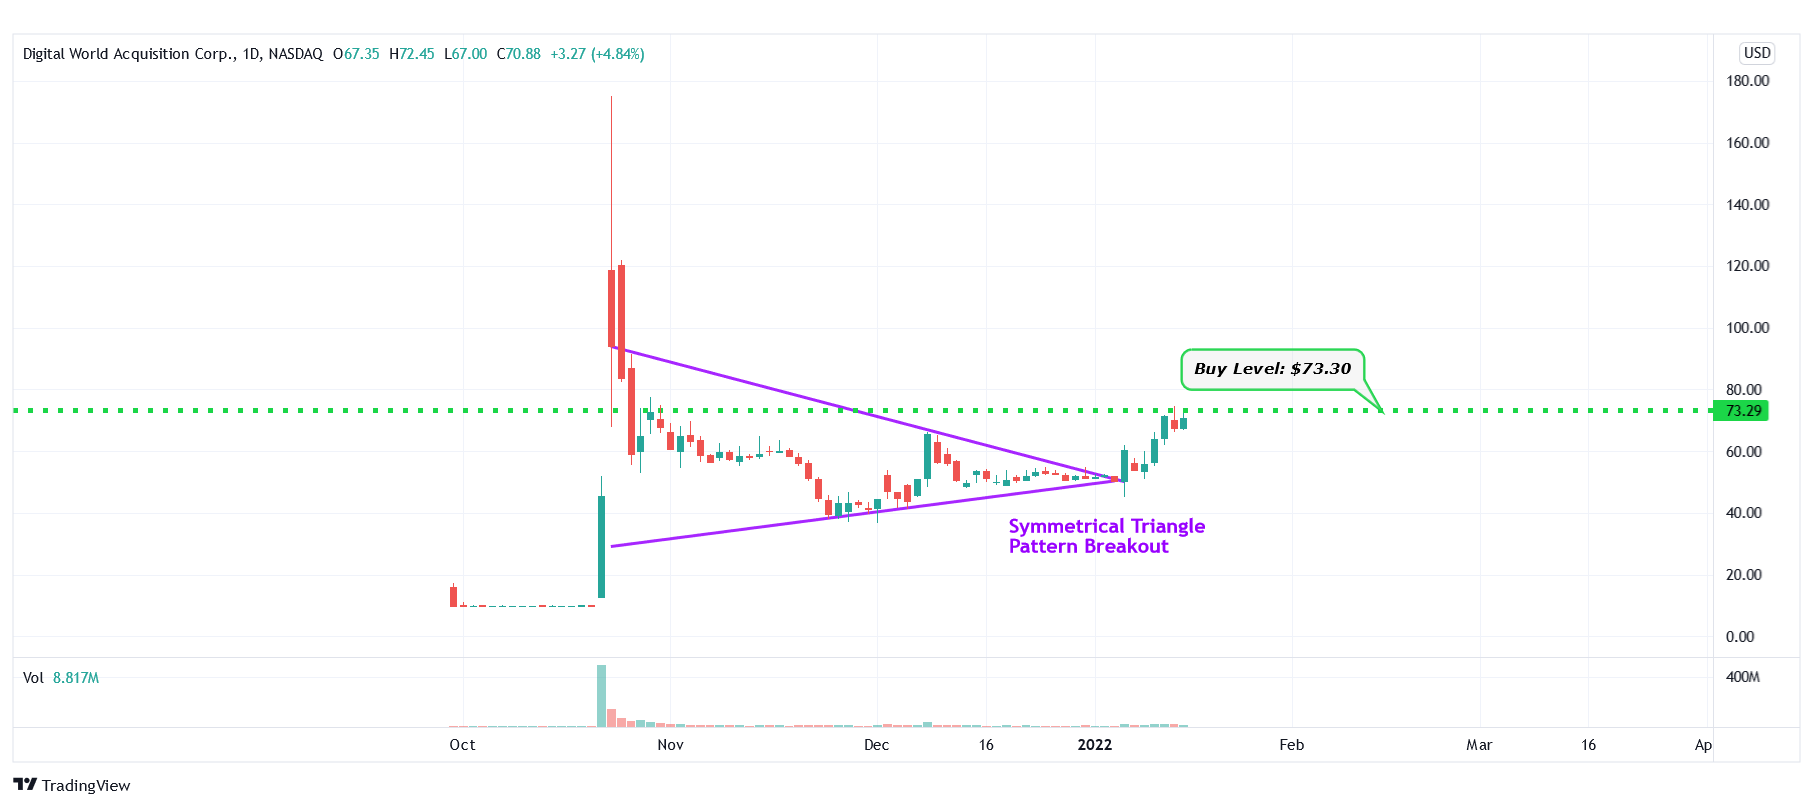
DWAC – Symmetrical Triangle Pattern Breakout
#3 The Southern Company (NYSE: SO)
Sector: Utilities | Utilities – Regulated Electric
Reason: Formation of a Double Bottom Pattern
A Double Bottom Pattern looks like the letter W and is characterized by two well-defined lows at approximately the same price level. This twice-touched low is usually a very strong support level. The high point between the two bottoms’ resistance level is called a neckline. Once a breakout happens from this key price level (neckline), it signifies the start of a bullish move.
Buy Level(s): The ideal buy level for SO is above the neckline of the double bottom pattern, at around $68.80. This is marked in the chart below as a green color dotted line.
Daily chart – SO
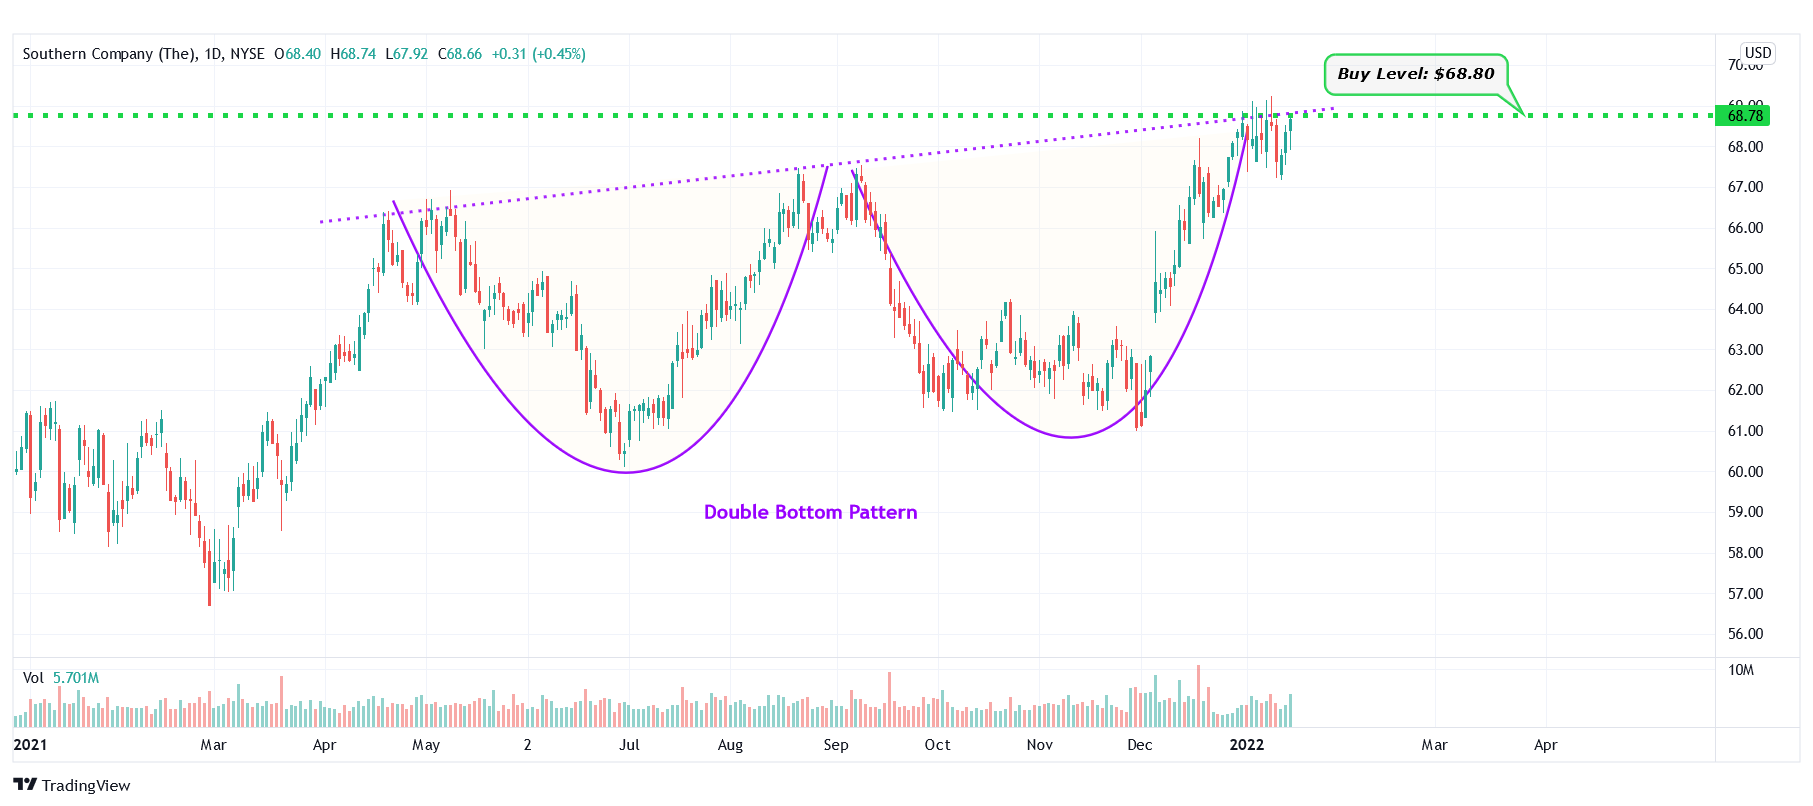
SO – Double Bottom Pattern
#4 Ovintiv Inc. (NYSE: OVV)
Sector: Energy | Oil & Gas E&P
Reason: Formation of an Uptrend Channel
An uptrend channel or an ascending channel is the price action contained between upward sloping parallel lines. It is formed by a lower trend line that connects the swing lows, and an upper channel line that joins the swing highs. A stock usually trades between the two rails of the uptrend channel before finally breaking out from the upper rail.
Buy Level(s): The ideal buy level for OVV is if the stock breaks out of the uptrend channel and has a daily close above $42.00. This is marked in the chart below as a green color dotted line.
Daily chart – OVV

OVV – Uptrend Channel
#5 Vodafone Group Public Limited Company (NASDAQ: VOD)
Sector: Communication Services | Telecom Services
Reason: Falling Wedge Pattern Breakout
A falling wedge pattern is formed by joining two downward-sloping, converging trendlines having a contracting range. The pattern appears to be wide at the top and continues to contract as prices fall. A breakout from a falling wedge pattern can indicate either reversal or continuation depending on where the pattern appeared in the trend.
A stock that has broken out of a falling wedge pattern would have gained momentum and would have the potential to move higher.
Buy Level(s): The stock has currently broken out of a falling wedge pattern. However, the ideal buy level for VOD is above the nearest resistance level of $17.00. This is marked in the chart below as a green color dotted line.
Daily chart – VOD
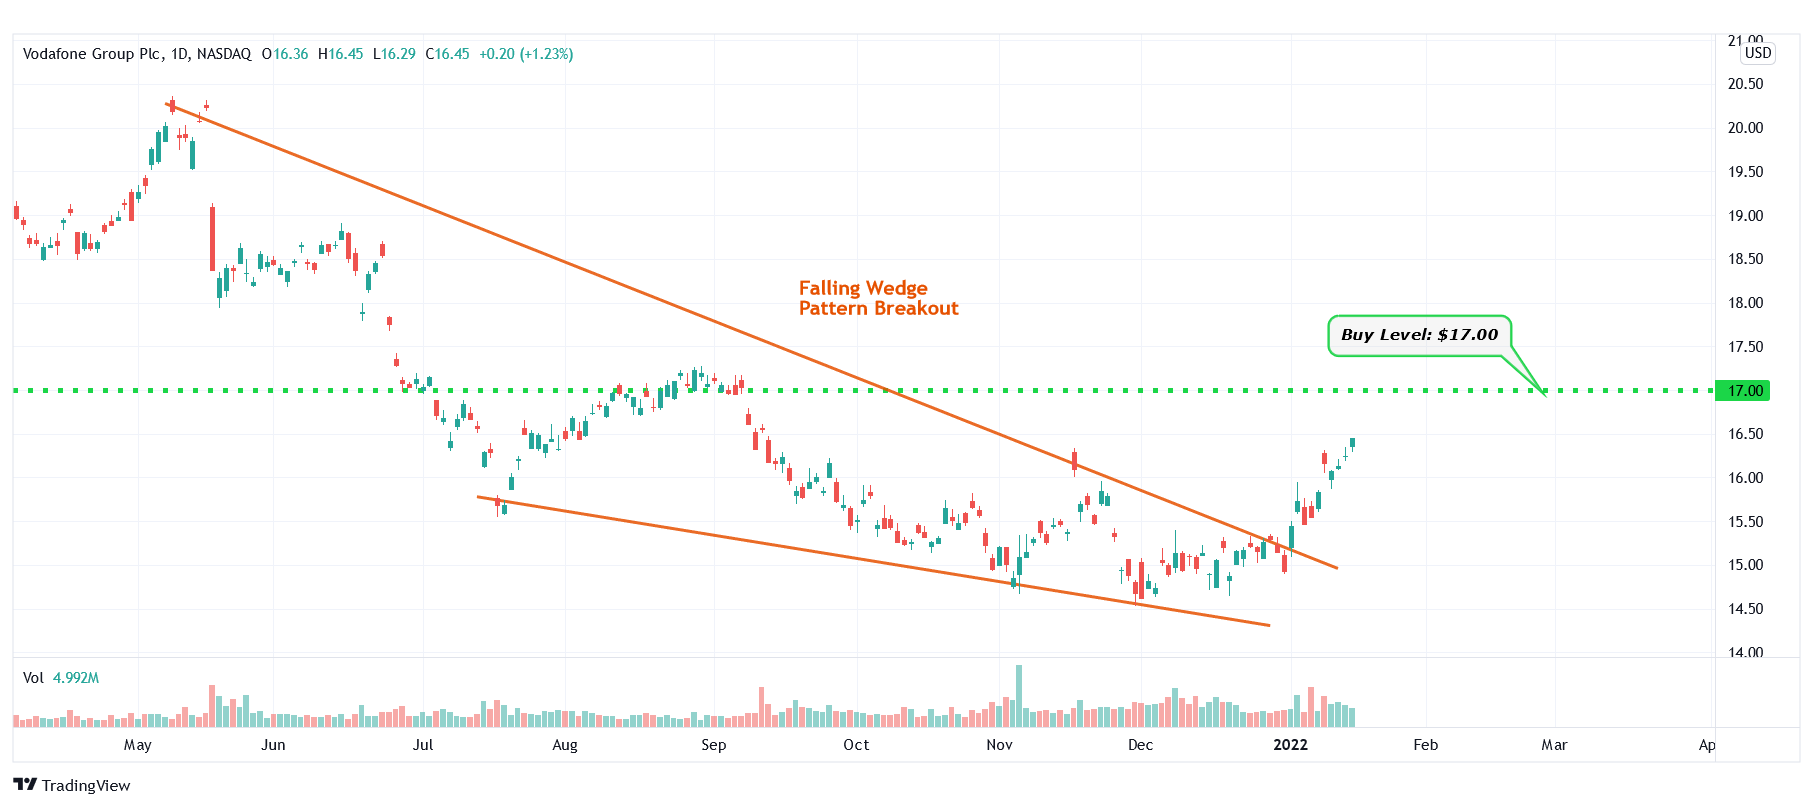
VOD – Falling Wedge Pattern Breakout
#6 HollyFrontier Corporation (NYSE: HFC)
Sector: Energy | Oil & Gas Refining & Marketing
Reason: Formation of an Ascending Triangle Pattern
An ascending triangle pattern is a bullish pattern formed by drawing a horizontal line along the swing highs, and a rising trendline along the swing lows. These two lines result in the formation of a triangle. A breakout from this pattern is typically a strong bullish indication.
Buy Level(s): The ideal buy level for HFC is if the stock has a daily close above the breakout level of the ascending triangle pattern, at around $37.70. This is marked in the chart below as a green color dotted line.
Daily chart – HFC
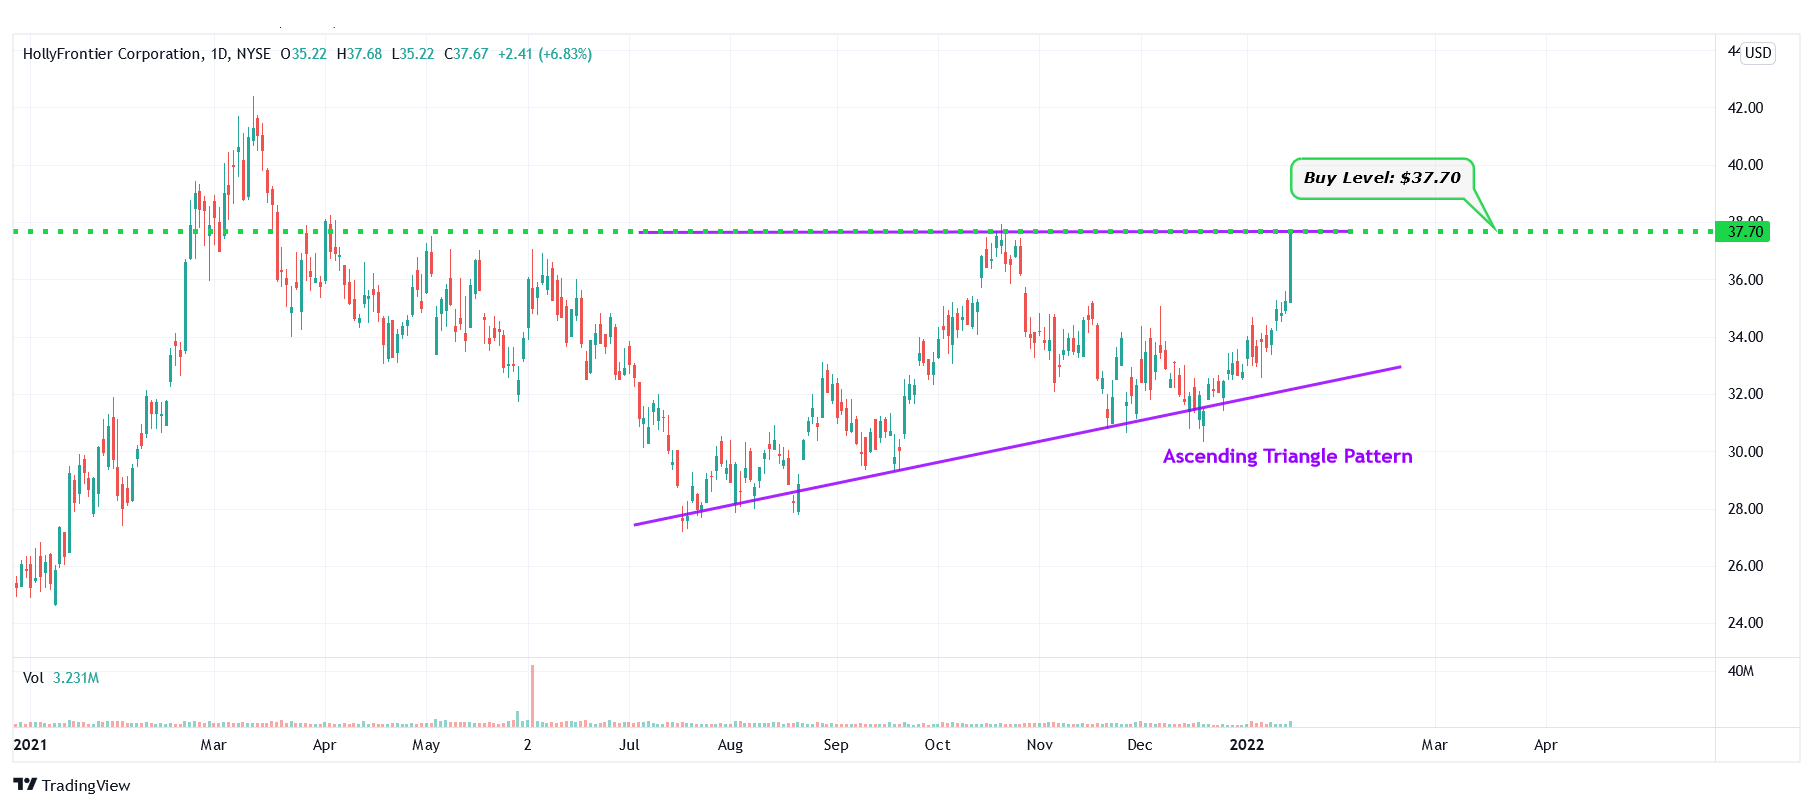
HFC – Ascending Triangle Pattern
#7 Morgan Stanley (NYSE: MS)
Sector: Financial | Capital Markets
Reason: Formation of a Consolidation Area
A Consolidation Area is a price action contained between two parallel lines. It is formed by a lower line that connects the lows, and an upper line that joins the highs. A stock usually trades between the two lines of the consolidation area before finally breaking out from the upper rail.
Buy Level(s): The ideal buy level for MS is above the breakout level of the consolidation area, at around $106.30. This is marked in the chart below as a green color dotted line.
Daily chart – MS

MS – Consolidation Area
#8 Las Vegas Sands Corp. (NYSE: LVS)
Sector: Consumer Cyclical | Resorts & Casinos
Reason: Symmetrical Triangle Pattern Breakout
A symmetrical triangle is a chart pattern formed by two converging trend lines connecting a series of sequential peaks and troughs. These two lines result in the formation of a triangle that appears to be symmetrical.
A symmetrical triangle pattern is usually formed when there is an indecision in the price movements and there is uncertainty among the buyers and sellers. This chart pattern represents a period of consolidation before the price breaks out or breaks down. In case a breakout occurs from the upper trend line, it is a strong bullish indication as it signifies the start of a new bullish trend.
Buy Level(s): The stock has currently broken out of a symmetrical triangle pattern. However, the ideal buy level for LVS is if the stock closes above the immediate resistance level of $44.60. This is marked in the chart below as a green color dotted line.
Daily chart – LVS

LVS – Symmetrical Triangle Pattern Breakout
#9 Faraday Future Intelligent Electric Inc. (NASDAQ: FFIE)
Sector: Consumer Cyclical | Auto Manufacturers
Reason: Formation of a Downtrend Channel
A downtrend or descending channel is the price action contained between downward sloping parallel lines. It is formed by two lines that are drawn by connecting the lower highs and lower lows of a stock’s price. Even though this is typically a bearish pattern, a breakout from the upper rail of this pattern is considered a good bullish indication.
Buy Level(s): The ideal buy level for FFIE is if the stock has a daily close above the breakout level of the downtrend channel and closes above the immediate resistance area, at around $6.70. This is marked in the chart below as a green color dotted line.
Daily chart – FFIE
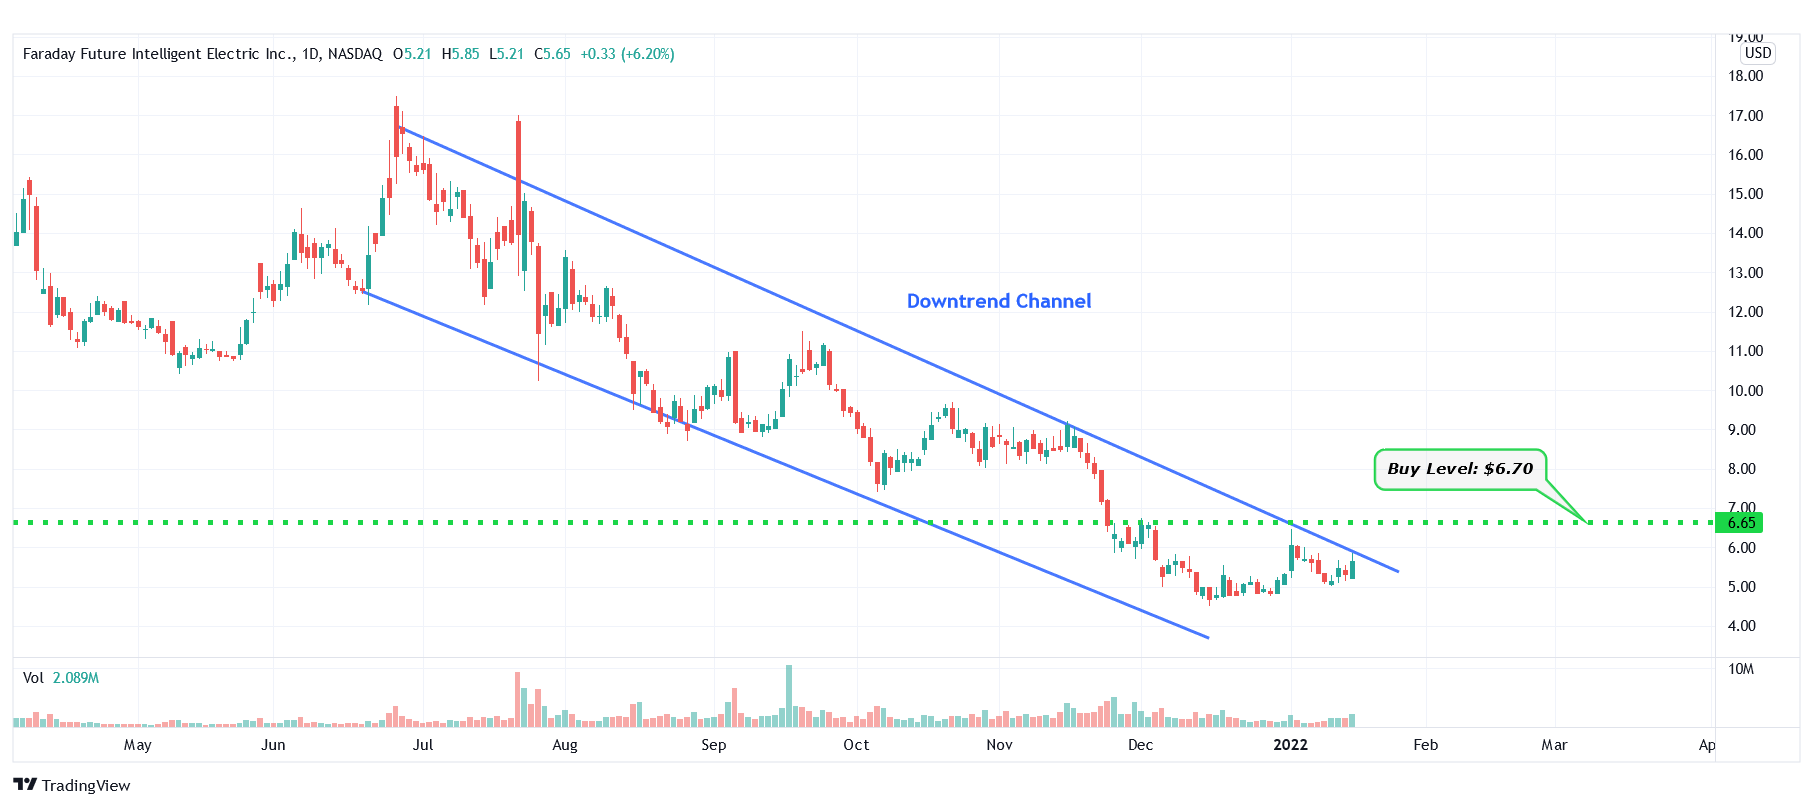
FFIE – Downtrend Channel
#10 Melco Resorts & Entertainment Limited (NASDAQ: MLCO)
Sector: Consumer Cyclical | Resorts & Casinos
Reason: Falling Wedge Pattern Breakout
A falling wedge pattern is formed by joining two downward-sloping, converging trendlines having a contracting range. The pattern appears to be wide at the top and continues to contract as prices fall. A breakout from a falling wedge pattern can indicate either reversal or continuation depending on where the pattern appeared in the trend.
A stock that has broken out of a falling wedge pattern would have gained momentum and would have the potential to move higher.
Buy Level(s): The stock has currently broken out of a falling wedge pattern. However, the ideal buy level for MLCO is above the nearest resistance level of $11.70. This is marked in the chart below as a green color dotted line.
Daily chart – MLCO
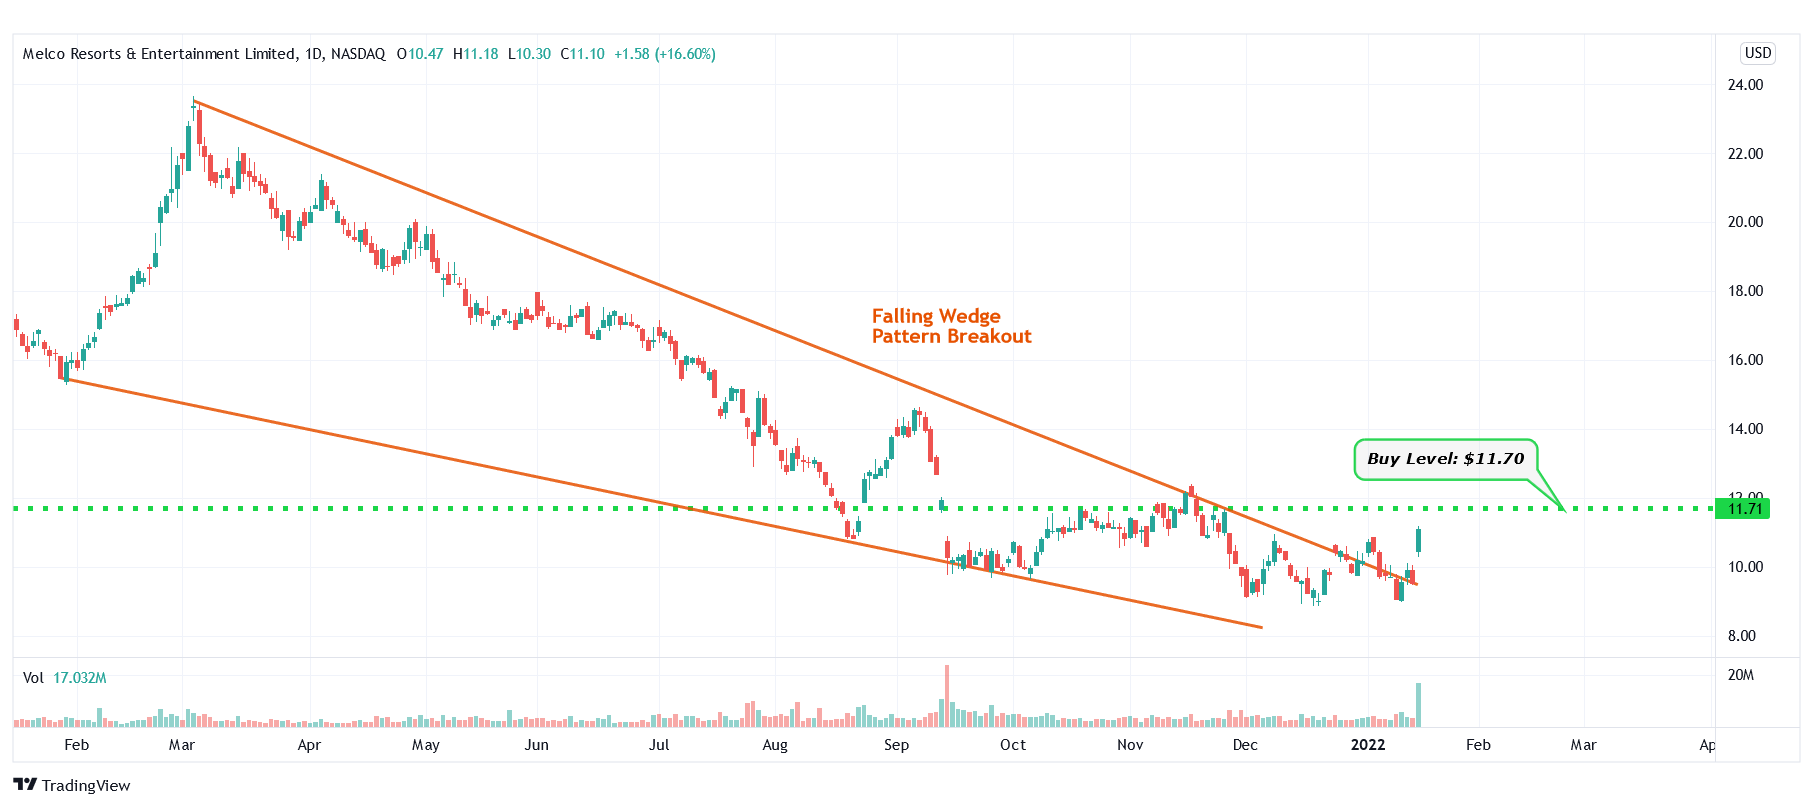
MLCO – Falling Wedge Pattern Breakout
Happy Trading!
— Trades of The Day Research Team
The goal? To build a reliable, growing income stream by making regular investments in high-quality dividend-paying companies. Click here to access our Income Builder Portfolio and see what we’re buying this month.
Source: Trades of the Day
