
The real estate investment trust which owns a diverse portfolio of hotels and net lease service and necessity-based retail properties across the United States and in Puerto Rico and Canada, Service Properties Trust (NASDAQ: SVC) seems to be gearing up for a surge as per its latest charts.
Bullish Indications
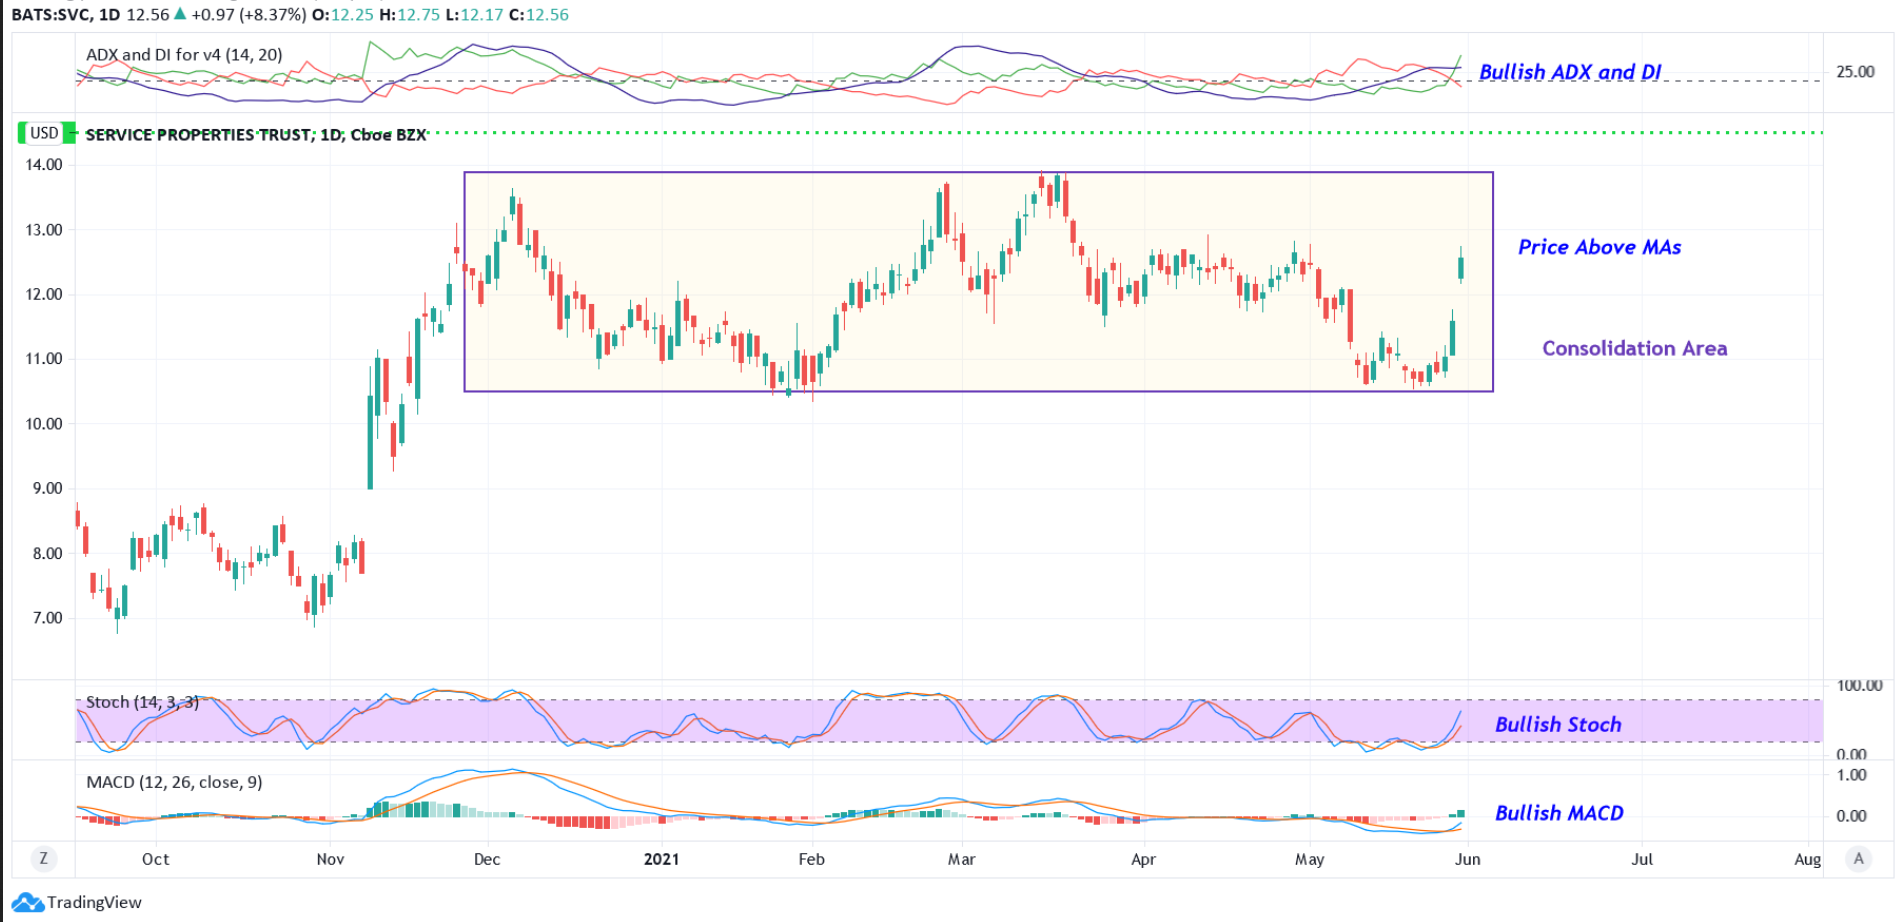
#1 Consolidation Area: As you can see from the daily chart, the stock was trading within a range for the past several months. This indicates consolidation. The consolidation area is marked as a purple color rectangle in the chart. Currently, the stock looks poised for a breakout from this consolidation area. A breakout from a consolidation area generally indicates bullishness.
Daily Chart – SVC
#2 Trading above MAs: The price is currently above its short-term moving average of 50-day SMA as well as the longer-time moving average of 200-day SMA. This implies a possible bullish bias for the stock.
#3 MACD above Signal Line: The daily chart shows that the MACD line (blue color) is currently above the MACD signal line (orange color). This is a possible bullish setup.
#4 Bullish ADX and DI: The ADX line has started to move up from below –DI and +DI lines. The +DI line and the ADX lines are also currently above the –DI line. This indicates possible bullishness.
#5 Bullish Stoch: The %K line of the stochastic is currently above the %D line in the daily chart, indicating possible bullishness.
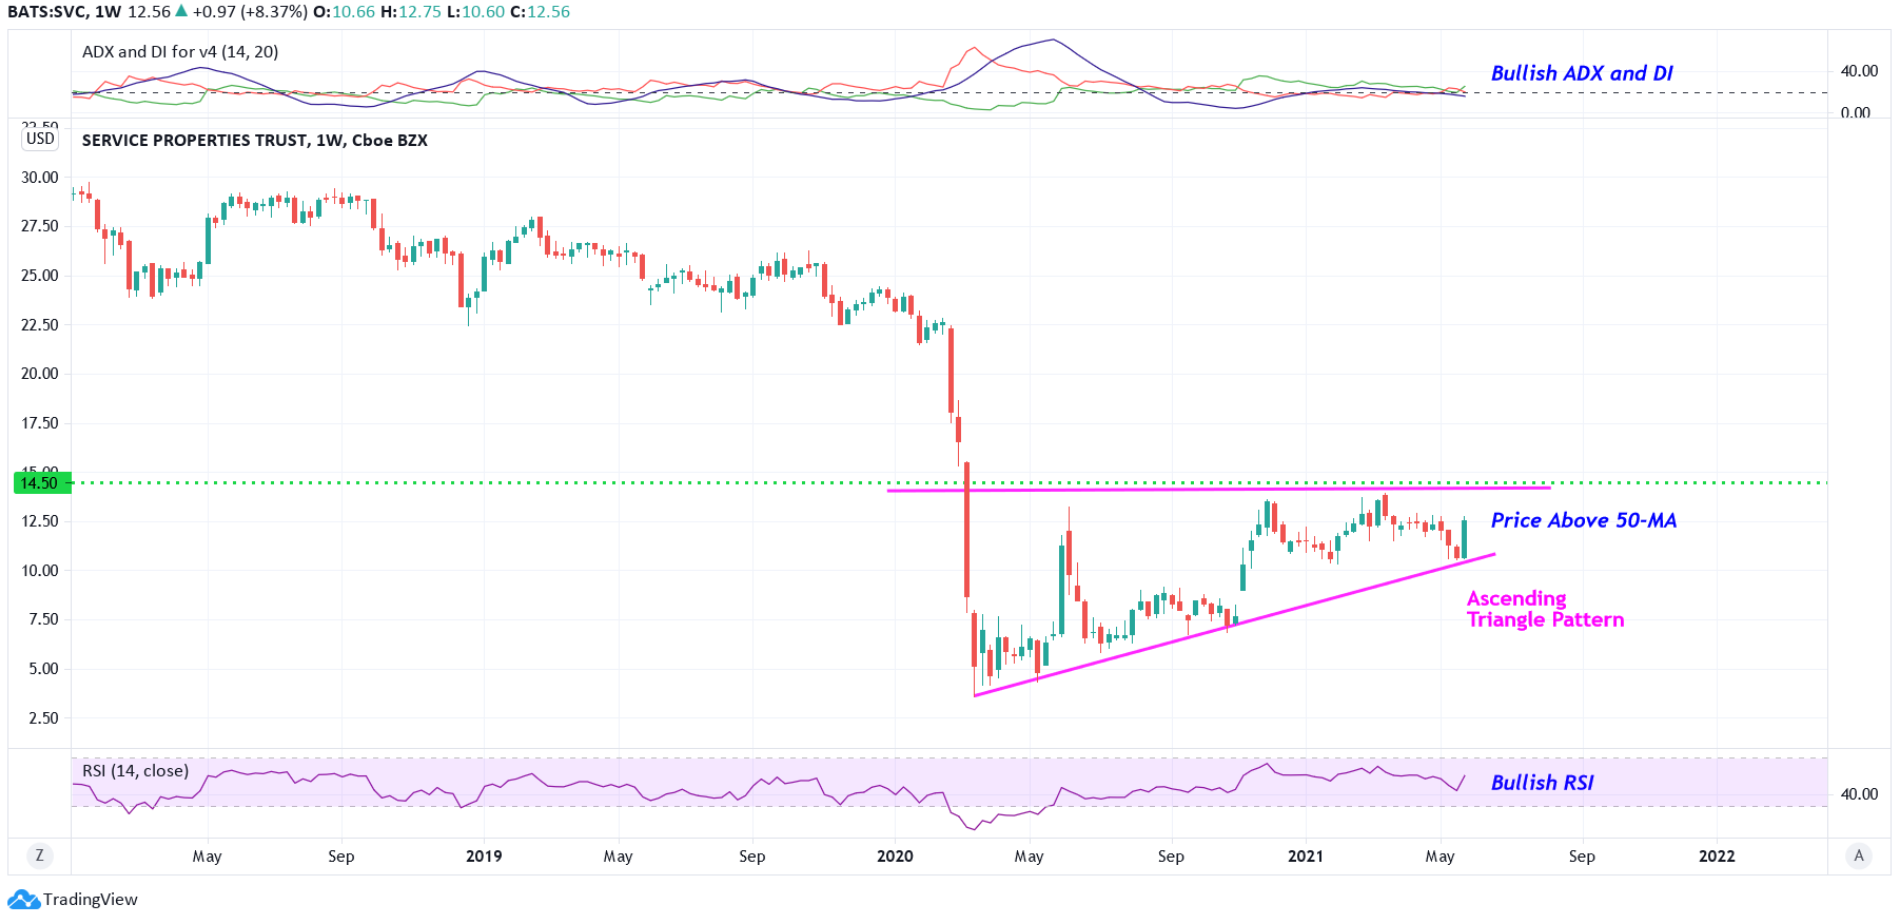
#6 Ascending Triangle Pattern: The weekly chart shows that the stock is currently forming an Ascending Triangle pattern. An Ascending Triangle pattern is a bullish pattern. This is marked on the chart in pink color lines. A breakout from this pattern typically indicates bullishness. The base of the triangle generally acts as a good support level after the breakout. The stock is also trading above the 50-week SMA, indicating that the bulls are currently in control.
Weekly Chart – SVC
#7 Bullish RSI: The RSI is currently above 50 and moving higher, indicating the strength of the current upmove.
Recommended Trade (based on the charts)
Buy Levels: If you want to get in on this trade, the ideal buy level for SVC is above the price of around $14.50.
TP: Our target prices are $18 and $22 in the next 3-6 months.
SL: To limit risk, place a stop loss at $12.30. Note that this stop loss is on a closing basis.
Our target potential upside is nearly 24% to 52% in the next 3-6 months.
For a risk of $2.20, the target rewards are $3.50 and $7.50. This is a nearly 1:2 and 1:3 risk-reward trade.
In other words, this trade offers nearly 2x to 3x more potential upside than downside.
Risks to Consider
The stock may reverse its overall trend if it breaks down with high volume from the ascending triangle pattern. The sell-off of the stock could also be triggered in case of any negative news, overall weakness in the market, or any regulatory changes in its sector.
Happy Trading!
— Tara
