
The company that provides lending enablement and risk analytics solutions to credit unions, regional banks, and captive finance companies of original equipment manufacturers in the United States, Open Lending Corp (NASDAQ: LPRO) seems to be getting ready for a surge as per its latest charts.
Bullish Indications
#1 Flag Pattern Breakout: As seen from the daily chart, the stock was in a strong uptrend after which it started consolidating and was in a narrowing range. This is a classic flag pattern and is marked in the chart in pink color. A flag is a continuation pattern. Whenever a stock breaks out of this pattern, it usually continues its previous trend (uptrend in this case). The stock has currently broken out of the flag pattern, which is typically a bullish sign.

Daily Chart – LPRO
#2 Trading Above MA: The stock is currently trading above its long-term moving average of 200-day SMA as well as the short-term moving average of 50-day SMA, which implies that the bulls are currently in control.
#3 Bullish Stoch: The %K line is above the %D line of the stochastic in the daily chart, indicating possible bullishness.
#4 Bullish ADX and DI: The ADX indicator shows bullishness because (+DI) is currently greater than (-DI), and ADX has started to move up from below (-DI) and (+DI).
#5 Bullish RSI: The RSI is currently above 50 and moving higher, indicating possible bullishness.
#6 Fibonacci Support: Usually, after an up-move, stocks retrace to any of the key Fibonacci levels before surging back again. The stock’s weekly chart shows that it had taken support at the 78.6% Fibonacci support level of the upmove and started to move higher. This is marked in purple color. An upmove from a Fibonacci support level is usually a bullish indication.
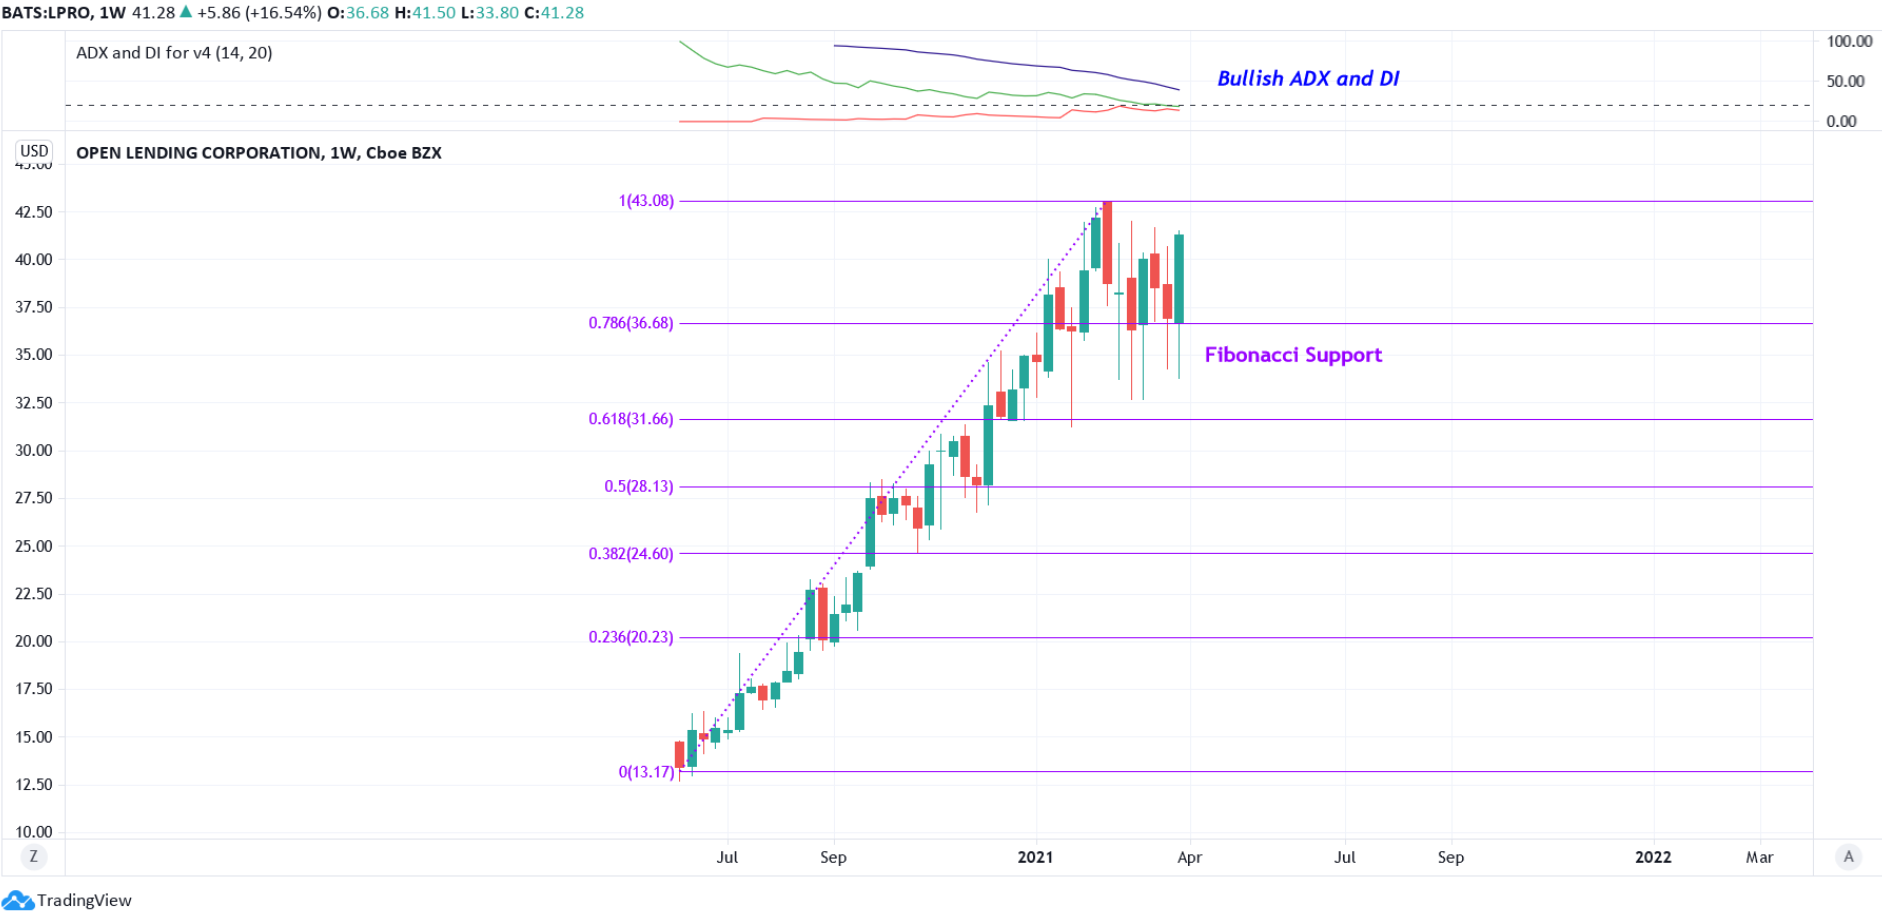
Weekly Chart – LPRO
#7 Bullish ADX and DI: In the weekly chart as well, the +DI is currently above the -DI line. The ADX line has also moved higher from both the +DI line as well as the -DI line. All these are possible bullish indications.
Recommended Trade (based on the charts)
Buy Levels: If you want to get in on this trade, the ideal buy level for LPRO is if it trades above Thursday’s high, at around $41.60.
TP: Our target prices are $47 and $54 in the next 3-5 months.
SL: To limit risk, place a stop loss near $38.10. Note that this stop loss is on a closing basis.
Our target potential upside is nearly 13% to 30% in the next 3-5 months.
For a risk of $3.50, the target rewards are $5.40 and $12.40. This is a nearly 1:2 and 1:4 risk-reward trade.
In other words, this trade offers nearly 2x to 4x more potential upside than downside.
Risks to Consider
The stock may reverse its overall trend if it breaks down with high volume from the flag pattern and the Fibonacci support level. The sell-off of the stock could also be triggered in case of any negative news, overall weakness in the market, or any regulatory changes in its sector.
Happy Trading!
— Tara
