
The coronavirus crash wiped out 35% of the market’s value this spring. But with stocks back at all-time highs and the pandemic still crippling the economy, investors are concerned a second stock market crash could be on its way.
We want our readers to be fully informed about the market and its risks, so we’re going to look at the evidence. While we can’t predict the future, one of the best tools we have can help us tell if the stock market is overheated.
And it’s showing stocks are more overvalued than they’ve been since 1971…
The stock market capitalization-to-GDP ratio is used to determine whether the stock market is undervalued or overvalued compared to its historical average.
Known as the “Buffett Indicator” – after the legendary investor Warren Buffett popularized its use over the years – it’s one of the most popular methods used to determine where U.S. stocks are likely headed next.
In simple terms, the ratio compares the total market cap of all U.S. publicly traded stocks with GDP.
More specifically, it calculates the total value of the outstanding shares of all publicly traded companies in the United States and divides that number by total GDP.
For example, the total market cap of all U.S. stocks is about $37 trillion.
So, if U.S. GDP was the same, stocks would be considered modestly overvalued at a ratio of 100% ($37 trillion / $37 trillion = 100%).
Here are the general ratio parameters most investors follow.
If the stock market-cap-to-GDP ratio falls between 50% and 75%, the market is considered modestly undervalued.
The market is fairly valued when the ratio falls between 75% and 90%.
And it’s moderately overvalued if it falls between the range of 90% and 115%.
We’re going to use this metric to see if stocks are so overvalued that a stock market crash is possible.
Let’s dig in…
What the “Buffett Indicator” Is Telling Us Today
According to the “Buffett Indicator,” the U.S. stock market is very overvalued relative to GDP.
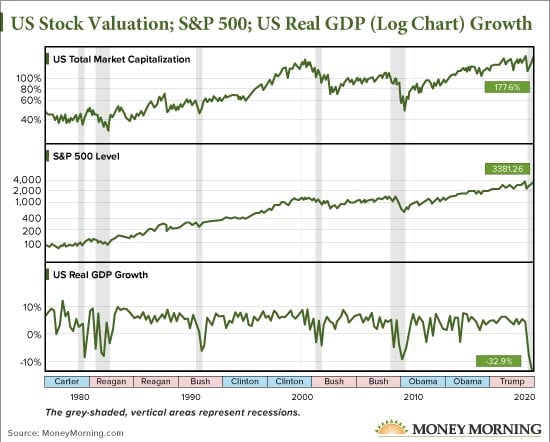
The charts below paint a fairly clear picture…
The top graph shows the current U.S. market-cap-to-GDP ratio sitting at 177.6%.
The middle graph shows the current level of the S&P 500 Index.
And the graph at the bottom represents the annualized growth rate of GDP (after inflation).
An overvalued stock market doesn’t mean a market crash is going to happen, but you can see the disconnect between the stock market and the economy. With stocks valued at such high levels despite the economy’s struggles, there could be a higher risk for stocks to correct or even crash with the right catalyst.
During the pandemic, businesses have suffered.
Earlier today, another 1 million Americans filed for unemployment. It was the 22nd time in 23 weeks that initial claims were above 1 million.
And since the pandemic began, initial jobless claims have increased by over 58 million.
Because of that, we are likely to see 20% to 25% of small businesses in the United States be shut down for good before this economic crisis is over.
If that were to be the case, we could see 10% of all jobs in America destroyed. That’s because small businesses make up about 50% of the jobs here in the United States.
With the problems these businesses and citizens are facing, GDP has fallen significantly – down nearly 33%.
But despite the worst economic backdrop since the Great Depression, stocks have held up reasonably well since the March 23 bottom.
That’s because the U.S. Federal Reserve printed and injected $5 trillion into the economy, which inflated the value of U.S. stocks.
This has created the highest level of overvaluation since the ratio began in January 1971.
And it’s another way of saying that stocks are extremely overbought.
It’s important to note that stocks can remain overvalued for an extended period.
However, at some point, stocks will have to fall (or GDP will rise), and the ratio will decline just to revert back to the mean.
While it’s true that the stock market has disconnected from the underlying economy, it has also done so in the past.
The previous record high was 49.3% on Jan. 26, 2018. And two weeks later, the market experienced a 10% correction.
Prior to that, the highest reading was 49% overvalued in March 2000, just as the tech bubble burst – sending the S&P 500 about 50% lower before it started rebounding.
So, the obvious question we need to ask ourselves today is whether this is another stock market bubble – and what we can do to limit our risk.
Does This Mean a Stock Market Crash Is Coming?
Though we know the economy is improving, we do not know if the improvement will be able to happen fast enough to bring the ratio down to a more comfortable level.
That doesn’t mean a stock market crash is imminent. Stocks can certainly keep running higher too, especially if the economy turns around soon. But this is a risk investors need to have a plan for.
No matter which way you slice it, the massive 32.9% drop in GDP (bottom graph) and a rising stock market (middle graph) is going in the wrong direction.
And it’s uncertain if the economy will be able to improve at the same pace as we head into the fall and winter months. The novel virus could potentially spread more during the typical flu season.
As far as putting your money elsewhere goes, very few investment categories offer a good alternative to the stock market.
Cash is paying next to nothing, and bond yields are at historic lows thanks to the Fed suppressing interest rates near zero.
You could invest in gold, silver, or other commodities… but buying these after such an increase could prove risky.
Gold is up 29% year to date, while silver is already up 55%.
With a lack of alternatives, you might say stocks are the only game in town.
The “wealth effect” is experienced as investors feel richer because their stocks are going up. And they expect this to continue indefinitely.
How long these valuations remain this elevated is anyone’s guess.
But we do know if valuations remain extremely elevated for an extended period, the market will experience an even more serious decline when the correction finally comes.
It reminds me of the famous Warren Buffett quote: “Be fearful when others are greedy.”
Action to Take: There are many ways to protect your portfolio from a market downturn. As we alluded to earlier, buying precious metals like gold and silver could be a good hedge to all the fiat money printing. You could also purchase inverse ETFs that go up when the market goes down. And finally, you could purchase put options on the S&P 500 or individual stocks you think might fall the most.
— Money Morning Staff
Source: Money Morning
