
The American transportation manufacturing corporation that specializes in the barge and railroad car manufacturing, railroad car refurbishment, and railroad car leasing/management services, Greenbrier Companies Inc. (NYSE: GBX) seems to be gearing up for a surge as per its latest charts.
Bullish Indications
#1 Ascending Triangle Pattern Breakout: The daily chart shows that the stock was recently forming an Ascending Triangle pattern. An Ascending Triangle pattern is a bullish pattern. This is marked on the daily chart in pink color. A breakout from an ascending triangle pattern generally indicates the start of a bullish trend. The breakout level also acts as a good support level. Currently, the stock has broken out of the ascending triangle pattern, which is usually a bullish sign.
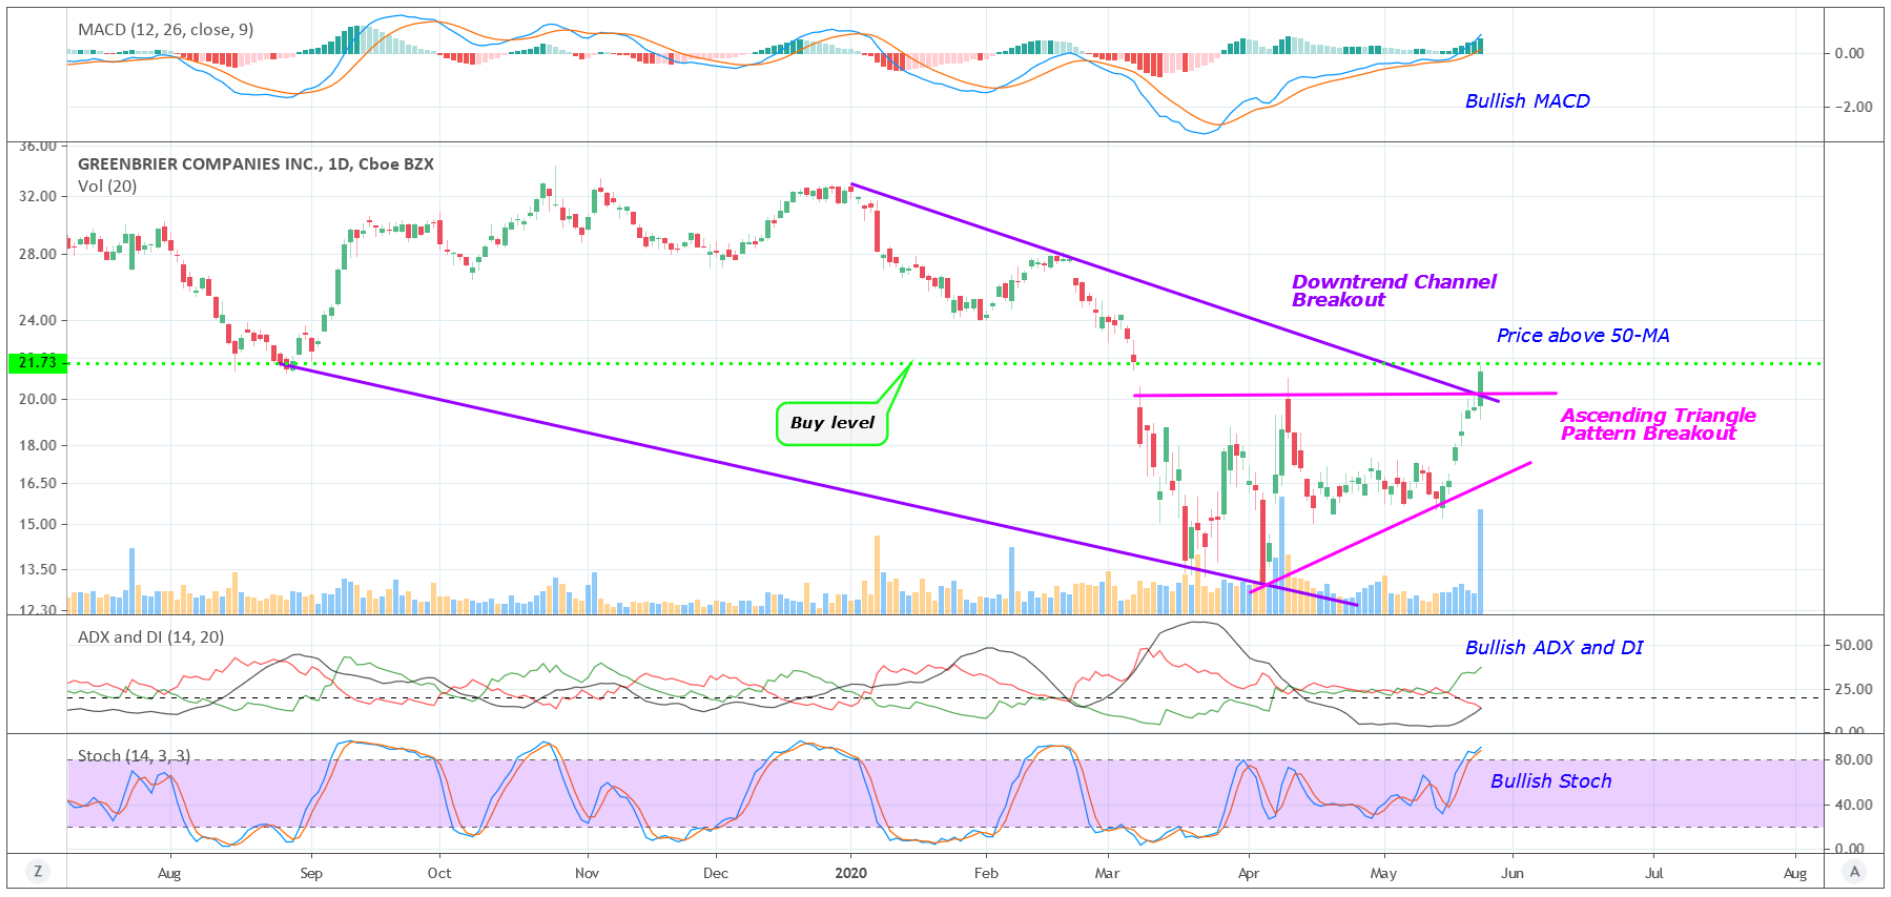
Daily Chart – GBX
#2 Channel Breakout: As you can see from the daily chart, the stock was trading within a downtrend channel during the past few weeks. This is marked in the daily chart in purple color. Currently, the stock has broken out of this channel with high volume. This is a possible bullish sign.
#3 Trading Above MA: The stock is currently trading above its 50-day SMA, which implies that the bulls are currently in control.
#4 Bullish ADX and DI: The ADX line is starting to move up from below –DI and +DI lines.
The +DI line is also currently above –DI line.
All these indicate possible bullishness.
#5 MACD above signal line: As you can see from the daily chart, the MACD line (blue color) is currently above the signal line (orange color), indicating a bullish bias.
#6 Bullish Stoch: The %K line of the stochastic is currently above the %D line, indicating bullishness.
#7 Bounceback from support area: The weekly chart shows that the stock had recently taken support at a long-term support area before moving higher. This support area is marked as a pink color dotted line. This seems like a bullish indication.
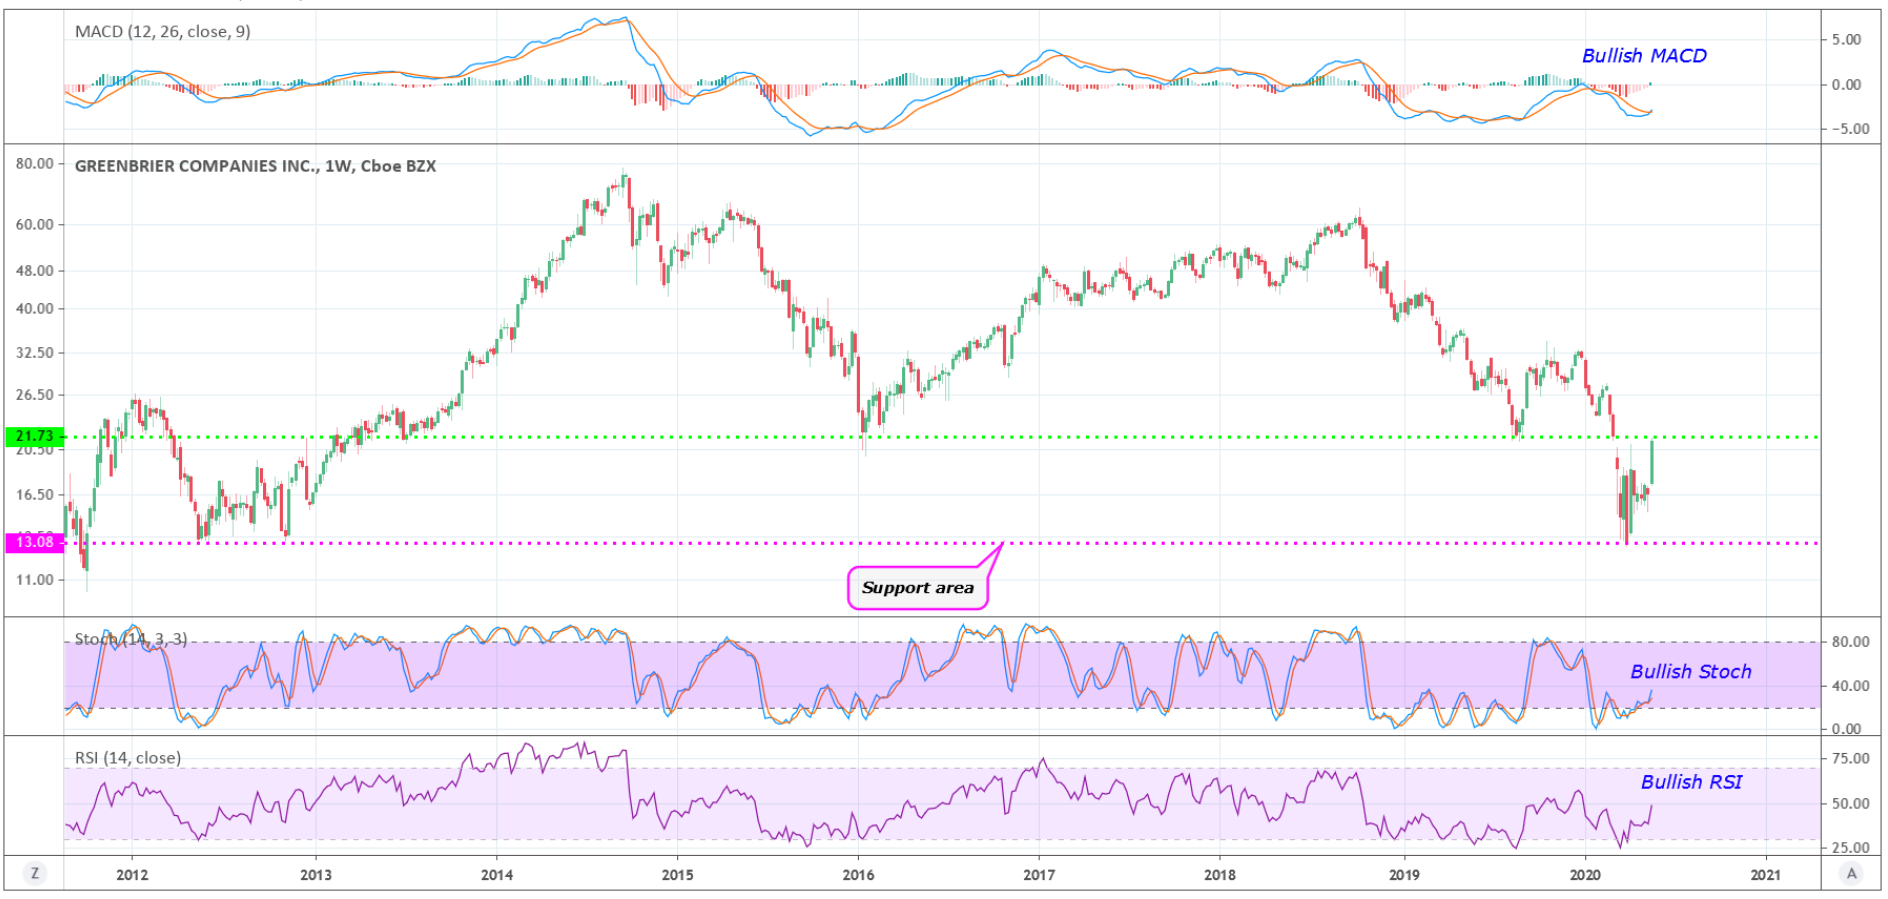
Weekly Chart – GBX
#8 Bullish RSI: The RSI had started moving higher from oversold levels and is currently near 50. This is a possible bullish sign.
#9 Bullish MACD: The weekly chart shows that the MACD line has currently crossed above the signal line, which is a positive indication.
Recommended Trade (based on the charts)
Buy Levels: If you want to get in on this trade, you can purchase the shares of GBX if it trades above Friday’s high. This translates to a price of around $21.80.
TP: Our target prices are $25 and $30 in the near-term.
SL: To limit risk, place a stop loss near $19.60. Note that this stop loss is on a closing basis.
Our target potential upside is 15% to 38% in the next 3-6 months.
For a risk of $2.20, the target rewards are $3.20 and $8.20. This is a nearly 1:2 and 1:4 risk-reward trade.
In other words, this trade offers nearly 2x to 4x more potential upside than downside.
Risks to Consider
The stock may reverse its overall trend if it breaks down with high volume from the downtrend channel and ascending triangle pattern. The sell-off of the stock could also be triggered in case of any negative news, overall weakness in the market, or any regulatory changes in its sector.
Happy Trading!
Tara
The goal? To build a reliable, growing income stream by making regular investments in high-quality dividend-paying companies. Click here to access our Income Builder Portfolio and see what we’re buying this month.
