
The California-based consulting and engineering services firm that provides consulting, engineering, program management, and construction management services in the areas of water, environment, infrastructure, resource management, energy, and international development, Tetra Tech, Inc. (NASDAQ: TTEK) seems to be poised for a decline in its price in the near term as per its latest charts.
Bearish Indications
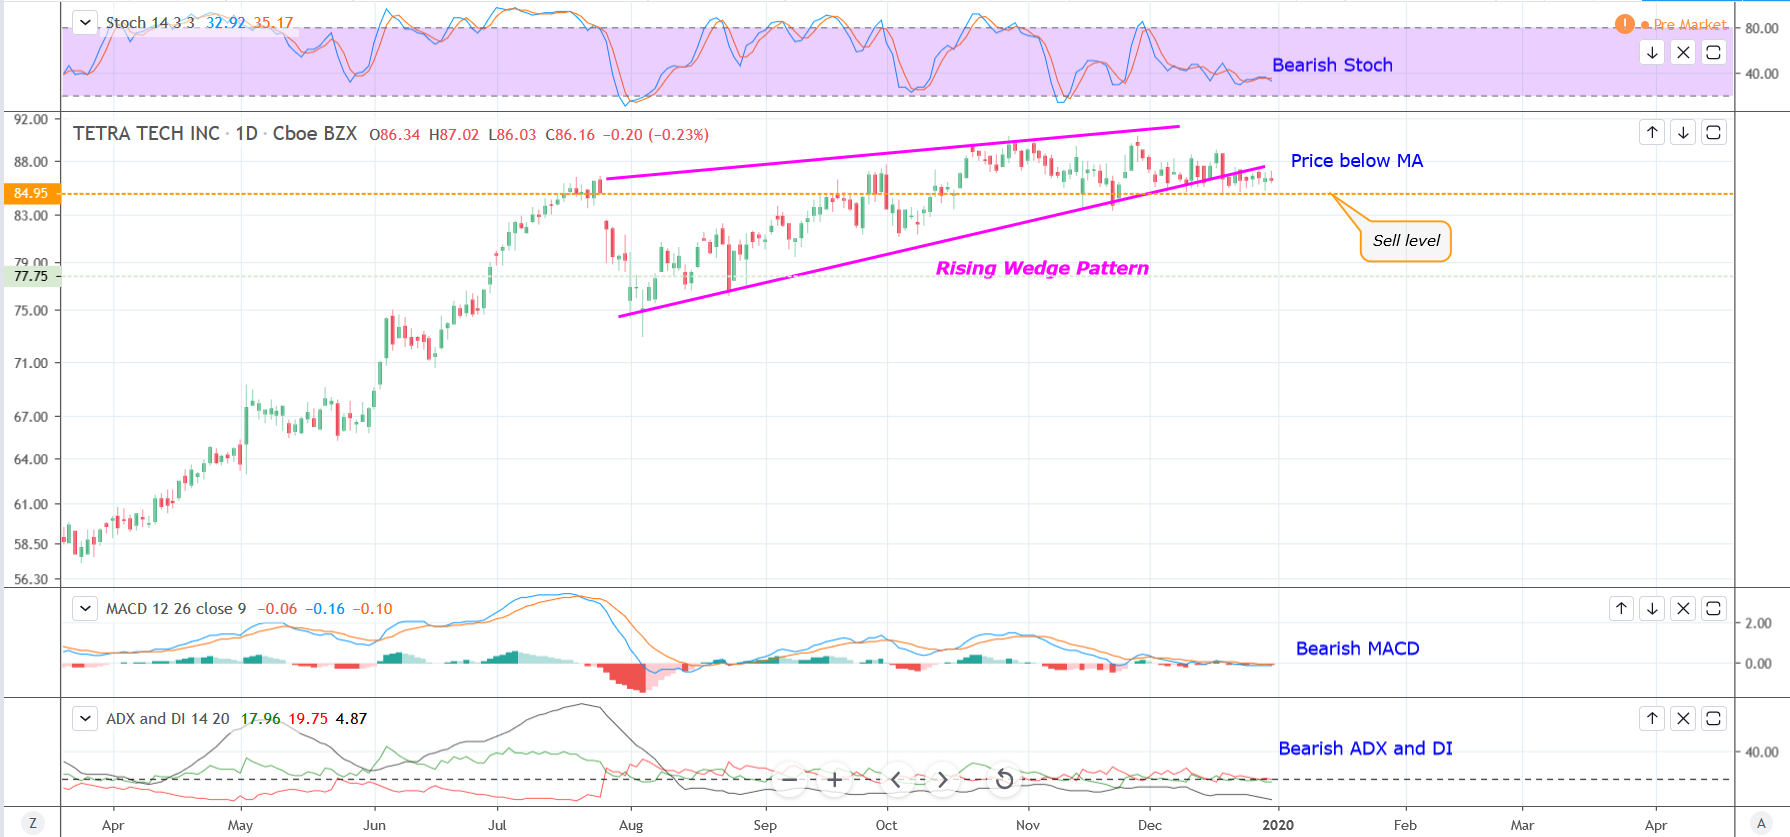
#1 Rising Wedge Pattern: The daily chart shows that TTEK has recently formed a rising wedge pattern during the past few months. This is a bearish pattern and is marked in pink color in the daily chart. Once a stock breaks down from the bottom of the rising wedge pattern, it typically moves lower in the near-term.
Daily Chart – TTEK
#2 MACD below signal line: The MACD line (blue color) is currently below the MACD signal line (orange color), indicating possible bearishness.
#3 %K below %D in Stochastic: The %K line is currently below the %D line in stochastic of the daily chart.
This indicates possible bearishness.
#4 Bearish ADX and DI: The ADX and DI indicate bearishness.
This is because (+DI) < (-DI); and ADX has started rising from below both (+DI) and (-DI).
All these points to possible bearishness.
#5 Price below MA: The price is currently below the short-term moving average of 50-day SMA, indicating that the bears are slowly gaining control.
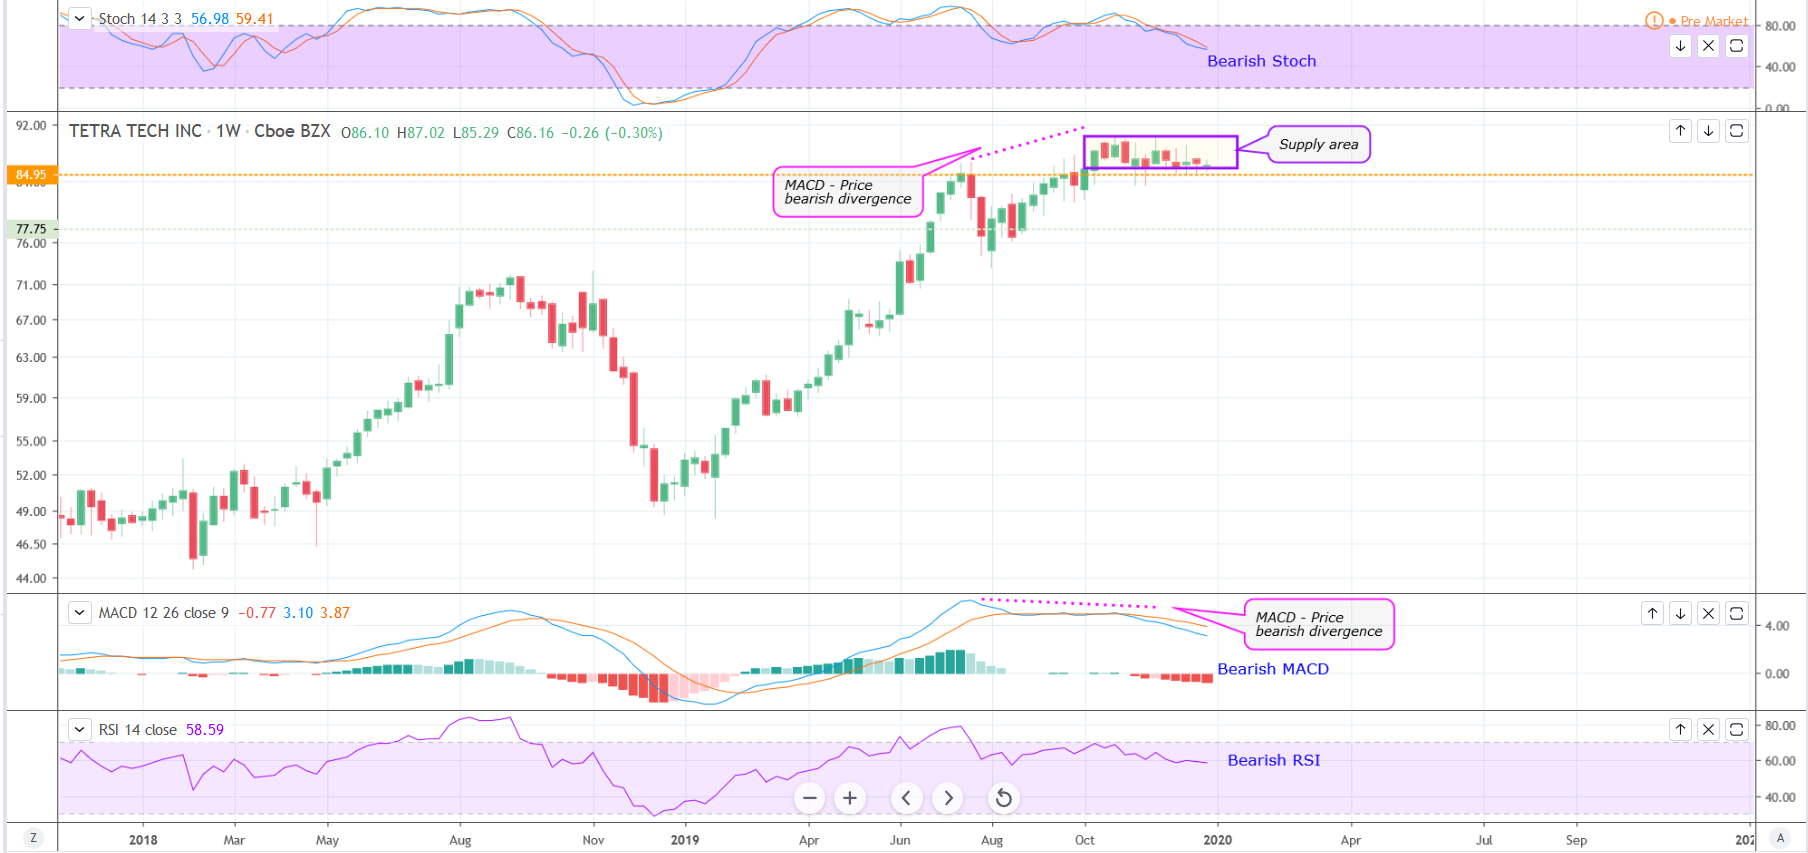
#6 Supply area: The weekly chart shows that the stock is currently near a supply area, which is marked as a purple rectangle. The stock was not able to cross above this level even after multiple attempts. This indicates possible bearishness.
Weekly Chart – TTEK
#7 Bearish Stochastic: The stochastic in the weekly chart is near overbought levels and moving down. The %K line has also crossed below the %D line. All these indicate possible bearishness.
#8 Bearish RSI: The RSI is moving down after reaching overbought levels, indicating possible bearishness.
#9 Bearish MACD: In the weekly chart as well, the MACD line (blue color) is currently below the MACD signal line (orange color), indicating possible bearishness.
#10 Bearish Divergence between MACD and Price: The weekly chart shows that there is a bearish divergence between MACD and price. This is because while the price was making higher highs, the MACD was forming lower highs. This usually indicates the possibility of an upcoming bearish move. The bearish divergence is marked as pink color dotted lines in the chart.
Recommended Trade (based on the charts)
Sell Levels: If you want to get in on this trade, the ideal sell level for TTEK is below $84.95.
TP: Our target price is $77 and if it closes below that, the next target price is $70 in the next 3-6 months.
SL: To limit risk, place a stop loss at $88. Note that this stop loss is on a closing basis.
Our target potential downside is 9% to 18% in the next 3-6 months.
For a risk of $3.05, our target rewards are $7.95 and $14.95. This is a nearly 1:3 and 1:5 risk-reward trade.
In other words, this trade offers nearly 3x to 5x rewards compared to the risks.
Risks to Consider
The stock may reverse its overall trend if it breaks upwards from the rising wedge pattern with high volume. The breakout of the stock could also be triggered in case of any positive news, overall strength in the market, or any regulatory changes in its sector.
Happy Trading!
Tara
If you're buying rare earth or other critical mineral stocks, you're already one step behind - because we believe that political insiders in Washington are preparing to buy a whole new group of stocks, which could begin soaring 500%+ just days from now. The man once ranked in 2020 as America's #1 stock picker is doing something extraordinary and giving away the name and ticker of every single stock that could be next. Everything you need to know is here.
