

The American medical equipment company specializing in artificial heart valves and hemodynamic monitoring, Edwards Lifesciences Corp (NYSE: EW) seems to be poised for a decline in its price in the near term as per its latest charts.
Bearish Indications
#1 Rising Wedge Pattern: The daily chart shows that EW has recently formed a rising wedge pattern during the past few months. This is a bearish pattern and is marked in purple color in the daily chart. Once a stock breaks down from the bottom of the rising wedge pattern, it typically moves lower in the near-term.

Daily Chart – EW
#2 Overbought CCI moving down: CCI is currently moving down after reaching overbought levels, indicating possible bearishness.
#3 RSI moving down: The daily chart shows that the RSI has moved down from overbought levels and is currently moving lower.
This is a possible bearish sign.
#4 Bearish Divergence between CCI and Price: The daily chart shows that there is a bearish divergence between CCI and price.
This is because while the price was making higher highs, CCI was forming lower highs.
This usually indicates the possibility of an upcoming bearish move.
The bearish divergence is marked as pink dotted lines in the chart.
#5 Bearish Harami pattern: The weekly chart shows that the stock had formed a bearish harami candlestick pattern last week. In this pattern, a large bullish green candle appears on Day 1 followed by a smaller bearish or bullish candle on Day 2. This pattern is marked as an orange color ellipse. This is a bearish pattern and usually appears during an uptrend and signals the reversal of the trend.
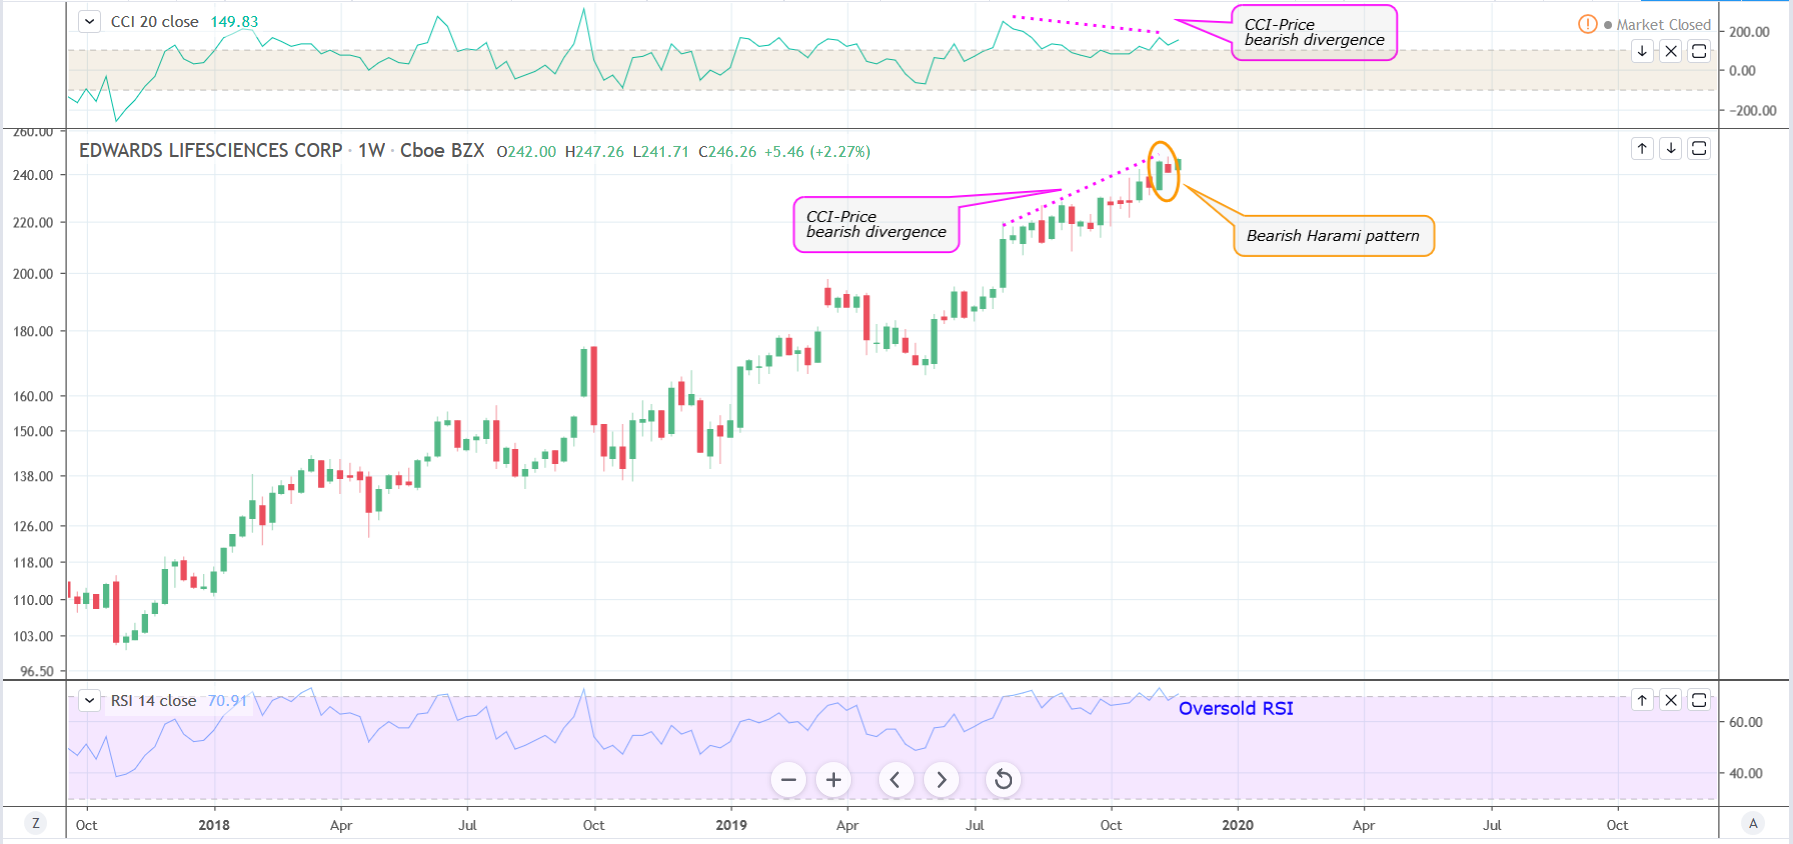
Weekly Chart – EW
#6 Bearish Divergence between CCI and Price: In the weekly chart as well, we can see that there is a bearish divergence between CCI and price. While the price made higher highs, CCI formed lower highs. This is also a possible bearish indication.
Recommended Trade (based on the charts)
Sell Levels: If you want to get in on this trade, you can take short positions on EW below the 50-day SMA, at a price of around $230.
TP: Our target prices are $215 and $200 in the next 3-6 months.
SL: To limit risk, place a stop loss at $239.00. Note that this stop loss is on a closing basis.
Our target potential downside is 7% to 13% in the next 3-6 months.
For a risk of $9.00, our target rewards are $15.00 and $30.00. This is a nearly 1:2 and 1:3 risk-reward trade.
In other words, this trade offers nearly 2x to 3x rewards compared to the risks.
Risks to Consider
The stock may reverse its overall trend if it breaks upwards from the rising wedge pattern with high volume. The breakout of the stock could also be triggered in case of any positive news, overall strength in the market, or any regulatory changes in its sector.
Happy Trading!
Tara
If you're buying rare earth or other critical mineral stocks, you're already one step behind - because we believe that political insiders in Washington are preparing to buy a whole new group of stocks, which could begin soaring 500%+ just days from now. The man once ranked in 2020 as America's #1 stock picker is doing something extraordinary and giving away the name and ticker of every single stock that could be next. Everything you need to know is here.
