

I’ve been investing in stocks for almost 10 years now.
I’ve experienced a lot of ups and downs in the market over that time frame.
And I’ve learned a lot of lessons.
There’s one lesson that’s been particularly educational.
This lesson has had a major impact on my investing, life, and wealth.
That lesson is this: stick to high-quality companies.
Every single time that I’ve strayed from this, buying up shares in some inferior business for one reason or another, I’ve been burned.
It’s really just like anything else in life.
Date an inferior partner. Go get an inferior job. Live in an inferior city.
You would never go out of your way to do any of that.
Well, the same should be true with your investments.
If you go after low-quality investments, expect low-quality results.
Fortunately, it’s not difficult to avoid low-quality companies.
It’s one reason why dividend growth investing is so fantastic.
This strategy almost guarantees that you’re going to be investing in high-quality companies.
It’s practically by design. It’s the very nature of the strategy to buy shares in high-quality companies.
After all, any company that’s able to hand out rising cash dividend payments for years on end is doing a lot of things right.
Those checks can’t get cashed otherwise.
Check out the Dividend Champions, Contenders, and Challengers list to see what I mean.
There you’ll find more than 800 US-listed stocks that have raised dividends each year for at least the last five consecutive years.
 Perusing that list even casually will reveal dozens of household names.
I’ve personally used the dividend growth investing strategy to retire in my early 30s, as I lay out in my Early Retirement Blueprint.
Sure, I haven’t batted .1000.
Nobody does.
But I’ve done fairly well.
 I’ve built my real-money FIRE Fund by living below my means and investing in high-quality dividend growth stocks.
That portfolio generates enough five-figure passive dividend income for me to live off of.
Now, dividend growth investing tends to ensure that you’re sticking to high-quality companies.
But valuation is always critical.
While price is what you pay, value is what you get for your money.
An undervalued dividend growth stock should offer a higher yield, greater long-term total return potential, and reduced risk.
 That’s relative to what the same stock might otherwise offer if it were fairly valued or overvalued.
All else equal, because price and yield are inversely correlated, a lower price results in a higher yield.
This higher yield leads to greater long-term total return potential.
Total return is, after all, the sum of investment income and capital gain.
Boosting yield gives you more potential investment income.
Capital gain gets a potential boost, too, via the “upside” between a lower price and higher intrinsic value.
These favorable dynamics also reduce risk.
Undervaluation introduces a margin of safety.
That’s a “buffer” that protects the investors downside against unforeseen issues.
An undervalued high-quality dividend growth stock can be a tremendous long-term investment.
Fortunately, spotting undervaluation isn’t as difficult as it might seem.
Fellow contributor Dave Van Knapp put together an excellent valuation tool for dividend growth stocks.
Check out Lesson 11: Valuation, which is part of an overarching series on dividend growth investing.
With all of this in mind, let’s take a look at a high-quality dividend growth stock that appears to be undervalued right now…

Enbridge Inc. (ENB)
Enbridge Inc. (ENB) is an energy distribution and transportation company that owns and operates crude and natural gas pipelines across the United States and Canada. It also operates a gas utility business. Additionally, the company has considerable exposure to renewable energy through a diversified portfolio of renewable energy projects.
After merging with Spectra Energy Corp. in 2017, Enbridge is the largest energy infrastructure company in North America. The company operates the world’s longest and most complex crude oil and liquids transportation system.
For context, Enbridge’s pipeline network stretches from Norman Wells, Canada to Brownsville, Texas.
They operate approximately 17,035 miles (27,415 kilometers) of active crude pipeline across North America.
The company transports ~25% of the crude oil produced in North America; they also account for ~22% of all natural gas consumed in North America.
Put simply, they are a massive and critical energy infrastructure company by global standards.
Enbridge breaks down 2019’s estimated EBITDA through the following three core businesses: Liquid Pipelines, ~50%; Gas Transmission, ~30%; and Gas Utilities, ~15%.
What’s particularly wonderful about this business is the fact that they’re not highly exposed to volatile energy prices, due to their primary role as a transporter.
They do have the utility business, with approximately 3.7 million customers in Ontario. But this is regulated.
In fact, the company estimates that 98% of its 2019’s estimated EBITDA is regulated, take or pay, or fixed fee.
That translates to limited volatility in the company’s cash flows, as has been evidenced by Enbridge’s remarkable resiliency in all market conditions.
Dividend Growth, Growth Rate, Payout Ratio and Yield
This in turn translates to a limited volatility outlook for the dividend.
As it sits, the company has increased its dividend 23 consecutive years.
Yes, that includes the Great Recession. Yes, that includes numerous commodity meltdowns.
Enbridge keeps on pumping those growing dividends to their shareholders, as if a cash pipeline went straight to brokerages.
 The 10-year dividend growth rate stands at 12.8%.
Furthermore, Enbridge is committed to at least 10% DCF (distributable cash flow) and dividend growth through at least 2020.
They foresee post-2020 5-7% growth in DCF. I imagine the dividend would grow in a similar fashion.
This is strong growth when you consider the stock is offering an eye-watering yield of 6.55% right now.
That yield is more than three times the broader market’s yield.
It’s also almost 220 basis points higher than the stock’s own five-year average yield.
And it’s not like this is an unhealthy dividend in danger of being cut tomorrow.
As noted earlier, the company’s earnings profile is durable.
Moreover, the dividend is supported by healthy DCF.
The company’s guiding for CAD $4.30 to $4.60 in FY 2019 DCF/share.
At the midpoint of CAD $4.45, the dividend’s payout ratio is approximately 66.3%.
Not incredibly low. But also not in any kind of danger zone.
If you’re looking for a high yield from a high-quality company, this is arguably one of the best such opportunities in the market right now.
Revenue and Earnings Growth
But we invest in where a company and its dividend are going, not where they’ve been.
Having a good idea of what kind of trajectory a company is on helps us not only in terms of estimating future dividend growth potential, but it also tells us a lot about the possible valuation.
I’ll first show you what Enbridge has done over the last decade in terms of top-line and bottom-line growth.
Then I’ll compare that to a near-term professional estimate of profit growth.
Combining the known past with a future forecast should give us plenty to work with when it comes time to build out a trajectory.
Enbridge grew its revenue from CAD $12.466 billion in FY 2009 to CAD $46.378 billion in FY 2018.
That’s a compound annual growth rate of 15.72%.
This is very impressive; however, a substantial portion of the revenue growth is thanks to Enbridge’s aforementioned merger with Spectra Energy Corp. in 2017.
Further complicating matters as they relate to comparability, Enbridge decided in 2018 to simplify its corporate structure and agreed to acquire the shares it doesn’t already own in three North American units for about $7.1 billion. They rolled up their master limited partnership units and now operate under one flag.
This decision was partially prompted by changes in the tax code that made MLPs a less attractive vehicle.
To be honest, it’s difficult to compare the Enbridge of 2019 to the Enbridge of 2009. They’re basically two different companies.
Also, Enbridge reports GAAP numbers as a C-Corp, but it still operates almost like an MLP due to the nature of the business model.
GAAP profit thus doesn’t necessarily accurately describe the company’s profit position.
Enbridge navigates this by providing both GAAP EPS and DCF. DCF is analogous to FFO (funds from operations) in the REIT world.
DCF/share is the number you want to use when gauging the company’s profit (and ability to cover its dividend).
However, even this is a difficult number to compare to prior periods.
That’s partially due to the corporate changes I just noted. Also, the company recently went from reporting ACFFO (adjusted funds from operations) to DCF.
The best I can do with this is to look at more recent DCF/share growth.
Enbridge delivered CAD $4.42 in DCF/share for FY 2018. That’s a 20.1% increase over FY 2017 CAD $3.68 DCF/share.
Using the midpoint of management’s DCF/share guidance for FY 2019, which would be $4.45, we come out roughly flat YOY.
However, as noted earlier, management is guiding for 5-7% growth in this metric post-2020.
For additional perspective, CFRA is forecasting a 13% CAGR for Enbridge’s EPS. But I think this is both high and irrelevant.
It’s irrelevant because of the nature of the business model negating the importance of GAAP EPS. And it’s high because the near-term numbers, as well as management’s own guidance, shows a much lower growth rate.
Still, if the company musters only that low end of DCF growth, it would easily allow for like dividend growth.
The payout ratio is within the company’s targeted range.
And Enbridge’s management has historically guided and managed the company’s dividend quite well.
Therefore, investors could very well be looking at a 5%+ dividend growth rate on top of a 6.5%+ yield.
I don’t spot that kind of income and growth combination very often. Especially in this market. It’s remarkable.
Financial Position
Moving over to the balance sheet, the company is in on solid footing.
And that footing has been improving of late.
The long-term debt/equity ratio is 0.87.
Enbridge has lowered its consolidated debt to EBITDA down from approximately 6x in 2016 to a bit over 4.5x today.
Their unsecured debt ratings show debt that’s well into investment-grade range: Standard & Poors rates it a BBB+; Moody’s gives them a Baa2. The latter rating was upgraded in January.
Profitability is difficult to gauge because of the comparability and GAAP issues I noted before.
But the company has averaged annual net margin of 3.84% and annual return on equity of 7.56%.
What you have here is, this is a company that provides critical energy infrastructure to North America.
And the business model is structured in a way that’s largely insulated from volatile commodity prices.
Of course, there are risks.
Competition, litigation, and regulation are omnipresent risks in every industry.
There’s also black swan risk with Enbridge in the form of potential catastrophic damage to pipelines.
While the company is largely insulated from commodity pricing, it’s not totally insulated from commodity demand.
The balance sheet has been markedly improving, but the company does continue to carry a sizable debt load.
And because of the structure of the company, they’re heavily reliant on capital markets for project/growth funding.
Overall, this appears to be a very compelling long-term investment for dividend growth investors.
It’s just not very often that you’re able to lock in a sky-high yield and still get this kind of dividend growth.
Stock Price Valuation
What makes the stock even more compelling, though, is the valuation…
The stock is trading hands for a multiple of just 10.10 times this year’s midpoint guidance for DCF/share.
That’s the closest I can get to a P/E ratio for this name.
The P/B ratio, at 1.5, is less than half its five-year average of 3.5.
And the yield, as shown earlier, is substantially higher than its own recent historical average.
So the stock does look cheap. But how cheap might it be? What would a reasonable estimate of intrinsic value look like?
I valued shares using a dividend discount model analysis.
I factored in an 8% discount rate (due to the high yield) and a long-term dividend growth rate of 4%.
That DGR looks very conservative relative to what Enbridge has historically produced.
However, management is guiding for a slowdown in this area, as the company is now much larger than it was a decade ago.
I think a ~5% DGR is actually more of a baseline expectation, but I like to err on the side of caution.
And I am looking out over the very long term here.
Enbridge may grow the dividend a bit faster than this over the near term.
But I suspect a flattening out – ending up with a low-single-digit growth rate – over the long run is likely.
The DDM analysis gives me a fair value of $57.72.
The reason I use a dividend discount model analysis is because a business is ultimately equal to the sum of all the future cash flow it can provide.
The DDM analysis is a tailored version of the discounted cash flow model analysis, as it simply substitutes dividends and dividend growth for cash flow and growth.
It then discounts those future dividends back to the present day, to account for the time value of money since a dollar tomorrow is not worth the same amount as a dollar today.
I find it to be a fairly accurate way to value dividend growth stocks.
I think my valuation was a conservative look at the future dividend growth trajectory.
Yet the stock still looks very cheap.
But we’ll now compare that valuation with where two professional stock analysis firms have come out at.
This adds balance, depth, and perspective to our conclusion.
Morningstar, a leading and well-respected stock analysis firm, rates stocks on a 5-star system.
1 star would mean a stock is substantially overvalued; 5 stars would mean a stock is substantially undervalued. 3 stars would indicate roughly fair value.
Morningstar rates ENB as a 4-star stock, with a fair value estimate of $47.00.
CFRA is another professional analysis firm, and I like to compare my valuation opinion to theirs to see if I’m out of line.
They similarly rate stocks on a 1-5 star scale, with 1 star meaning a stock is a strong sell and 5 stars meaning a stock is a strong buy. 3 stars is a hold.
CFRA rates ENB as a 3-star “HOLD”, with a 12-month target price of $37.00.
I came out a bit high, surprisingly. Averaging out the three numbers gives us a final valuation of $47.24, which would indicate the stock is possibly 40% undervalued.
 Bottom line: Enbridge Inc. (ENB) is a high-quality company that provides critical energy infrastructure. With a 6.5%+ yield, a double-digit long-term dividend growth rate, more than 20 consecutive years of dividend raises, a sustainable payout ratio, and the potential that shares are 40% undervalued, dividend growth investors should take a very close look at this stock right now.
-Jason Fieber
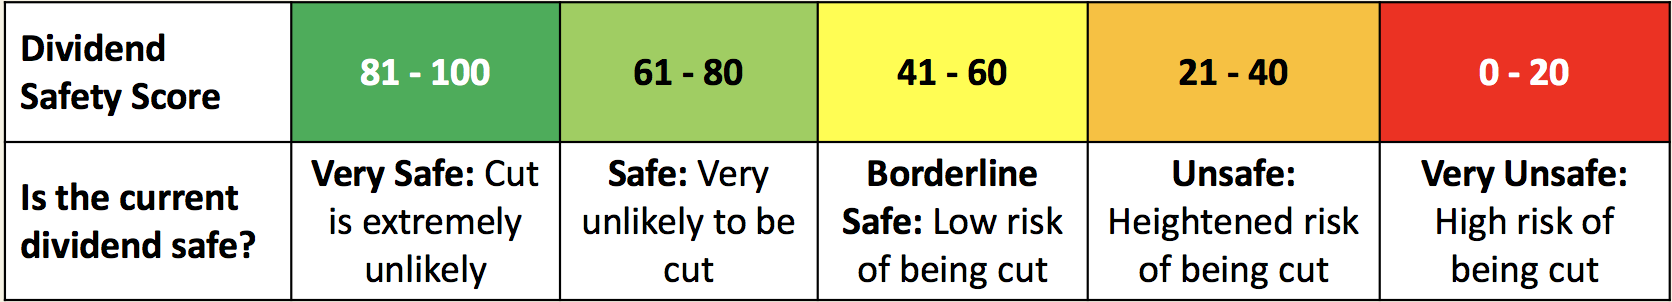
Note from DTA: How safe is ENB’s dividend? We ran the stock through Simply Safe Dividends, and as we go to press, its Dividend Safety Score is 57. Dividend Safety Scores range from 0 to 100. A score of 50 is average, 75 or higher is excellent, and 25 or lower is weak. With this in mind, ENB’s dividend appears Borderline Safe with a low risk of being cut. Learn more about Dividend Safety Scores here.
Legendary fund manager Louis Navellier – a man Forbes calls "the king of quants" – is going "ALL-IN" on this game-changing AI technology. He says, "This is the culmination of everything you've been reading about AI for the last 60 years."Get the details...
