

By now you’ve heard plenty of talking heads on television saying all sorts of scary things about the inverted yield curve for United States Treasury bonds. And if you missed the headlines, you’ll be reading them popping up in news feeds and in the papers.
A yield curve is the plotting of bond maturities and their yields from shorter-to-longer-term. It shows how the market for any type of bond is being bought and traded. Normally, shorter-term bonds have lower yields than longer-term maturities.
This is because the longer the maturity, the greater the risk of inflation baring its claws making for future interest payments.
This also means that the eventual principal payment will be worth less in inflation-adjust terms. Longer-term yields tend to be lower because they must also price in credit risk.
The longer the maturity, the greater time for credit in any given market sector to gyrate or deteriorate, putting future interest and principal payments at risk.
A normal yield curve should connect the dots of yield on the y-axis and maturities on the x-axis. It normally rises in yield as maturity dates stretch out.
What Does Today’s Yield Curve Mean?
But an inverted yield curve is when shorter-term maturities are yielding more than longer-term maturities. And when it comes to the U.S. Treasury bond market, the generally accepted definition is when the 2-year Treasury yield is lower than the 10-year Treasury yield.
This kicked in early yesterday when the 2-year was at a little bit past 6:00 a.m. I was working to finish up my papers with my Bloomberg Terminal humming along. The 10-year dropped to 1.62% and the 2-year was sitting at 1.63%. This hasn’t happened since 2007, when on Feb. 22 the spread was a negative 15.41 basis points, or 0.1541%.
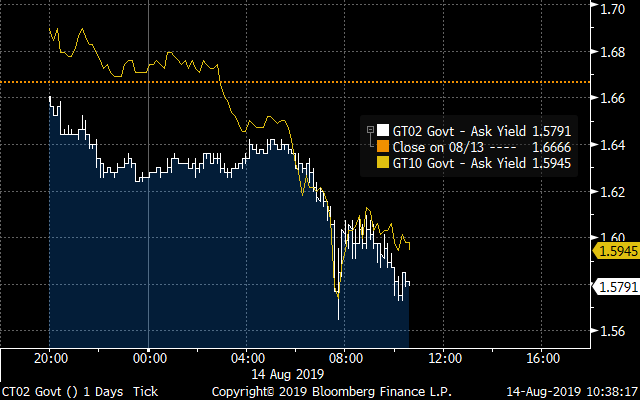 Today’s Trading (In Yield%) for U.S. 2-and-10-Year Treasuries
 History of Yield Spread between 2 and 10-Year U.S. Treasury Bonds
Now since yesterday morning, the bond market has sent the spread back to positive, which is normal, for the 2-and-10-year maturity yields. Before I get into what this means, what is causing it, why you should care and what you need to do — let’s look at what the U.S. Treasury bond market has done over the trailing year.
From Aug. 14, 2018 through to yesterday, Treasury yields outside of the 1-month bills have all dropped, and longer maturities have dropped even more.
In the next graph I’ve plotted the curves for both dates and the resulting yield changes.
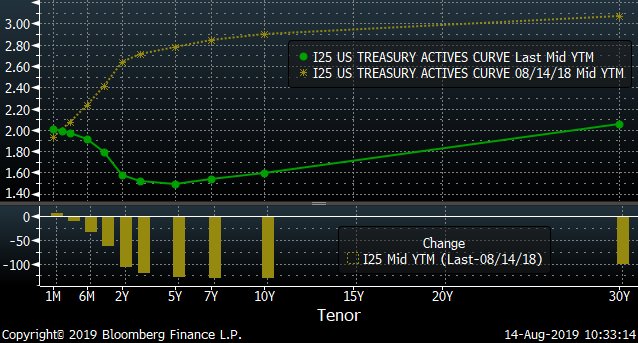
U.S. Treasury Bonds (Actively Traded) Aug. 14, 2018 and Yesterday
What has been causing this to occur? First up, the U.S. Treasury has been issuing more bonds with shorter maturities for some time as part of their funding for the U.S. government. This means more supply, which will influence market pricing. Second, inflation has been low and generally falling over the past many months.
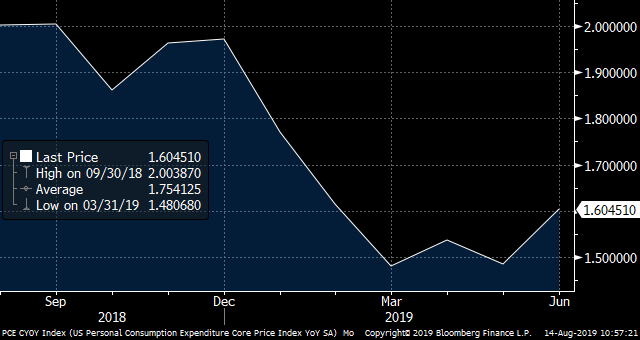
The Personal Consumption Expenditure Index, which is the prime gauge used by the the Federal Reserve and its Open Market Committee, has gone from bobbling around the 2% down to a current level of 1.6%. The PCE is a much better and more broad inflation gauge than the Consumer Price Index, as the PCE measures all consumption and not the contrived basket of goods and implied costs for other things including residential expenses.
U.S. Core Personal Consumption Expenditure Index
And the core PCE, which is also calculated in quarterly Gross Domestic Product data, is running for the second-quarter data release at a rate of 1.4% in the deflator calculations of the GDP growth rate of 2.4%.
So, inflation is low and down, and well below the stated target range of the FOMC of above 2% — and even higher for what it deems as a healthy level for a growing economy.
This means that while the FOMC has already reversed course with its target range for Fed funds at its July 31 meetings, I think it is likely that it will further ease in its meetings concluding on Sept. 18, Oct. 30 and Dec. 11 of this year. This reversal of target ranges for Fed funds is reminiscent of when it reversed in 1995-1996 and in 1998.
This makes longer-term bonds all the more valuable to lock in yields for the longer term. Now normally, falling yields means falling GDP growth and a weakening economy. But that isn’t as much the case right now. Growth in the U.S. economy remains good as just noted above for the most recent data, and there is good reason to see it continuing. U.S. consumer spending drives the vast majority of the economy. And my preferred gauge of consumers is the Bloomberg Consumer Comfort Index, which I refer to as the “Comfy Index.”
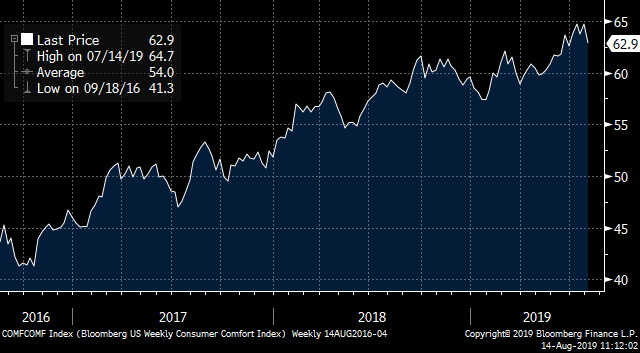 Bloomberg Comfy Index
Since late 2016, the Comfy Index has been climbing and is very well-positioned in the excellent range. This means that consumers should be eager to spend and have the ability to do so — particularly as U.S. wage growth has continued to be multiples of core PCE inflation.
And businesses continue to expect rising activity over the next six months, as I utilize the Federal Reserve Bank of New York’s survey data for projections.
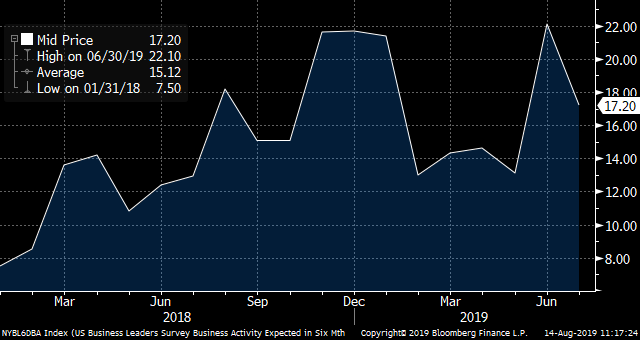 U.S. Business Leaders Expected Business Activity (Six Months Forward)
So, rather than the sickening economy that many are worried about, the U.S. economy continues to show better conditions.
What Is Happening With the U.S. Economy
But what really is happening is that the U.S. is the haven economy in a world where Europe is in trouble and the leading economies of Asia are slowing. And as a result, yields for government bonds from the leading issuers in Europe and Asia are increasingly heading into negative yields.
Negative yield come as coupon rates (stated interest rates) are issued at low or near-zero rates. The markets at auction as well as the secondary market bids the bonds to prices above par ($100), which brings the yields below zero. Take for example a German bund (government bond) with a coupon of 0.5% and a maturity of Feb. 15, 2025. It has recently been trading in the market for $106.75 which means that for each bund you’ll pay $1,067.50 euros along with $2.19 euros in accrued interest for an effective yield to maturity of -0.69%. That’s because the bund will mature at $100, or $1,000 euros, which prices in a loss of $67.50 euros and offsets the coupons.
Negative yields and interest rates around the world beyond the U.S. are rapidly becoming a growing problem as the amount of bonds with negative yields keeps climbing by the day to a current level of $15.8 trillion.
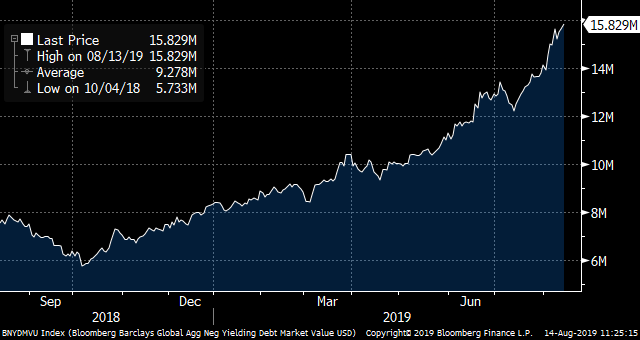 Negative Yield Debt Around the Globe
This in turn is making the U.S. bond market all the more attractive with positive yield, and is driving more buying from investors in the U.S. and beyond. And with more buying of longer-term bonds, yields are down and prices are up.
Why Investors Should Care About the Inverted Yield Curve
You should care, because this is good — for now — for the U.S. economy. Lower interest rates and yields means lower borrowing costs for everyone from the government to corporations and individuals. And this in turn should further aid the growth of the U.S. economy, along with lower inflation pressures over time with lower borrowing costs.
And this shows up in how well U.S. bonds are performing in total return from all bonds to my preferred markets in higher-yielding corporate bonds and municipal bonds.
Look at the performance year to date for all U.S. bonds (in aggregate), corporate high yield and municipal bonds as tracked by Bloomberg Barclays.
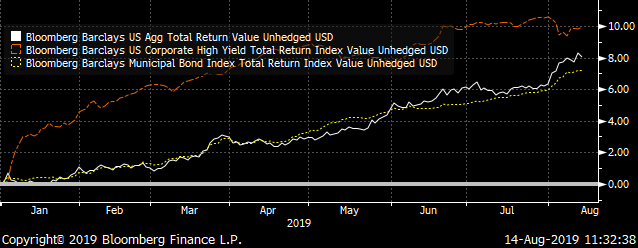 U.S. Aggregate Bond (White), U.S. High Yield Corporates (Orange) and Municipal Bonds Total Return
Overall, U.S. bonds in aggregate have returned 8% year to date. Corporate high-yielding bonds have returned almost 10% and municipal bonds generated 7%.
Securities to Focus On
Now, stocks have been choppy recently — with trade tariff concerns and global economic trouble outside the U.S. But not all stocks have been in the crosshairs of sellers. I continue to guide my Profitable Investing subscribers to hone in on U.S.-focused stocks. This list includes real estate investment trusts such as my favorite W.P. Carey (NYSE:WPC) and utilities such as my favorite NextEra Energy (NYSE:NEE). And these sectors have been and should continue to benefit from lower U.S. interest rates and yields.
And with mortgage loans climbing with rising property market values and consumer confidence, U.S. mortgage investment companies such as my MFA Financial (NYSE:MFA) should continue to deliver.
But for U.S. bonds — focus on the BlackRock Credit Allocation Income Trust (NYSE:BTZ) for corporate and other bonds trading at a discount to net asset value by 8.6% and yielding 5.9%. Investors should also focus on the Nuveen Municipal Credit Income Fund (NYSE:NZF) trading at a discount of 3.8% to net asset value and yielding a tax-equivalent yield of roughly 7.5%.
The yield curve isn’t a threat — but simply a measure of market activities and developments as well as an indicator of expectations going forward. It is a tool for investors which should be used and not just feared.
— Neil George
Legendary fund manager Louis Navellier – a man Forbes calls "the king of quants" – is going "ALL-IN" on this game-changing AI technology. He says, "This is the culmination of everything you've been reading about AI for the last 60 years."Get the details...
Source: Investor Place
