

The stock market is a fickle beast.
It’s very moody.
Cheery and optimistic one day.
Miserable and pessimistic the next.
The key for long-term investors is to take advantage of these moods.
If you pay high prices for great businesses when the stock market is too exuberant, you’ll suffer for it.
But if you can land wonderful businesses at great prices when the market is feeling extremely downbeat, you’ll probably see amazing results over the long run.
While the general moods aren’t terribly difficult to notice, the market isn’t some monolithic structure.
The stock market is a market of stocks.
It can be extremely profitable to spot individual stocks where the sour moods – and opportunities – are most prevalent.
This is something I’ve routinely done as I marched my way out of debt and into financial freedom – in just six years.
I lay out exactly how I did that in my Early Retirement Blueprint.
Suffice to say, I didn’t buy expensive stocks when everything was rosy.
I aimed to buy wonderful businesses at wonderful prices, and I built my FIRE Fund in the process.
That’s my real-money early retirement stock portfolio.
 It generates the five-figure passive dividend income I need to cover my essential expenses in life.
The wonderful business aspect of the equation is mostly covered by the very strategy I follow.
That strategy is dividend growth investing.
This strategy advocates investing in high-quality companies that pay shareholders rising cash dividend payments.
If a company can earn growing profit, the shareholders deserve their rightful share.
 And if a company can’t earn a growing profit, it’s not worth investing in.
Pretty simple.
The Dividend Champions, Contenders, and Challengers list contains data on more than 800 US-listed stocks that have raised their dividends each year for at least the last five consecutive years.
That’s fertile ground for finding wonderful businesses.
The wonderful price aspect is covered by the price you pay at the time of investment. And it’s something I’m addressing in this very article.
Valuation is critical.
An undervalued dividend growth stock should offer a higher yield, greater long-term total return potential, and reduced risk.
That’s relative to what the same stock might otherwise offer if it were fairly valued or overvalued.
 A lower price will result in a higher yield, all else equal.
That’s because price and yield are inversely correlated.
Since total return is comprised of investment income and capital gain, that higher yield leads to greater long-term total return potential.
But capital gain is also given a possible boost.
That occurs via the “upside” that exists between a lower price and higher intrinsic value.
If a stock that’s worth $100 is purchased for $80, there’s $20 worth of upside that could be captured if/when the market more accurately prices the stock.
The market is very moody over the short term. But price and value do tend to correlate pretty closely over the long run.
These dynamics should reduce risk.
A favorable gap between price and value introduces a margin of safety.
It’s a “buffer” that protects the investor’s downside against unforeseen issues that can erode value.
This limits the odds of ending up “upside down” on the investment.
I noted earlier that noticing market moods isn’t difficult.
Well, valuing individual dividend growth stocks is also easier than it’s made out to be.
Fellow contributor Dave Van Knapp put together a great series of “lessons” on the dividend growth investing strategy.
And Lesson 11: Valuation focuses specifically on valuation, even including a nice template that can be applied to just about any dividend growth stock out there.
With all of this in mind, let’s take a look at a high-quality dividend growth stock that appears to be undervalued right now…
 3M Company (MMM)
3M Company (MMM) is a diversified global manufacturing conglomerate.
Founded in 1982, the company now operates across five business segments: Industrial, 35% of FY 2017 sales; Safety & Graphics, 19%; Healthcare, 17%; Electronic & Energy, 15%; and Consumer, 14%.
Geographic distribution of FY 2018 sales are as follows: US, 39%; Asia Pacific, 31%; Europe, Middle East
and Africa, 20%; and Latin America and Canada, 10%.
This is a very international business.
The company employs over 90,000 people across the world, focusing on applying science across 12 areas of expertise: Automotive; Design & Construction; Manufacturing; Commercial Solutions; Electronics, Mining, Oil & Gas; Communications; Energy; Safety; Consumer; Healthcare; and Transportation.
All of these stats and metrics boil down to a very simple idea.
That idea is, 3M Company is an incredibly diversified industrial powerhouse.
They’re exposed to almost every single facet of life in almost every single area of the world.
As long as the world continues to prosper as a whole, 3M Company should continue to prosper.
Dividend Growth, Growth Rate, Payout Ratio and Yield
And that should translate to a prospering dividend.
If the past is any indication of the future, the dividend should prosper about as much as is possible.
I say that because 3M Company has one of the most storied dividend histories in existence.
They’ve raised their dividend for 61 consecutive years.
That’s multiple generations of people. It’s almost two of my lifetimes – and I’m getting old!
This time frame includes wars, recessions, upheaval, and incredible change in technology.
Yet 3M Company kept on pumping out bigger dividend payments to shareholders.
It’s quite incredible. A cash flow machine unlike almost any other company.
 The 10-year dividend growth rate stands at 10.5%.
That would be a solid growth rate all by itself.
But it’s made to be even more magnificent because it comes on the back of a dividend that’s already been growing for many decades.
It’s worth noting, though, that there has been a deceleration in dividend growth: the most recent dividend increase came in at a bit under 6%.
The payout ratio is 61.1%.
A bit on the high side, but it’s certainly not worrisome.
Meanwhile the stock yields 3.57% right now.
That’s well in excess of the broader market.
It’s also more than 110 basis points higher than the stock’s own five-year average yield.
That’s quite a spread, which speaks to the undervaluation points I made earlier.
Of course, we invest in where a company is going, not where it’s been.
Revenue and Earnings Growth
The dividend history is admirable. However, investors are buying this stock today because of the expectation for many future dividend payments.
Estimating those payments, which requires estimating the growth, is crucial to the investment thesis and valuation.
In building that estimation, I’ll first show you what the company has done over the last decade in terms of top-line and bottom-line growth.
I’ll then compare that to a professional near-term forecast for profit growth.
Blending the known past and future forecast in this manner should allow us to extrapolate where this company might be going.
And that will help us estimate the dividend trajectory.
3M Company grew its revenue from $23.123 billion in FY 2009 to $32.765 billion in FY 2018.
That’s a compound annual growth rate of 3.95%.
Solid number here.
I generally look for mid-single-digit top-line growth from a fairly mature company, although this comparison might be a bit skewed by the fact that 2009 represented the trough of the Great Recession.
Earnings per share increased from $4.52 to $8.89 over this period, which is a CAGR of 7.81%.
Excess bottom-line growth was largely driven by share buybacks. A slight margin expansion story is also at play here.
For reference, the outstanding share count has been reduced by almost 15% over the last 10 years.
The company’s market cap is over $90 billion right now, so you can see that this is fairly significant.
However, most of the buybacks over this period occurred after 2013. The business (and stock) had already largely recovered from the Great Recession at this point.
Moving forward, CFRA is predicting that 3M Company will compound its EPS at an annual rate of 12% over the next three years.
This is, in my view, an aggressive look at what 3M Company would or could do over the foreseeable future.
CFRA is modeling in increased demand for products across the broad portfolio due to a recovering global economy.
There’s also restructuring. The company announced that earlier this year. It could save as much as $250 million annually.
But the strong dollar, uncertainty regarding US-China ties, and increasing possibility of a recession in the US all add up to some considerable headwinds.
We can also point to a disastrous Q1 from the company that saw sales down 5% YOY and adjusted EPS down 10.8% YOY.
Adding more uncertainty, the company just recently announced a $6.7 billion acquisition of Acelity Inc., a privately held medical device company. This will greatly expand 3M Company’s presence in advanced and surgical wound care.
But the question is valuation, which is the question of this very article.
Acelity, Inc. had 2018 revenues of $1.5 billion, so this is a multiple of almost 4.5x sales. That compares to 3M’s own current P/S multiple of 3.0.
It would be right to be concerned that this deal, which is the largest 3M Company has ever announced, is coming at too high a price.
The acquisition is expected to be $0.35 dilutive to earnings per share in the first 12 months following completion of the transaction, including financing costs. This isn’t what shareholders want to see.
That said, even if the company’s profit growth over the next few years comes in somewhere closer to what they’ve historically produced, that would still allow for high-single-digit dividend growth.
They payout ratio is slightly high. But dividend growth could match EPS growth with no issue.
Indeed, I think high-single-digit dividend growth is a fair expectation for the duration.
Financial Position
Looking at the balance sheet, 3M Company has long maintained a rock-solid financial position.
That remains true today.
The long-term debt/equity ratio, at 1.37, might appear slightly high.
But we should consider that total cash adds up to almost 1/4 of long-term debt. And common equity is artificially lower because of large treasury stock (from the aforementioned buybacks).
Furthermore, the interest coverage ratio, which better gauges the company’s ability to cover its ongoing liabilities, is just over 20.
That’s a fantastic number.
However, the balance sheet will change in a major way after the Acelity, Inc. acquisition closes. 3M Company plans to pay for the deal with a combination of cash on hand and the issuance of new debt.
As a result, the company is slowing down the pace of buybacks from $2.0-$4.0 billion annually to $1.0-$1.5 billion annually.
The company’s profitability remains robust.
Over the last five years, the company has averaged annual net margin of 16.0% and annual return on equity of 42.35%.
These are great numbers as they sit. But they’re even more impressive when you consider that both have improved over the last decade. And it’s not like they’re boosting ROE by saddling themselves with debt.
The company is broadly diversified across the board: geographically, segments, and end markets.
And they use their expertise, global platform, scale, brand power, diversification, technology, innovation, and distribution network to their advantage, building an enviable economic moat around the business.
3M Company is a leader in R&D, spending about 6% of its sales on R&D.
This should allow it to innovate and stay ahead of the competition, patenting their results and bringing value to their customers. They’ve been issued over 110,000 patents. They are a leader in IP.
The company is globally exposed to almost every end market that exists.
Their products are used in various end applications. Think appliances, packaging, aerospace, electronics, construction, surgical supplies, telecommunications networks, renewable energy, etc.
And they have numerous brands that convey quality and consistency both on the consumer and industrial sides. These brands include the likes of Scotch, Scotchgard, Post-it, Scotch-Brite, ACE, and the eponymous 3M.
As with any business, investing in 3M Company has risks that should be considered.
Competition, regulation, and litigation are omnipresent risks for every business.
The Acelity, Inc. acquisition adds another layer of uncertainty and execution risk, along with new debt and near-term EPS dilution.
While the company is largely insulated from issues with any one customer or end market, a global economic slowdown could reduce sales.
The trade war between the US and China is magnifying this.
However, the company’s resiliency showed itself during the Great Recession. That’s about as tough as tests get.
For context, the company’s EPS dropped from $4.89 to $4.52 between FY 2008 and FY 2009. And the dividend kept right on growing. Not exactly the end of the world.
Overall, I see this as a low-risk business, as evidenced by their exemplary dividend track record.
If it had a lot of exposure to volatility and risk, there’s no way they’d be able to pay a growing dividend for over 60 years.
This is why this is a stock that has typically commanded a premium multiple.
But after a disappointing Q1, Mr. Market’s mood on this stock has quickly soured.
This is an opportunity to take advantage of that moodiness and get this stock at a great valuation…
Stock Price Valuation
The stock trades hands for a P/E ratio of 17.10.
That’s not only lower than the broader market, but it’s also well below the stock’s own five-year average P/E ratio of 23.1.
The cash flow multiple is also substantially lower than it usually is.
The P/CF ratio of 13.1 is way off of its three-year average of 19.1.
And the yield, as noted earlier, is markedly higher than its own recent historical average.
So the stock does look cheap. But how cheap is it? What would a rational estimate of intrinsic value look like?
I valued shares using a dividend discount model analysis.
I factored in a 10% discount rate and a long-term dividend growth rate of 7%.
That DGR is a bit lower than I’ve used in the past for this stock. I’m a little less sanguine now. The Q1 results were surprisingly weak, and the Acelity, Inc. is questionable.
But I also don’t see why the company can’t grow its dividend at this rate for years to come.
After all, they’ve grown both EPS and the dividend at rates much higher than this over the last decade.
The payout ratio is concerning. And the forecast for future EPS growth is much higher than this.
I find it unlikely the dividend growth rate would be much lower than this over the next decade or so, but I also think it’s unreasonable to expect the dividend to grow terribly faster.
The DDM analysis gives me a fair value of $205.44.
The reason I use a dividend discount model analysis is because a business is ultimately equal to the sum of all the future cash flow it can provide.
The DDM analysis is a tailored version of the discounted cash flow model analysis, as it simply substitutes dividends and dividend growth for cash flow and growth.
It then discounts those future dividends back to the present day, to account for the time value of money since a dollar tomorrow is not worth the same amount as a dollar today.
I find it to be a fairly accurate way to value dividend growth stocks.
Even a very level-headed look at valuation results in an intrinsic value estimate that’s far above the current price.
But we’ll now compare that valuation with where two professional stock analysis firms have come out at.
This adds balance, depth, and perspective to our conclusion.
Morningstar, a leading and well-respected stock analysis firm, rates stocks on a 5-star system.
1 star would mean a stock is substantially overvalued; 5 stars would mean a stock is substantially undervalued. 3 stars would indicate roughly fair value.
Morningstar rates MMM as a 4-star stock, with a fair value estimate of $190.00.
CFRA is another professional analysis firm, and I like to compare my valuation opinion to theirs to see if I’m out of line.
They similarly rate stocks on a 1-5 star scale, with 1 star meaning a stock is a strong sell and 5 stars meaning a stock is a strong buy. 3 stars is a hold.
CFRA rates MMM as a 3-star “HOLD”, with a 12-month target price of $195.00.
A rough consensus here. Averaging out the three numbers gives us a final valuation of $196.81, which would indicate the stock is possibly 22% undervalued.
 Bottom line: 3M Company (MMM) is a high-quality company that’s diversified across almost every industry, end market, and country in the world. With 61 consecutive years of dividend raises, a 3.5%+ yield, and the potential that shares are 22% undervalued, this is a rare moment in which this prototypical dividend growth stock appears to be on sale. Dividend growth investors should take a strong look at this stock here.
-Jason Fieber
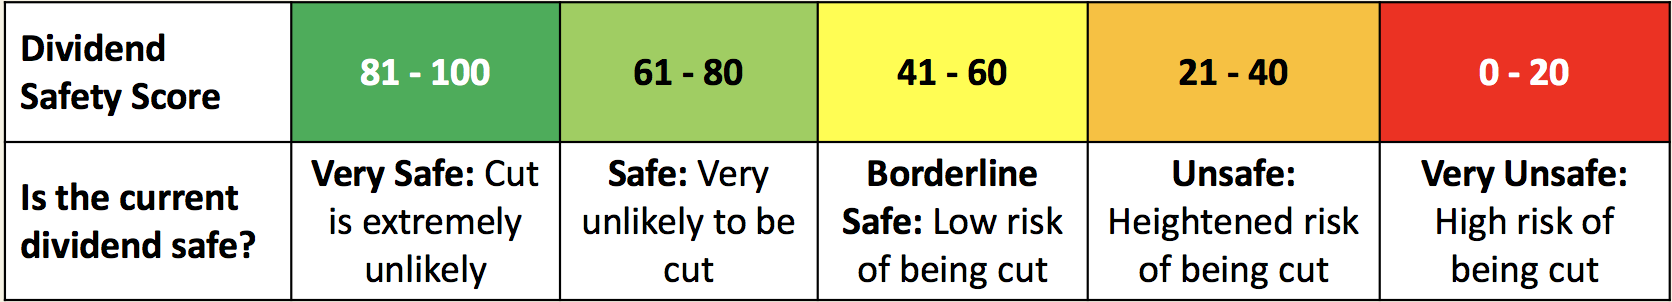
Note from DTA: How safe is MMM’s dividend? We ran the stock through Simply Safe Dividends, and as we go to press, its Dividend Safety Score is 86. Dividend Safety Scores range from 0 to 100. A score of 50 is average, 75 or higher is excellent, and 25 or lower is weak. With this in mind, MMM’s dividend appears very safe with an extremely unlikely risk of being cut. Learn more about Dividend Safety Scores here.
If you're buying rare earth or other critical mineral stocks, you're already one step behind - because we believe that political insiders in Washington are preparing to buy a whole new group of stocks, which could begin soaring 500%+ just days from now. The man once ranked in 2020 as America's #1 stock picker is doing something extraordinary and giving away the name and ticker of every single stock that could be next. Everything you need to know is here.
