

United States 2020 presidential candidate Andrew Yang is advocating for universal basic income.
He calls the payments, proposed at $12,000 per year for every American citizen, a “freedom dividend”.
It’s an interesting idea.
But I have an even better idea.
My idea is, create your own “freedom dividend”.
This doesn’t require a dark horse presidential candidate to win the US presidency, upon which time the complex layers of the US government would enter the picture and make it very difficult for such a concept to come to light.
My idea simply requires you to live below your means and invest in high-quality dividend growth stocks.
I know it works, because I did it.
I’ve created my own “freedom dividend”.
Actually, I’ve done a bit more than that.
I built my FIRE Fund by saving a large percentage of my middle-class income and investing that capital in a wide swath of world-class businesses.
I’m collecting hundreds of dividends per year. Beat that, Yang!
This dividend income is enough to pay for my essential expenses in life. This has rendered me financially independent.
 I was able to retire in my early 30s.
And I lay out how you can also retire early, in my Early Retirement Blueprint.
The companies I invest in can be found on the Dividend Champions, Contenders, and Challengers list.
This list contains invaluable information on more than 800 US-listed stocks that have raised dividends each year for at least the last five consecutive years.
 Now you see how my plan is better.
I’m not talking about a “freedom dividend”, which relies on the notoriously fickle US government.
I’m talking about hundreds of “freedom dividends”, which rely on world-class enterprises with proven long-term track records.
Not only that…
These dividends are growing!
That’s right. This isn’t about collecting a static dividend.
It’s about collecting numerous dividends that are increasing, typically at a rate that greatly exceeds inflation.
However, it’s important to be intelligent when investing your capital.
Performing fundamental analysis, calculating risk, and judging competitive advantages are all critical steps of the investment process.
Perhaps most importantly, valuation must be considered.
Price only tells you what a stock costs, but value tells you what a stock is worth.
An undervalued dividend growth stock should present a higher yield, greater long-term total return potential, and reduced risk.
This is relative to what the same stock might otherwise offer if it were fairly valued or overvalued.
All else equal, a lower price will result in a higher yield.
That’s because price and yield are inversely correlated.
The higher yield positively impacts total return, since TR is comprised of investment income and capital gain.
Plus, there’s possible capital gain “upside”.
If the stock market inaccurately prices a stock too low, investors can capitalize on that and ride the wave up as a stock later becomes more appropriately priced.
The higher yield and upside potential leads to greater long-term total return potential.
These dynamics should also reduce risk.
A price much lower than estimated intrinsic value creates a margin of safety.
This is a “buffer” that protects an investor’s downside, just in case any myriad of feasible problems were to develop over the course of investment.
Paying too high a price leaves you with no buffer, exposing you to a lot of downside in case a negative event were to occur.
These dynamics are clearly quite favorable to the long-term investor.
Fortunately, they’re not impossible to take advantage of.
But estimating intrinsic value is necessary.
Fellow contributor Dave Van Knapp has made valuing dividend growth stocks much easier with Lesson 11: Valuation, which is part of an overarching series of “lessons” on the dividend growth investing strategy.
With all of this in mind, let’s take a look at a high-quality dividend growth stock that appears to be undervalued right now…
 WestRock Company (WRK)
WestRock Company (WRK) is a leading integrated manufacturer of various corrugated and consumer packaging materials.
The company was formed through the 2015 merger between Rock-Tenn and MeadWestvaco.
With more than 320 manufacturing facilities across the world, WestRock Company has become one of the world’s largest producers of corrugated medium and linerboard. They sell these products to more than 15,000 customers.
Producing various paper products such as containerboard, folding cartons, and displays, the company’s packaging solutions are an integral part of end markets ranging from foodservice to healthcare.
Of course, we all know that the e-commerce theme is becoming a massive revolution in the way people shop. It stands to reason that an increase in individual shipments means greater demand for paper packaging materials.
The company reports in three segments.
Corrugated Packaging represented 56% of FY 2018 sales, while Consumer Packaging represented 45%. The Land & Development segment is immaterial and will cease to exist in FY 2019.
You might not think of WestRock Company when you’re going about your day-to-day life.
But their products show up almost everywhere.
Think about the beverages housed in paper containers. There’s the paper box medicine comes in. The corrugated box that protects a shipment.
So on and so forth.
It’s a boring business model. But boring can be so beautiful.
Dividend Growth, Growth Rate, Payout Ratio and Yield
And what’s especially beautiful is growing dividends.
WestRock Company has increased its dividend for 10 consecutive years according to the CCC list; however, this record predates the aforementioned merger.
If you want to look at the post-merger record, WestRock Company’s first official dividend increase in its current iteration occurred in 2016.
Either way you slice it, the company is clearly committed to a growing dividend.
The five-year dividend growth rate, per the CCC list, stands at a monstrous 27.0%.
 But this is skewed by the jump in the post-merger dividend.
The most recent dividend increase, which was announced in late 2018, was 5.8%.
This would be a more realistic dividend growth number to look at here.
Still, that’s plenty of dividend growth when the stock yields 4.57%.
That yield is more than twice what the broader market offers.
It’s almost 180 basis points higher than the stock’s five-year average, although that average has been affected by the merger.
A payout ratio of 51.9%, near my “perfect” mark of 50%, indicates plenty of dividend raises to come.
Free cash flow easily covers the dividend payments, so there’s no trouble here.
We’re basically looking at a big dividend that’s well-covered and growing much faster than inflation.
Music to my ears.
Revenue and Earnings Growth
But in order to estimate what kind of future dividend growth to expect, which will have a lot to say about the value of the business to investors, we must first look at what kind of sales and profit growth the business is producing.
I usually pull up a decade’s worth of top-line and bottom-line results, before comparing that to a near-term professional forecast.
Balancing the proven past with a near-term forecast gives us a lot to work with in terms of sketching out a growth trajectory moving forward.
However, WestRock Company, in its current form, has only been operating since mid-2015. Everything before that has almost no relevance to where things are at or going.
Thus, we’ll look at what’s occurred between FY 2015 and FY 2018. Then we’ll look at a professional forecast for the next three years. I’d rather have more to work with. But this is material information.
WestRock Company grew revenue from $11.381 billion in FY 2015 to $16.285 billion in FY 2018. That’s a compound annual growth rate of 12.69%.
This is obviously spectacular, although it’s slanted a bit because the merger wasn’t completed until mid-2015.
Meanwhile, earnings per share advanced from $2.93 to $4.09 over this period, which is a CAGR of 11.21%.
Also very impressive. Also slightly askew, though.
I used adjusted EPS for FY 2018 only because GAAP EPS for FY 2018 artificially jumped due to a significant one-time tax benefit.
It’s difficult to draw hard conclusions from this data because the time frame is so short.
But it’s very promising. I dare say, it’s exciting. This on a boring business model.
Looking forward, CFRA is predicting that WestRock Company will compound its EPS at an annual rate of 20% over the next three years.
This is an aggressive forecast, in my opinion.
Part of the thesis is based on acquisition optimism.
WestRock Company recently completed the $4.8 billion acquisition of KapStone Paper and Packaging Corporation, which strengthened WestRock Company’s US West Coast presence, added distribution capabilities, and also broadened the product portfolio.
This deal is expected to be quickly accretive with room for substantial synergies of $200 million in synergies realized by FY 2021.
It’s too early to tell how this will turn out, but it’s notable that WestRock Company achieved its $1 billion synergy and performance improvements goal that was set at the inception of company in 2015.
The good news is, they don’t have to grow at 20% in order to deliver strong dividend raises and total return.
Assuming a static valuation, the sum of yield and dividend growth should equate to total return.
Well, a starting yield of over 4.5% and continued dividend raises in line with what they last delivered (5.8%) sets investors up for a 10%+ annual total return picture – and that’s assuming no business acceleration.
All of this on a very simple business model that’ll put you to sleep. It’s pretty amazing.
That said, not everything is amazing here.
Financial Position
The balance sheet in particular is not amazing. In fact, it’s easily my biggest concern with the entire enterprise.
The long-term debt/equity ratio is 0.84, which is actually really good for a capital-intensive business model.
That number is from the most recent quarter (Q1 FY 2019). This includes the debt impact from KapStone.
However, the interest coverage ratio is low. I usually like to see an interest coverage ratio at above 5, at least.
The interest coverage ratio came in at right about 4.5 for FY 2018.
The most recent quarter showed an even lower interest coverage ratio (due to the acquisition), but I don’t like to look at the interest coverage ratio under a microscope like that because quarterly numbers can vary so much.
It’s difficult to say right now how things will shake out with their acquisition, but I do believe that paying down debt should be, and will be, a priority.
As such, even if growth acceleration materializes, I wouldn’t expect dividend growth to match it. That’s because of the debt reduction prioritization.
Profitability is OK for the industry. But I think there’s room for improvement here.
Both FY 2018 and FY 2016 had one-time impacts to GAAP numbers, which disrupted the profitability metrics.
Due to the fact that the current company has only been operating since 2015, it’s impossible to average things out.
TTM net margin is coming in at 5.44%, which is good. Not excellent. But good.
In some ways, WestRock Company is still finding it feet. That’s odd to say considering that the ancestor to The Mead Company (from MeadWestvaco) started in the paper business way back in 1846.
But I think there’s a lot of potential here. In fact, I recently decided to initiate a small position in this company because I believe in that.
Paper could be on the cusp of a new renaissance. After taking a major backseat to plastics over the last few decades, public sentiment has turned against plastic in favor of paper. This bodes well for the company – everything from bags to straws to packaging is tilting toward paper.
And with the growing phenomenon of e-commerce, the demand for high-quality corrugated packaging should only increase.
WestRock Company operates with huge scale in an industry with only a few major players. And they’re incredibly diversified, both in terms of their geographic footprint and list of customers.
Moreover, the risk of some kind of obsolescence is extremely low.
That isn’t to say there are no risks, however.
They are exposed to the greater global economy. What e-commerce giveth, it can taketh away. If there’s any kind of global economic slowdown, a major reduction in shipping and the buying of products leads to less demand for the paper materials.
Furthermore, the KapStone acquisition was quite large relative to the size of WestRock Company. If there are any problems with the purchase, this could negatively affect results in a big way.
A faster-than-expected rise in rates could also impair the company, as they currently operate with a lot of debt.
This is a commodity business. There’s a lack of pricing power. Higher raw material costs are difficult to pass on with a lack of pricing power.
Lastly, competition, regulation, and litigation are omnipresent risks in every industry.
But the stock pays shareholders a healthy and growing cash dividend to sit, wait, and watch the business improve as it integrates KapStone.
On top of that, the stock looks attractively valued after falling almost 40% over the last year…
Stock Price Valuation
The P/E ratio is sitting at 11.38, which is obviously much lower than the broader market.
The P/CF ratio, which factors out the GAAP noise, is at 4.2 here. That’s approximately half the industry average. It’s also significantly lower than the three-year average P/CF ratio of 7.5.
I believe it’s important to recognize that the stock’s price now is actually much lower than it was when WestRock Company formed – in mid-2015. That was almost four years ago.
And the yield, as noted earlier, is markedly higher than both the market and the stock’s own recent historical average.
So the stock does look cheap. But how appealing might it be? What would a rational estimate of intrinsic value look like?
I valued shares using a dividend discount model analysis.
I factored in an 9% discount rate (due to the high yield) and a long-term dividend growth rate of 5%.
This is clearly very conservative.
After all, the long-term track record for dividend growth greatly exceeds the DGR I’m using in this DDM. Even the most recent dividend increase was higher than this.
Plus, the payout ratio is near my “perfect” mark.
To put it simply, I’m erring on the side of caution here.
The balance sheet is slightly concerning.
And that should be a priority moving forward, which limits my enthusiasm and expectations for high dividend growth.
But even just 5% dividend growth on a high-yield like this stock offers plenty of aggregate income over the long run.
The DDM analysis give me a fair value of $47.77.
The reason I use a dividend discount model analysis is because a business is ultimately equal to the sum of all the future cash flow it can provide.
The DDM analysis is a tailored version of the discounted cash flow model analysis, as it simply substitutes dividends and dividend growth for cash flow and growth.
It then discounts those future dividends back to the present day, to account for the time value of money since a dollar tomorrow is not worth the same amount as a dollar today.
I find it to be a fairly accurate way to value dividend growth stocks.
Even with a conservative valuation analysis, I came out with a fair value that is remarkably higher than the current stock price. That jibes with the disconnect between the current and historical basic valuation metrics, as shown above.
But we’ll now compare that valuation with where two professional stock analysis firms have come out at.
This adds balance, depth, and perspective to our conclusion.
Morningstar, a leading and well-respected stock analysis firm, rates stocks on a 5-star system.
1 star would mean a stock is substantially overvalued; 5 stars would mean a stock is substantially undervalued. 3 stars would indicate roughly fair value.
Morningstar rates WRK as a 4-star stock, with a fair value estimate of $53.00.
CFRA is another professional analysis firm, and I like to compare my valuation opinion to theirs to see if I’m out of line.
They similarly rate stocks on a 1-5 star scale, with 1 star meaning a stock is a strong sell and 5 stars meaning a stock is a strong buy. 3 stars is a hold.
CFRA rates WRK as a 3-star “HOLD”, with a 12-month target price of $43.00.
I came out right in the middle. Averaging out the three numbers gives us a final valuation of $47.92, which would indicate the stock is potentially 20% undervalued right now.
 Bottom line: WestRock Company (WRK) is a packaging giant that offers a great way to play the e-commerce boom. With a yield over 4.5%, a decade of dividend raises, nearly a “perfect” payout ratio, and the potential that shares are 20% undervalued, investors interested in creating their own “freedom dividend” should take a close look at this dividend growth stock.
-Jason Fieber
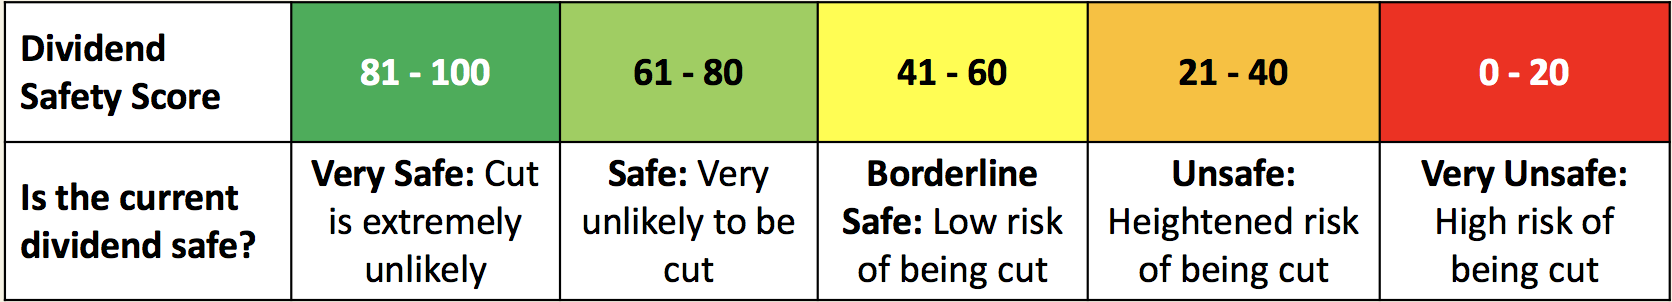
Note from DTA: How safe is WRK’s dividend? We ran the stock through Simply Safe Dividends, and as we go to press, its Dividend Safety Score is 47. Dividend Safety Scores range from 0 to 100. A score of 50 is average, 75 or higher is excellent, and 25 or lower is weak. With this in mind, WRK’s dividend appears borderline safe with a low risk of being cut. Learn more about Dividend Safety Scores here.
Top Stock Expert Who Called Nvidia at Less Than a Dollar Says... "$1,000 in Each of These Stocks Could Make You a Millionaire" By 2030.
