

Living off of dividends.
Is it just a pipe dream?
It’s definitely not a pipe dream, but it can be a dream lifestyle.
But there’s a great way to go about it.
And many ways to not go about it.
The best way to go about it, in my experience, is to buy high-quality dividend growth stocks when they’re undervalued.
Hold these stocks for the long haul. Reinvest growing dividend income.
Voila!
Before you know it, you’re living off of dividends.
I know. I make it sound simple. But it’s really not that complex.
In fact, I can tell you that I personally went from below broke at 27 years old to financially free at 33 by following that exact recipe.
I share the recipe and results in my Early Retirement Blueprint.
The results speak for themselves.
I built my FIRE Fund by buying high-quality dividend growth stocks when they were undervalued.
I sat on those stocks and reinvested the growing dividend income until it was enough to live off of.
The Fund now generates the five-figure and growing passive dividend income I need to cover my essential expenses.
 Dividend growth stocks can make for an excellent passive income and early retirement bedrock.
They are often blue-chip stocks. We’re talking about equity in world-class businesses here.
Take a look at the Dividend Champions, Contenders, and Challengers list to see what I mean.
That list contains information on more than 800 US-listed stocks that have raised their dividends each year for at least the last five consecutive years.
 As it stands to reason, it typically takes a pretty phenomenal business to be able to pay out growing cash dividends to shareholders year after year.
Of course, not every company on that list is operating at a high level right now.
And businesses that are doing well aren’t frequently on sale.
That’s why I’m taking the time today to shine the light on a business that appears to be both high quality and on sale.
Valuation at the time of investment can play a critical role in an investment’s performance.
Price only tells you what you pay; value is what something is worth.
An undervalued dividend growth stock should offer a higher yield, greater long-term total return prospects, and reduced risk.
 These attributes are relative to what the same stock might otherwise offer if it were fairly valued or overvalued.
Price and yield are inversely correlated.
All else equal, a lower price will result in a higher yield.
Total return is the sum of investment income and capital gain.
A higher yield should translate into more investment income. That leads to greater long-term total return potential.
Capital gain could be given a boost, too, via the “upside” possible between price and value.
The market sometimes misprices stocks. Buying when that mispricing is favorable gives you a chance at capital gain if/when a more rational repricing occurs.
That’s on top of the capital gain that would play out over time as a high-quality company naturally increases its profit and becomes worth more
Naturally, this reduces risk.
Risking less capital on the same asset should always be the goal of an investor.
Paying less introduces a margin of safety.
That acts as a “buffer” that protects your downside against unforeseen events that can erode both capital and value.
Fortunately, it’s not impossible to spot and take advantage of undervaluation.
Fellow contributor Dave Van Knapp put together a great template for valuing dividend growth stocks.
It’s available as part of an overarching series of “lessons” on dividend growth investing.
Check out Lesson 11: Valuation for more on that.
With all of this in mind, let’s take a look at a high-quality dividend growth stock that appears to be undervalued right now…
 Eastman Chemical Company (EMN)
Eastman Chemical Company (EMN) is a global specialty chemical company that manufactures and markets a wide range of advanced materials, chemicals, and fibers which are used in various consumer and industrial products.
The company operates across four segments: Additives & Functional Products, 36% of FY 2018 sales; Chemical Intermediates, 28%; Advanced Materials, 27%; and Fibers, 9%.
Sales by customer location broke down for FY 2018 as follows: United States and Canada, 42%; Europe, Middle East, and Africa, 27%; Asia Pacific, 25%; and Latin America, 6%.
Major end-use markets include Transportation, Consumables, and Building & Construction.
Originally founded in 1920, and later spun off from parent company Eastman Kodak Company (KODK) in 1994, the company now operates as one of the world’s largest specialty chemical companies.
I love investing in boring companies. Some of the best investments I’ve ever made will put you to sleep when you hear about how they make money.
Well, this is a very boring business model.
And that’s what makes it beautiful.
Let’s just take a look at some of the products their materials and chemicals go into: packaging adhesives, architectural coatings, fungicides, rubber tires.
These are everyday products that are necessary to everyday life.
Boring, perhaps.
But you know what’s not boring?
Making money.
Dividend Growth, Growth Rate, Payout Ratio and Yield
Well, Eastman Chemical Company is proficient at both making money and returning a large chunk of that money directly to shareholders.
 They’ve paid an increasing cash dividend for nine consecutive years.
Not only that, but they’ve been extremely consistent with the dividend raises.
The 10-year dividend growth rate is 9.8%. And the most recent dividend increase came in at 10.7%.
Love it.
On top of the long-term dividend growth rate that’s approaching double digits, the stock currently yields 3.03% right now.
That’s well in excess of the broader market’s yield.
It’s also more than 50 basis points higher than the stock’s own five-year average yield.
Meanwhile, the payout ratio, at a comfortable 32.8%, leaves plenty of room for future dividend raises.
The dividend metrics are really quite strong across the board. And their relative short dividend growth track record belies their overall philosophy regarding dividend growth, as there’s been a clear commitment to the dividend and growth of it for over 20 years.
But in order to estimate where this company and its dividend will go moving forward, which will also help us value the stock, we’ll first have to construct an overall trajectory of earnings growth.
Revenue and Earnings Growth
I’ll first show you what the company has done over the last decade in terms of top-line and bottom-line growth. Then I’ll compare that to a near-term professional growth forecast.
Eastman Chemical Company grew its revenue from $5.047 billion in FY 2009 to $10.151 billion in FY 2018. That’s a compound annual growth rate of 8.07%.
Very strong sales growth here. They came out of a challenging period (07-09) with all cylinders firing. And it’s been almost completely secular. Other than a hiccup in in FY 2016, it’s been a straight line up.
Earnings per share increased from $0.93 to $7.56 over this period, which is a CAGR of 26.22%.
This is obviously incredible stuff here, but I’m not sure I’d draw too many conclusions from it. The starting period was a highly unusual earnings trough.
However, even the CAGR for EPS over just the last five years is still in the double digits. We can now see how that strong dividend growth has been fueled.
Looking forward, CFRA is predicting that Eastman Chemical Company will compound its EPS at an annual rate of 8% over the next three years.
CFRA’s thesis builds in higher prices, overall greater volumes, margin expansion, and stabilizing costs across energy and raw materials that are slightly offset by challenges and uncertainty in China.
The 8% EPS growth prediction is lower than what the company has produced over both the short term and long term.
But we have to keep in mind that this is a cyclical, commodity business. Being cautious, with how long the economic expansion has gone on in the US, isn’t a bad idea.
Still, 8% EPS growth could easily drive low-double-digit dividend growth based on how low the payout ratio is at.
Drilling things down even further, free cash flow for FY 2018 came in at $1.08 billion, of which only $318 million went to dividends.
Financial Position
Moving over to the balance sheet, the company is on solid footing; however, I do think there’s room for improvement here.
The long-term debt/equity ratio is 1.0, while the interest coverage ratio comes in at 6.5. Total cash is fairly insignificant.
The good news here, though, is that both metrics have markedly improved over the last five years.
Whereas a lot of companies out there have been loading up on debt and deteriorating their financial positions in recent years, Eastman Chemical Company has reduced its debt and put itself in a better position.
Profitability has also improved quite a bit recently.
Over the last five years, the company has averaged annual net margin of 10.26% and annual return on equity of 22.12%.
These are very good numbers for a commodity business like this, in my view.
The averages were helped a bit by a spike in FY 2017 metrics after the company took a one-time gain related to US tax reform. However, the last five years exceeds the preceding five years, in any case.
Overall, there’s a lot to like about Eastman Chemical Company.
They provide a number of key chemicals and materials that go into numerous everyday products that make up everyday life.
Their diversification across chemicals, products, end-markets, and geographies is impressive.
Fundamentally, the company is strong. And the dividend metrics are great.
It’s ultimately a cyclical business that is in commodities, so we have to keep that in mind.
But I think it qualifies as a high-quality business.
Better yet, the valuation looks very appealing…
Stock Price Valuation
The P/E ratio is a lowly 10.88.
Now, this isn’t a high-flying growth stock. But that looks awfully nice when compared to the stock’s own five-year average P/E ratio of 12.5 (which is low in its own right).
It’s also obviously well below that of where the broader market stands.
In addition, the P/CF ratio of 7.6 is notably lower than its three-year average mark of 8.2.
And the yield, as discussed earlier, is materially higher than its own recent historical average.
The stock does look cheap. But how cheap might it be? What would a reasonable estimate of intrinsic value look like?
I valued shares using a dividend discount model analysis.
I factored in a 10% discount rate and a long-term dividend growth rate of 7%.
In my opinion, that long-term DGR is a fair look at where this company is at.
If anything, it’s quite conservative.
The payout ratio (using both EPS and FCF) is very low, the long-term EPS growth rate is in the double digits, and the forecast for EPS growth moving forward is higher than 7%.
But I like to err on the side of caution, especially when we’re talking about a business model that is highly sensitive to economic cycles.
The DDM analysis gives me a fair value of $88.45.
The reason I use a dividend discount model analysis is because a business is ultimately equal to the sum of all the future cash flow it can provide.
The DDM analysis is a tailored version of the discounted cash flow model analysis, as it simply substitutes dividends and dividend growth for cash flow and growth.
It then discounts those future dividends back to the present day, to account for the time value of money since a dollar tomorrow is not worth the same amount as a dollar today.
I find it to be a fairly accurate way to value dividend growth stocks.
The stock doesn’t look like a steal. Not from where I’m sitting. However, it does look like a high-quality dividend growth stock that is at least moderately undervalued.
But we’ll now compare that valuation with where two professional stock analysis firms have come out at.
This adds balance, depth, and perspective to our conclusion.
Morningstar, a leading and well-respected stock analysis firm, rates stocks on a 5-star system.
1 star would mean a stock is substantially overvalued; 5 stars would mean a stock is substantially undervalued. 3 stars would indicate roughly fair value.
Morningstar rates EMN as a 3-star stock, with a fair value estimate of $94.00.
CFRA is another professional analysis firm, and I like to compare my valuation opinion to theirs to see if I’m out of line.
They similarly rate stocks on a 1-5 star scale, with 1 star meaning a stock is a strong sell and 5 stars meaning a stock is a strong buy. 3 stars is a hold.
CFRA rates EMN as a 5-star “STRONG BUY”, with a 12-month target price of $92.00.
I came out low here, which isn’t a surprise considering my cautious stance. Averaging out the three numbers gives us a final valuation of $91.48, which would indicate the stock is possibly 12% undervalued right now.
 Bottom line: Eastman Chemical Company (EMN) is a high-quality company with great fundamentals. The business has dramatically improved in recent years and is highly diversified across the board. With almost a decade of dividend increases under its belt, double-digit dividend growth, a very low payout ratio, a yield over 3%, and the potential that shares are 12% undervalued, dividend growth investors should definitely take a good look at this stock.
-Jason Fieber
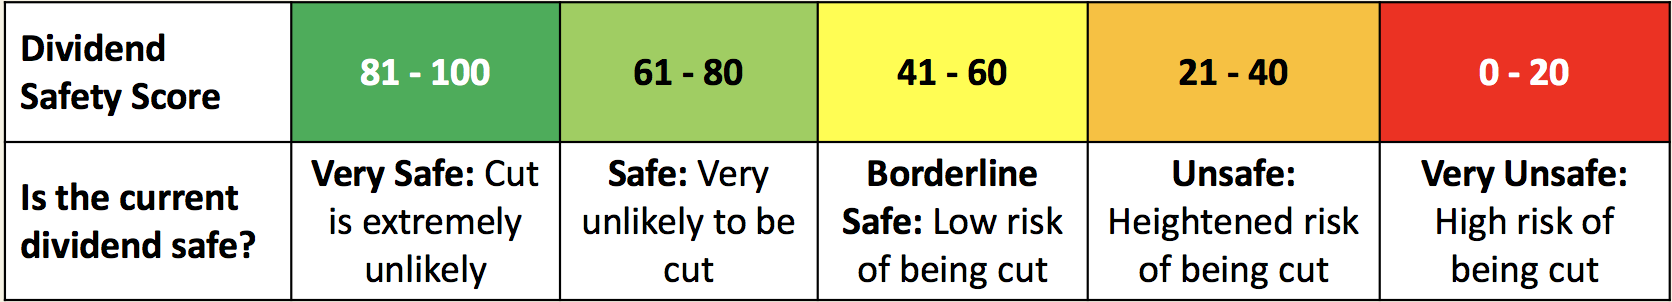
Note from DTA: How safe is EMN’s dividend? We ran the stock through Simply Safe Dividends, and as we go to press, its Dividend Safety Score is 75. Dividend Safety Scores range from 0 to 100. A score of 50 is average, 75 or higher is excellent, and 25 or lower is weak. With this in mind, EMN’s dividend appears safe with an unlikely risk of being cut. Learn more about Dividend Safety Scores here.
The company manufacturing Nvidia's AI servers trades under a secret name. AI revenue: $30B this year. Stock price: $8. Click for the hidden identity →
