Yesterday, we covered the importance of owning stocks with world-class fundamentals … things like earnings growth and profit margins.
In addition to rating stocks based on critical fundamental data, we have developed a way to rate stocks based on how “in demand” they are with the stock market’s elephants.
Market pros like to say that a stock in great demand among money managers is “under accumulation.”
Much like how scientists can monitor the pressure building in an underground hot spring and anticipate the timing of a geyser, we can monitor the pressure building under high-growth stocks … and anticipate their explosive “geyser-like” moves higher.
Said another way, our computers can “x-ray” the market and see stocks that are under heavy accumulation … just like the unseen pressure building in an underground hot springs.
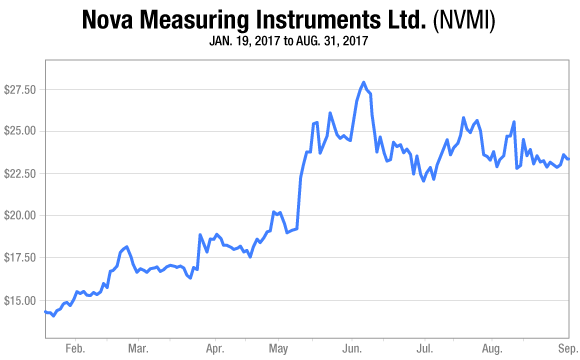
For example, in early 2017, a semiconductor equipment company called Nova Measuring Instruments Ltd. (NASDAQ:NVMI) began registering extraordinary fundamental qualities like major earnings growth, expanding profit margins and strong returns on equity. It also began registering very strong institutional buying pressure.
We recommended the stock just before it entered a “geyser” phase that produced a 96% return in less than six months.
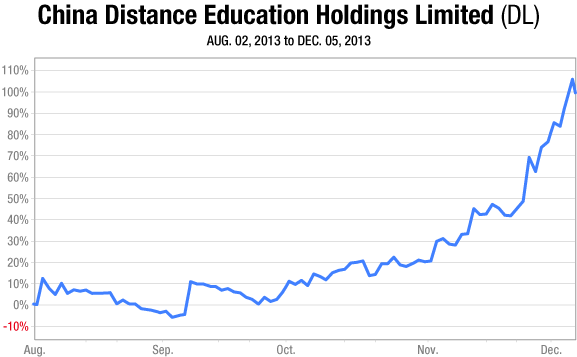
 Or, take the case of China Distance Education Hldgs Ltd (ADR) (NYSE:DL). It’s a China-based provider of online education focusing on helping people obtain and maintain job skills, licenses, and certifications. They specialize in everything from accounting and law to healthcare and construction. In August 2013, it began sporting incredible fundamental ratings along with strong institutional buying pressure ratings. We recommended the stock just before “elephant buying” ran it up 105% in about four months.
 By this point, you might be wondering exactly how our “underground sensors” in the stock market work … how we spot stocks under heavy accumulation by big money managers.
Our analytical model is actually pretty simple. Here’s how it works…
You may have heard of a financial concept called “alpha.” Alpha measures the performance of an investment against a market benchmark like the S&P 500. The investment’s return relative to the benchmark’s return is the investment’s “alpha.”
Alpha is quoted as a number. For example, if the S&P 500 rises 10% in a given year and a stock rises 12% during that same time, the stock has an alpha of 2. If the S&P rises 20% and the stock rises 25%, the stock has an alpha of 5.
Our system scans the market for stocks with alpha. We find stocks that tend to rise more than the market. But we don’t stop there.
Many stocks that exhibit alpha (or “beat the market”) are more volatile than the broad market. You’ve probably been told that in order to make market-beating gains, you have to take bigger risks and accept more volatility.
But our research has shown that some extraordinary stocks beat the broad market while at the same time are LESS volatile than the broad market. These “magic” stocks are things of beauty: Bigger returns, less volatility.
We rank stocks according to a combination of alpha and volatility. Those stocks that are going up the most with the least volatility are ranked the highest. Obviously, only the stocks that are enjoying very strong institutional buying pressure can manage to both beat the market AND be less volatile than the overall market. Only constantly flowing rivers of capital can allow stocks to behave this way.
When an elite stock with incredible fundamentals and strong buying pressure reports earnings, it tends to create a “geyser” event … where the stock makes a large price advance in a short amount of time. An earnings report often acts as the “catalyst” that draws in more buyers and sets off big price runs.
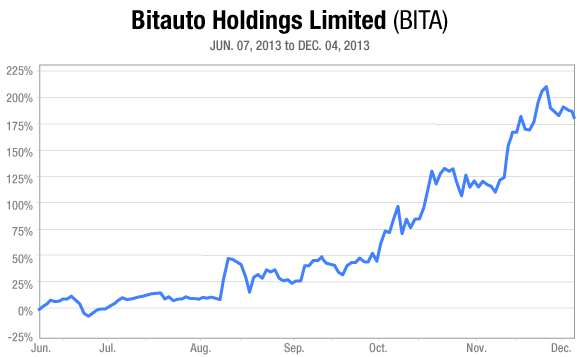
Our buying pressure analysis led us to recommend shares of Chinese online car shopping firm Bitauto Hldg Ltd (ADR) (NYSE:BITA) to our readers in June 2013. The stock soared 209% in about eight months.
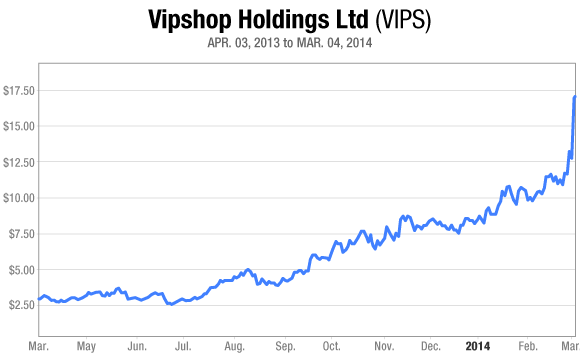
 Our buying pressure analysis led us to recommend online retailer Vipshop Holdings Ltd – ADR (NYSE:VIPS) to our readers in April 2013. The stock soared 487% in just under a year.
 Our buying pressure analysis led us to recommend automaker Ferrari NV (NYSE:RACE) to our readers in early 2017. The stock soared 100% in just under a year.
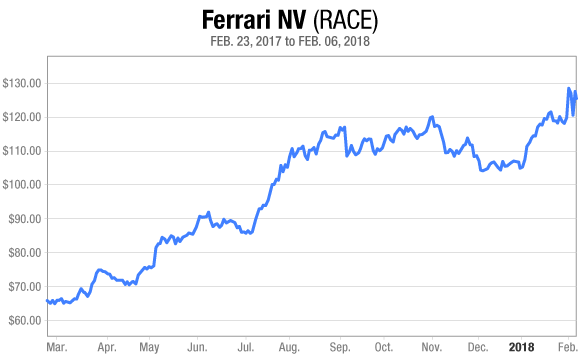 Considering that the broad market’s long-term (inflation-adjusted) return is around 7% per year, you can see how powerful these hyper-growth stocks are.
If you make 7% per year, it will take you about 10 years to double your money. A high-quality growth stock in “geyser” phase can double your money in six months. These stocks put you in wealth creation’s express lane.
And I can’t emphasize it enough: Earnings drive stock prices. The reason these stocks can deliver such large returns in short time frames is because they have the world’s strongest earnings growth.
Over the past 15 years, these “best of the best” stocks have performed phenomenally well compared to the broad market.
Stocks that meet our stringent fundamental and technical requirements gained, on average, 0.33% per week over the past 15 years. The broad market (as measured by the S&P 500) gained, on average, 0.18% per week over the same time. That’s a giant outperformance of 83.3%.
As you can imagine, outperforming the broad market by an average of 83.3% per week produces market-crushing returns over time.
The chart below shows what this outperformance looks like. It shows the growth of our “best of the best” strategy versus the growth of the S&P 500 from late 2003 to spring of 2018 (both sets of returns are compounded weekly).
The S&P 500 started at 100 and climbed to 312. Our “best of the best” strategy started at 100 and climbed to 1,775 (more than five times better).
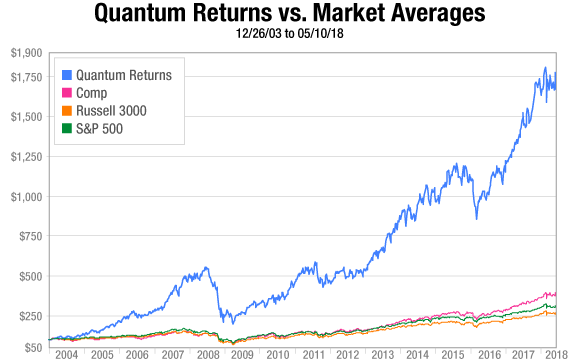 To be clear, I’m not saying anyone achieved those exact returns. I’m simply saying that stocks in the top 1% of fundamental ratings tend to rise much faster than the broad market. And I’m saying that if you’re looking for an edge in the market, you’ll find it by owning stocks in the market’s top 1%. Consistently putting this edge to work over time can allow you to pile up huge capital gains.
As I mentioned earlier in this essay series, I didn’t set out to find stocks that deliver giant short-term gains. I set out to find elite growth stocks my readers could hold onto for years.
But over years of studying the world’s top growth stocks, my team and I kept seeing “geyser” phases — compressed periods of hyper share price appreciation — over and over and over. The returns were so extraordinary that we had to start sharing our work with readers.
This “accidental discovery” can make people hundreds of thousands of dollars in extra stock market profits.
Sell Super Stocks When You See This
Every good short-term investment has a buy.
Every good short-term investment has a sell.
So when should we sell a stock that has enjoyed a “geyser” phase that has produced 30% — 300% profits for us in a matter of months?
It’s actually easy…
The fundamental and technical factors that set A-plus stocks apart from the pack and indicate that we should buy them are the same factors we monitor to know when we should sell them.
Put simply, we watch for declining institutional buying support. We monitor the elephants.
Once a stock’s institutional buying support ratings begin to weaken, we sell the stock and move on to the next big opportunity.
For example, above I mentioned that we made a 96% gain in less than six months in semiconductor equipment company Nova Measuring Instruments Ltd. (NASDAQ:NVMI).
But after we made those gains, Nova began to began to lose its ability to outpace the market with reduced volatility. We sold it June 2017 and moved on to stronger stocks.
 Summing Up
Uncovering the “super stocks” — the stocks with elite fundamentals that generate massive short-term gains — I’ve been telling you about is one of the most exciting and significant events in my career.
Their ability to generate big returns with a lack of real volatility never ceases to amaze me. Their ability to generate returns in weak markets never cease to amaze me. In 2001, 2002, and 2003, this approach did very well, despite the broad market’s weakness.
As I mentioned in this essay, on average, these stocks have performed 83.3% better than the broad market. When applied consistently over time, that’s an edge that can add an extra zero to your net worth.
If you’re willing to learn something new, and willing to put in a little more work than the average investor to make a LOT more money, using the strategy I’ve told you about could be one of the greatest financial decisions you ever make.
Regards,
Louis Navellier
To carry out Trump's Executive Order #14196 initiative, the administration will have to partner with a handful of U.S. companies that control the "reserve accounts" sitting on trillions of dollars' worth of untapped natural resources. I've spent months digging into this – and I've identified three companies that have already been granted "emergency status" and fast-track approvals. I believe their shares could skyrocket once new capital starts moving into the sector. See the three stocks that I expect to be the biggest winners as this plan rolls.
Source: Investor Place


