

The American publicly traded Internet domain registrar and web hosting company, headquartered in Scottsdale, Arizona, Godaddy Inc. (NYSE: GDDY) seems to be poised for a decline in its price in the near term as per its latest charts.
Bearish Indications
#1 Head and Shoulders Pattern: The daily chart shows that the stock has broken down from a head and shoulders pattern with high volume. This is a bearish pattern and is marked in orange color in the daily chart. Once a stock breaks down from a head and shoulders pattern, it usually moves lower in the near-term.
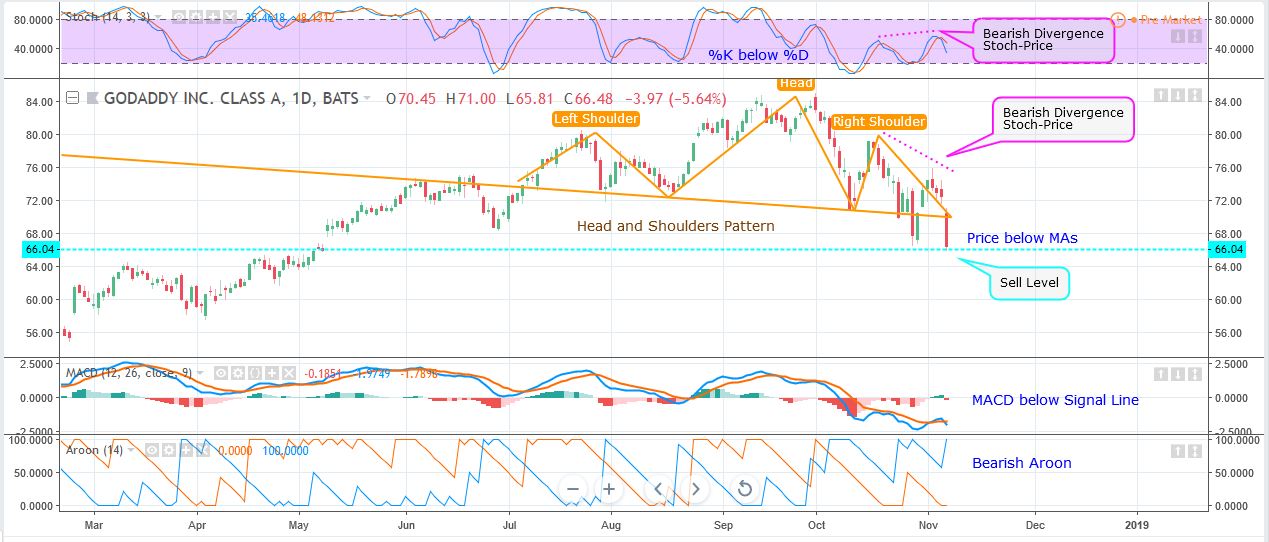
Daily Chart – GDDY
#2 Hidden Bearish Divergence between Stoch and Price: The daily chart shows that there is a hidden bearish divergence between Stochastic and price. This is marked as pink dotted lines. While the stochastic was making higher highs, the price was forming lower highs. This is a possible bearish sign.
#3 Price below MAs: The price is currently below both 50-day as well as 200-day SMA, indicating bearishness.
#4 MACD below signal line: The MACD line (blue color) is currently below the MACD signal line (orange color), indicating bearishness.
#5 Bearish Stochastic: The stochastic in the daily chart shows that the %K line is below the %D line. This is also a bearish sign.
#6 Bearish Aroon: The value of Aroon Up (orange line) is below 300 while Aroon Down (blue line) is above 70. This indicates bearishness.
#7 Flag Pattern Breakdown: The weekly chart shows that the stock has currently broken down from a flag pattern. This is marked in purple color lines. A breakdown from flag pattern usually indicates bearishness.
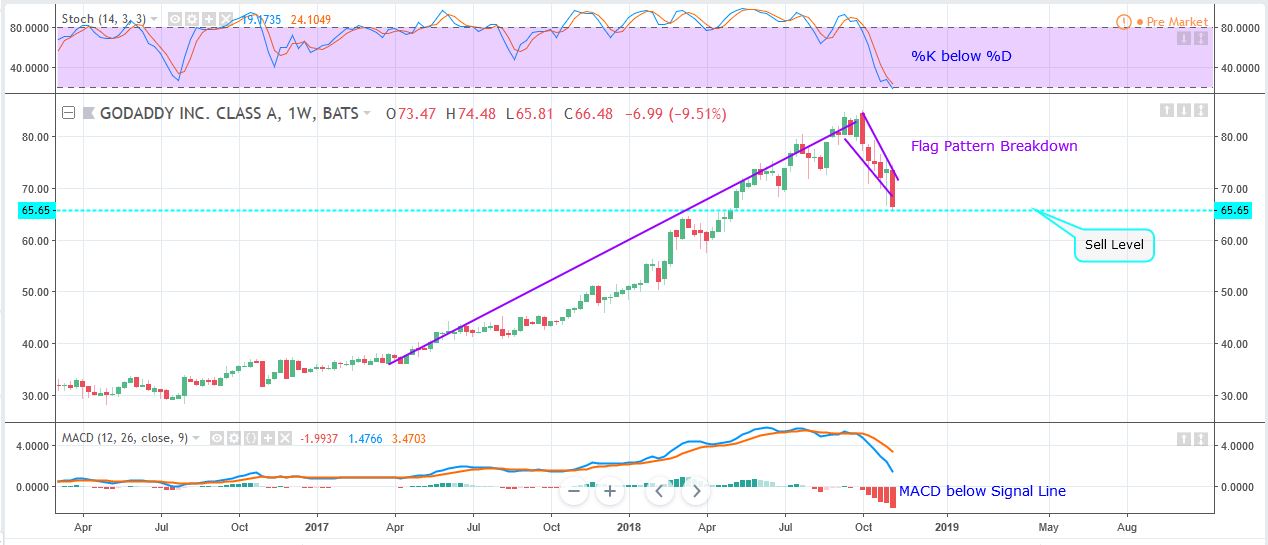
Weekly Chart – GDDY
#8 %K below %D in Stochastic: The stochastic in the weekly chart also shows that the %K line is below the %D line. This also indicates bearishness.
#9 MACD below signal line: The MACD line (blue color) is currently below the MACD signal line (orange color) in the weekly chart as well, indicating bearishness.
Recommended Trade (based on the charts)
Sell Levels: If you want to get in on this trade, the ideal sell level for GDDY is below the price of $65.70.
TP: Our target prices are $60 and $50 in the next 3-6 months.
SL: To limit risk, place a stop loss at around $68.70. Note that this stop loss is on a closing basis.
Our target potential downside is almost 9% to 24% in the next 4-6 months.
For a risk of $3.00, our target rewards are $5.70 and $15.70. This is a nearly 1:2 and 1:5 risk-reward trade.
In other words, this trade offers nearly 2x to 5x rewards compared to the risks.
Risks to Consider
The stock may reverse its overall trend if it takes support near the gap support level at the current price, or takes support at the 50-week SMA of GDDY and move upwards. The breakout of the stock could also be triggered in case of any positive news, overall strength in the market, or any regulatory changes in its sector.
Happy Trading!
Tara
If you're buying rare earth or other critical mineral stocks, you're already one step behind - because we believe that political insiders in Washington are preparing to buy a whole new group of stocks, which could begin soaring 500%+ just days from now. The man once ranked in 2020 as America's #1 stock picker is doing something extraordinary and giving away the name and ticker of every single stock that could be next. Everything you need to know is here.
