
We’ve never had more choices or options than we do right now, in the 21st century.
You can just about buy or do anything – day or night.
While it’s exciting to know you can buy merchandise online at 3 a.m. or, say, get a pizza at midnight, there’s only one store and one kind of merchandise that should be the center of one’s focus until they’re financially independent.
That store is the stock market.
And the merchandise is high-quality dividend growth stocks.
If there’s no luxury greater than your time (and thus your life), then it makes no sense to spend more money than necessary on anything other than that which will allow you to take ownership over your time.
Indeed, this was a thought process I developed in my late 20s, which was the catalyst behind a multi-year journey that saw me go from below broke at 27 to financially free at 33.
I’ve even shared how that journey unfolded through my Early Retirement Blueprint, which is a step-by-step guide that almost anyone can apply to their own situation.
 The foundation of that journey, as well as my current financial freedom, is dividend growth investing, which is a long-term investment strategy that involves buying equity in world-class businesses that are regularly and routinely growing their profit and sending shareholders growing cash dividends (a portion of aforesaid growing profit).
The real-life manifestation of that as it relates to my own journey, wealth, and financial freedom is my FIRE Fund.
That’s my real-money, six-figure dividend growth stock portfolio that generates the five-figure and growing passive dividend income I need to cover my bills.
 Building that portfolio simply required living below my means and following the tenets of dividend growth investing.
I was never short on investment ideas, either, as the Dividend Champions, Contenders, and Challengers list is a phenomenal resource that has compiled data on almost 900 US-listed stocks that have paid rising dividends each year for at least the last five consecutive years.
Of course, there’s a bit more to it than just saving some coin and buying stock off of that list.
You have to do your due diligence, which includes analyzing fundamentals, competitive advantages, risks, and valuation.
It’s that last part that’s so important because price is simply what you pay, but value is what you end up getting for your money.
Knowing the price of a stock tells you almost nothing. Knowing the value tells you almost everything.
And when undervaluation (i.e., the price is below intrinsic value) is present on a high-quality dividend growth stock, you’re really setting yourself up for an advantageous long-term investment.
An undervalued dividend growth stock should offer a higher yield, greater long-term total return potential, and less risk.
That’s relative to what the same stock might otherwise offer if it were fairly valued or overvalued.
I’ll show you how that works.
Price and yield are inversely correlated. All else equal, a lower price will result in a higher yield.
That higher yield goes on to positively impact total return potential right off the bat, due to the fact that total return is comprised of capital gain and investment income (via dividends or distributions).
With the higher yield (and thus more dividends or distributions on your initial investment), you’re looking at greater long-term total return potential.
 And that’s before factoring in the additional capital gain opportunities via the “upside” that’s available if/when the gap between price and value closes.
While the stock market isn’t necessarily great at accurately pricing stocks over the short term, price and value do tend to more closely mirror each other over the longer term.
Furthermore, that upside is on top of whatever capital gain naturally results from a business becoming worth more over time (as it increases its profit).
This all has a way of reducing risk, too.
You build in a margin of safety when you pay a price that’s below estimated intrinsic value, for one can never precisely predict the future.
Any number of unfavorable events can occur, which would negatively impact intrinsic value.
As such, an intelligent investor will always aim to pay a price that’s as far below estimated intrinsic value as possible, which reduces the odds that the investment ends up being worth less than one paid.
Fortunately, it’s not that difficult to put these dynamics in your favor.
You simply need to have a system in place that allows you to recognize and take advantage of undervaluation.
Well, fellow contributor Dave Van Knapp has offered up an excellent system.
Part of his overarching series of “lessons” that are designed to teach investors the ways of dividend growth investing, Lesson 11: Valuation specifically focuses on valuation.
It’s a great system that can be applied to almost any dividend growth stock out there.
With all of this in mind, let’s take a look at a high-quality dividend growth stock that appears to be undervalued right now…

International Business Machines Corp. (IBM)
International Business Machines Corp. (IBM) is an information technology company, engaged in creating value and solving problems for clients. They provide software, hardware, and technology service solutions, along with related financing. They operate in over 170 countries.
IBM has one of the lengthiest corporate histories out there for a technology company.
Dating back to 1911, they’ve been around for more than 100 years – that’s longer than many companies in any industry, let alone tech.
As you might imagine, IBM has had to adapt to changing trends in tech in order to stay relevant.
Indeed, they started out focused on electric tabulating machines way back when. IBM then really made itself into a juggernaut with its mainframes.
Well, tech has undergone some major shifts recently.
On-site storage and computing (requiring expensive, heavy hardware and infrastructure) has moved over to cloud computing and storage, while data and analytics have big become big businesses.
Whereas IBM used to have a very “sticky” business model by installing its mainframes, the entire industry has moved away from this.
And so has IBM. With its “strategic imperatives” (focusing on cloud and analytics), the company has adapted once again.
Those strategic imperatives now make up 48% of the company’s revenue (as of the most recent quarter).
Of course, there have been bumps along the way, and the company’s legacy businesses in hardware have deteriorated faster than expected (and faster than IBM could move into new businesses).
But recent quarters are finally showing the turnaround gain traction.
Meanwhile, “Big Blue” may as well be known as “Big Dividend”, because they’re paying out a big and growing dividend.
The stock yields a monstrous 4.35%.
That’s more than twice the broader market. That’s twice the industry average. And it’s more than 120 basis points higher than the stock’s own five-year average yield.
It’s not just yield, though: IBM has increased its dividend for 23 consecutive years, which is a veritable lifetime in tech.
 This is further proof of this company’s stalwart nature in its industry.
The 10-year dividend growth rate stands at 14.7%, which is incredible growth no matter how you slice it.
But it’s especially impressive when you’re getting that kind of dividend growth on top of that big yield.
While the payout ratio, at 100% of TTM GAAP EPS, looks unsustainable and irresponsible first glance, that’s only because IBM had to take a big hit to Q4 earnings after the passage of the 2017 Tax Cuts and Jobs Act – IBM had to take a charge against overseas cash.
Factoring in adjusted EPS for FY 2017 Q4 alone, the payout ratio comes in at a more reasonable 50.1%.
So we’ve got a big, sustainable, and growing dividend that smashes most of its competition.
But we invest in where a company (and dividend) is going, not where it’s been.
That means we have to estimate future growth, which will greatly aid us when the time comes to value the business and its stock.
However, knowing what a company has done over a long period of time tells us something about where it might be going.
We’ll now look at what IBM has done in terms of top-line and bottom-line growth over the last decade, and we’ll compare that to a near-term forecast for profit growth.
Combining the known past and estimated future in this manner should allow us to extrapolate out some reasonable ideas about where IBM is going.
IBM’s revenue has decreased from $103.630 billion in FY 2008 to $79.139 billion in FY 2017.
This is obviously not what we want to see.
There has been shrinkage in IBM’s core legacy businesses (discussed earlier). And the company has stumbled on its way to replacing that lost revenue with new sources of income. However, a significant chunk of this revenue decrease can also be attributed to a realignment in the company as a whole, as IBM has sold off numerous businesses over the last decade.
Earnings per share moved from $8.89 to $13.80 (using operating EPS for FY 2017) over this same period, which is a compound annual growth rate of 5.01%.
That’s a pretty fair look at what IBM has done over the last decade: we’re talking mid-single-digit growth here.
It’s not fantastic. But the sky isn’t falling, either.
And recent numbers indicate this is probably a pretty accurate expectation looking out over the near future – IBM posted 4% YOY revenue growth, 5% YOY GAAP EPS growth, and 5% non-GAAP EPS growth for its most recent quarter (Q2 FY 2018).
For further perspective on that, CFRA is forecasting that IBM will compound its EPS at an annual rate of 5% over the next three years.
Now, IBM wouldn’t have to grow EPS much faster than this in order to be an appealing investment. Based on the payout ratio and IBM’s commitment to its dividend, one should think that dividend growth would at least match that kind of EPS growth moving forward.
But I actually think there’s room for a surprise to the upside here, based on the fact that this last decade has arguably been the most challenging in the entire history of IBM.
They simply didn’t move fast enough. They didn’t adapt as quickly as they should have. And now they’re trying to catch up.
But they are catching up: revenue is finally growing once more, and cloud revenue was up 26% YOY (based on the as-a-service annual exit run rate).
Moving over to the balance sheet, IBM is actually capitalized really well.
The balance sheet is something that seemingly confuses investors, especially if one isn’t familiar with a balance sheet.
But the balance sheet is actually rather strong.
The long-term debt/equity ratio, which is a very simplistic and unreliable metric that’s not very insightful, is high. It’s sitting at 2.26.
But that’s largely because common equity is misleadingly low (due to a massive amount of treasury stock).
In addition, IBM finances part of its business. While long-term debt is sitting at almost $40 billion, the company has Global Financing debt of $31.1 billion. Moreover, cash is sitting at over $12 billion.
A more accurate look at its situation is the interest coverage ratio. At over 19, IBM obviously has no issues with its debt or ability to service that debt.
Profitability is robust, and this should become even more robust as the company continues to move into higher-margin (but less sticky) services and software.
Over the last five years, the company has averaged annual net margin of 13.55% and annual return on equity of 70.92%.
ROE is obviously inflated by low common equity, and the net margin took a hit from the aforementioned tax changes. But the trend is moving in the right direction.
Overall, there’s a lot to like about IBM.
The company went through a rough period. Perhaps the roughest period they’ve ever had.
However, they’ve worked hard to position themselves well; recent numbers indicate the ship is (finally) turning.
While you wait for that hard work to pay dividends, you’re getting paid dividends: the stock is yielding well over 4%, and IBM has an illustrious track record for reliable dividend raises.
There are risks, of course. Technology is always changing (which led to this situation), and IBM has recently been slow to adapt. Competition, regulation, and a move to less sticky businesses should all be carefully considered.
But the stock has been totally cast aside, leading to a valuation that’s almost absurd…
The stock is trading hands for a P/E ratio of 11.54 (using TTM EPS that factors in operating EPS for Q4 2017).
That’s less than half the broader market’s P/E ratio. It’s also less than half the industry average.
I think a lower multiple is deserved based on growth challenges, but this is pretty extreme.
Every basic valuation metric (P/S, P/CF, P/B) is well below its respective recent historical average for this stock.
And the yield, as noted earlier, is significantly higher than its own five-year average.
So the stock does look cheap here, but how cheap might it be? What might the stock intrinsically be worth?
I valued shares using a dividend discount model analysis.
I factored in a 9% discount rate and a 5.5% long-term dividend growth rate.
That DGR is well below IBM’s long-term demonstrated DGR, and the payout ratio is still reasonable.
However, EPS growth over the last ten years, as well as the forecast for EPS growth moving forward, would make it more prudent to pin the estimate of future dividend growth in this range.
That said, as I discussed earlier, this particularly challenging period might not be a very good basis for which to judge the entire future of the business. As such, this is a pretty conservative valuation, in my view.
The DDM analysis gives me a fair value of $189.30.
The reason I use a dividend discount model analysis is because a business is ultimately equal to the sum of all the future cash flow it can provide.
The DDM analysis is a tailored version of the discounted cash flow model analysis, as it simply substitutes dividends and dividend growth for cash flow and growth.
It then discounts those future dividends back to the present day, to account for the time value of money since a dollar tomorrow is not worth the same amount as a dollar today.
I find it to be a fairly accurate way to value dividend growth stocks.
My valuation, as conservative as I believe it is, still shows a severely discounted stock, which is in line with what many of the basic valuation metrics are indicating.
However, that’s just one perspective of many, which is why we’ll take a look at what professional stock analysts are saying about this stock and its valuation.
Morningstar, a leading and well-respected stock analysis firm, rates stocks on a 5-star system.
1 star would mean a stock is substantially overvalued; 5 stars would mean a stock is substantially undervalued. 3 stars would indicate roughly fair value.
Morningstar rates IBM as a 3-star stock, with a fair value estimate of $168.00.
CFRA is another professional analysis firm, and I like to compare my valuation opinion to theirs to see if I’m out of line.
They similarly rate stocks on a 1-5 star scale, with 1 star meaning a stock is a strong sell and 5 stars meaning a stock is a strong buy. 3 stars is a hold.
CFRA rates IBM as a 4-star “BUY”, with a 12-month target price of $175.00.
I came out a bit high, but averaging the three numbers out gives us a final valuation of $177.43, which would indicate the stock is potentially 23% undervalued.
 Bottom line: International Business Machines Corp. (IBM) is a stalwart in its industry, with an unparalleled history of adapting to changes. Recent results have indicated that they’ve adapted once more. And with a 4%+ yield, more than 20 consecutive years of dividend raises, and the possibility that shares are 23% undervalued, dividend growth investors may want to consider adding this “Big Dividend” stock to their portfolios.
-Jason Fieber
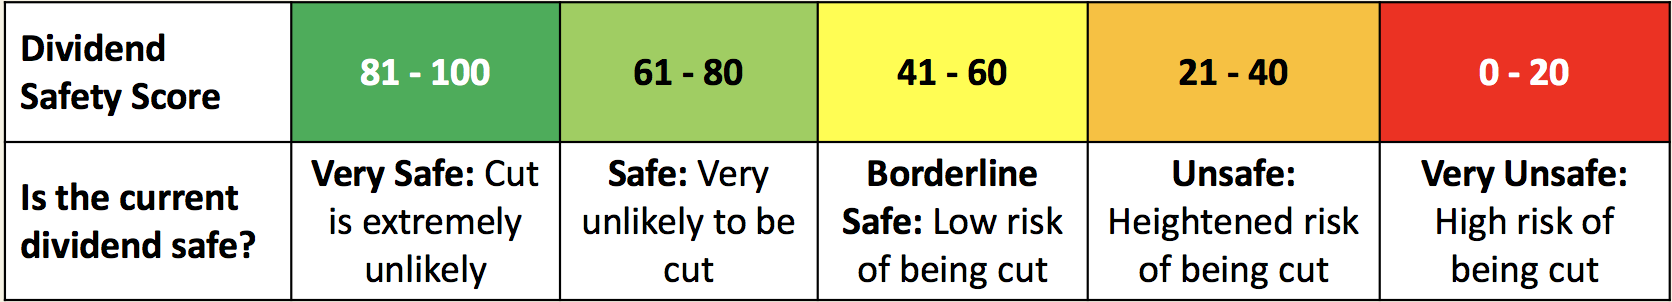
Note from DTA: How safe is IBM’s dividend? We ran the stock through Simply Safe Dividends, and as we go to press, its Dividend Safety Score is 92. Dividend Safety Scores range from 0 to 100. A score of 50 is average, 75 or higher is excellent, and 25 or lower is weak. With this in mind, IBM’s dividend appears very safe and extremely unlikely to be cut. Learn more about Dividend Safety Scores here.
AI stocks are positioned to explode under Trump's pro-tech policies. Discover Louis Navellier's top AI picks to watch as the industry braces for a major shift. Explore the Full List.

