
The Oklahoma-based company engaged in the acquisition, management, and development of non-operated oil and natural gas properties, Panhandle Oil and Gas Inc. (NYSE: PHX) shows signs of an upcoming price surge based on its latest charts.
Bullish Indications
#1 IH&S Pattern in Daily chart: As you can see from the daily chart below, over the past several weeks, the stock has been forming an Inverted Head and Shoulders (IH&S) pattern. An IH&S pattern is a strong bullish pattern and is marked in orange color in the chart below. After the completion of the IH&S pattern, the stock may move higher in the short term.
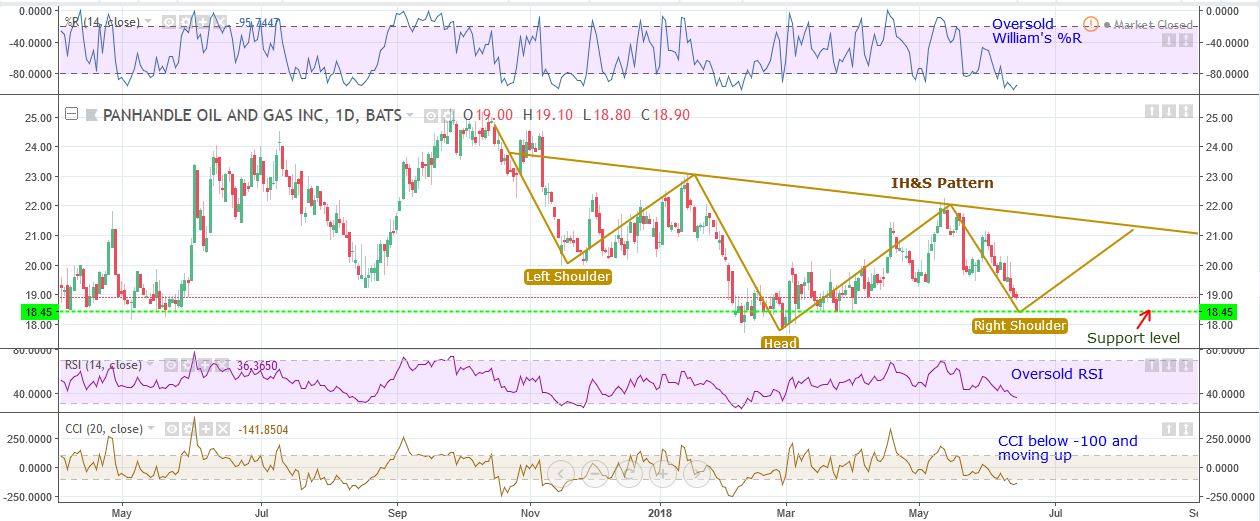
Daily Chart – PHX
#2 Near Support Level: The stock is currently near a long-term support level. This is marked as a green dotted line. This seems like a good level for the stock to move higher.
#3 Oversold RSI: In the daily chart of PHX, RSI is near oversold levels, indicating the possibility of an upmove soon.
#4 CCI moving above -100: In the daily chart, the readings of CCI is below -100 and starting to move up slowly.
This means that it can potentially start an uptrend.
#5 Oversold William’s %R: The daily chart shows that William’s %R is near oversold levels as it is currently below -80.
This is a possible bullish sign.
#6 Triangle Pattern: The weekly chart shows that the stock is forming a triangle pattern. This is marked in purple color lines in the chart below. This triangle has been forming with higher lows and lower highs. This indicates that the stock may possibly break out upwards and move higher.
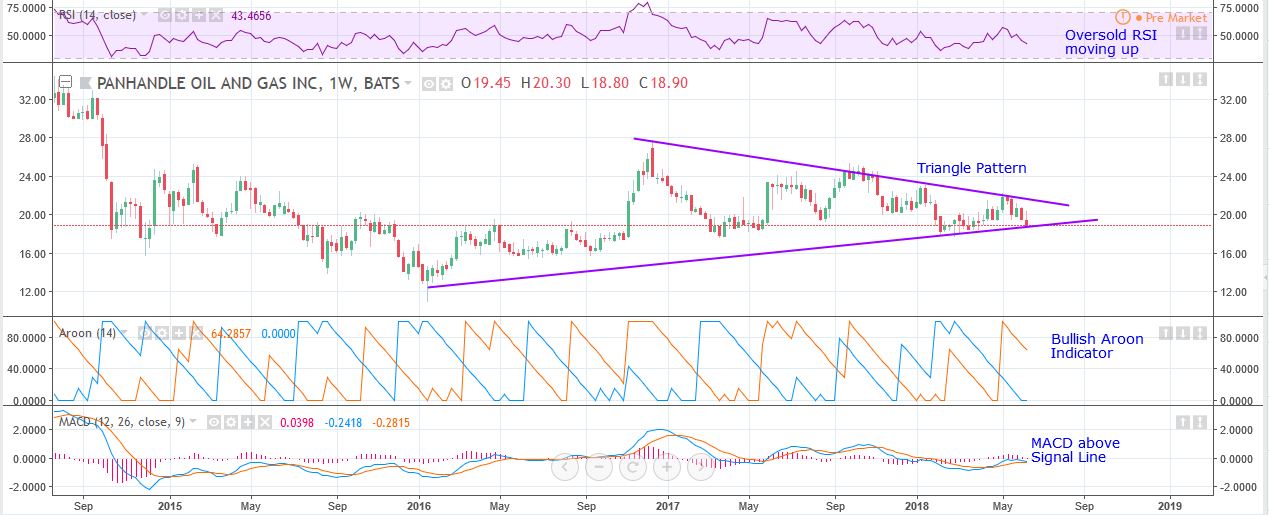
Weekly Chart – PHX
#7 Bullish Aroon: The value of Aroon Up is above 70 while Aroon Down is below 30. This indicates bullishness.
#8 Strong RSI: The RSI is oversold and moving up, indicating strength.
#9 MACD Above Signal Line: As you can see from the weekly chart, the MACD line (blue color) is currently above the signal line (orange color), indicating a bullish bias.
Recommended Trade (based on the charts)
Buy Price: If you want to get in on this trade, you can purchase the shares of PHX at the price range of $18 to $18.95 (CMP).
TP: Our target prices $22 and $28.
SL: To limit risk, place a stop loss below $16.50. Note that this stop loss is on a closing basis.
Our target potential upside is almost 22% to 55% in the next 3-5 months.
- Entering at $18: For a risk of $1.50, our target rewards are $4.00 and $10.00. This is a nearly 1:3 and 1:7 Risk-Reward trade.
- Entering at $18.95: For a risk of $2.45, our target reward (TP#2) is $9.05. This is a nearly 1:4 Risk-Reward trade.
In other words, this trade offers nearly 3x to 7x more potential upside than downside.
Risks to Consider
The stock may reverse its overall trend if it breaks down with high volume from the current levels before completing the formation of the Inverted Head and Shoulders pattern. The sell-off of the stock could also be triggered in case of any negative news, overall weakness in the market, or any regulatory changes in the sector.
Happy Trading!
Tara
P.S. If you’re looking for more breakout stock ideas like this one, head over to TradesOfTheDay.com. I have a daily column over there where I profile stocks that look set to surge based on their current technical setups.
Top Stock Expert Who Called Nvidia at Less Than a Dollar Says... "$1,000 in Each of These Stocks Could Make You a Millionaire" By 2030.
