
The stock market has been especially volatile this year, and that’s proving to be a boon for the price of gold…
The CBOE Market Volatility Index (VIX) more than tripled its January average on Feb. 5, when the Dow Jones sank more than 1,000 points. The VIX is still nearly double its Jan. 1 level.
Since the start of 2018, there have been some 100 trading days with a daily movement of at least 1%.
That’s a great sign for gold prices in 2018.
Volatility indicates uncertainty, and precious metals tend to thrive in that kind of environment.
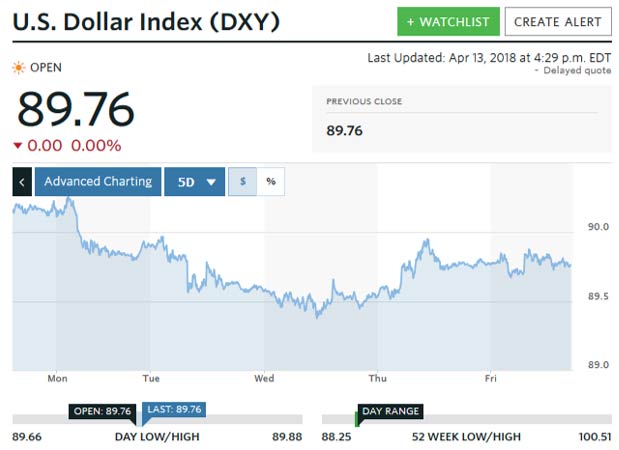
Meanwhile, the U.S. Dollar Index (DXY) continues to hover in a holding pattern after retreating by a full 100 basis points in the past week.
While the dollar is moving sideways in its near-term action, it’s likely headed lower in the medium term, and that should help support higher gold prices.
These are excellent trends supporting my 2018 gold price prediction. And I’ll show you exactly how they impact my latest gold price target right after we take a look at last week’s highlights for gold prices…
The Price of Gold Rode Volatility Higher
After climbing stealthily on Monday (April 9) and Tuesday (April 10), gold prices soared on Wednesday (April 11) to a seven-week high as U.S. President Donald Trump tweeted his plan to attack Syria.
The uncertainty surrounding a potential military conflict in Syria spurred gold buying, as it’s traditionally a safe-haven holding.
June Comex gold futures reached as much as $1,361 intraday on Wednesday, helped also by weaker-than-expected inflation data.
Analysts believe weaker data could cause the U.S. Federal Reserve to raise rates more slowly, hurting the dollar and helping gold. Spot gold prices were up 1%, while gold stocks jumped 2.2% as the Dow Jones Industrial sank 1%.
You can see how the DXY sank from its Monday open here…
The bullish sentiment behind gold gave way to optimism in the stock market on Thursday (April 12).
The dollar enjoyed a bounce as stocks gained again, and both weighed on gold as it gave back two days of gains. But on Friday, markets opened higher, then reversed and ultimately closed down. Gold enjoyed a renewed bounce, ending the week at $1,345 as the DXY softened to around 89.75.
While gold prices saw a modest gain last week, all signs are pointing to an even more lucrative future for the yellow metal.
Here’s exactly what I see in store for gold prices this year, including my updated price targets…
The Cards Are Falling Just Right for Gold Prices in 2018
Despite gold’s ups and downs last week, the precious metal continues to stealthily build a constructively higher price.
Although gold’s been moving steadily higher within its upward trend channel since early 2017, it does appear to be consolidating more recently within a sideways range, as you can see below…
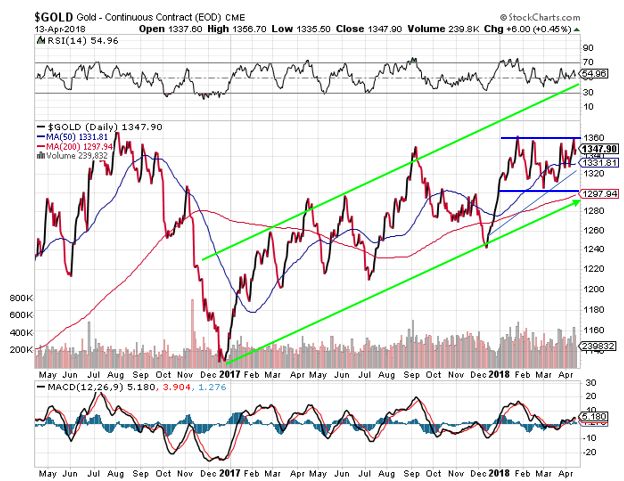
That sideways trend has kept gold between $1,300 and $1,365 since the start of 2018. But that’s just a 4.5% trading range at current gold prices.
If we zoom in closer, you’ll notice that gold has managed to stay mostly above its 50-day moving average, around $1,330, since late March.
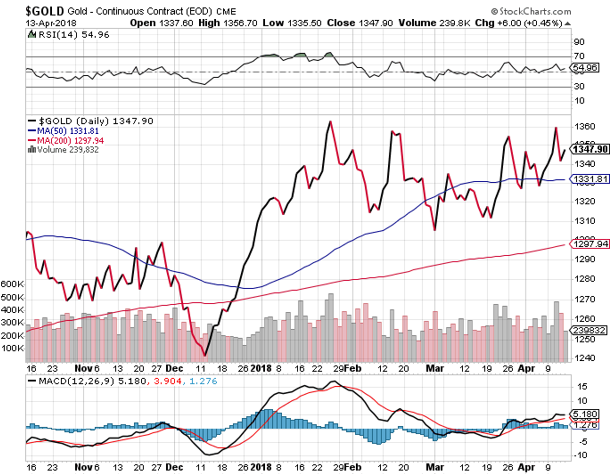
Barring any real strength in the U.S. dollar, I think the 50-day moving average will start to act as a support line.
And the dollar is facing opposite pressure.
In the same way the 50-day moving average may become support for gold, it could also become overhead resistance for the DXY.
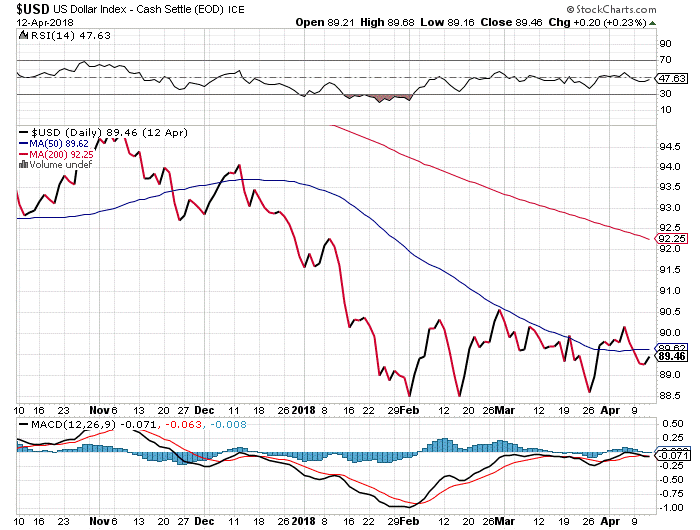
When the DXY eventually breaks down below 88.5, that could do wonders for gold prices as it reinforces the dollar’s bear market action.
As for gold stocks, the price action over the past year has understandably managed to frustrate the bulls.
Check out the sideways trading range for the VanEck Vectors Gold Miners ETF (NYSE Arca: GDX)…
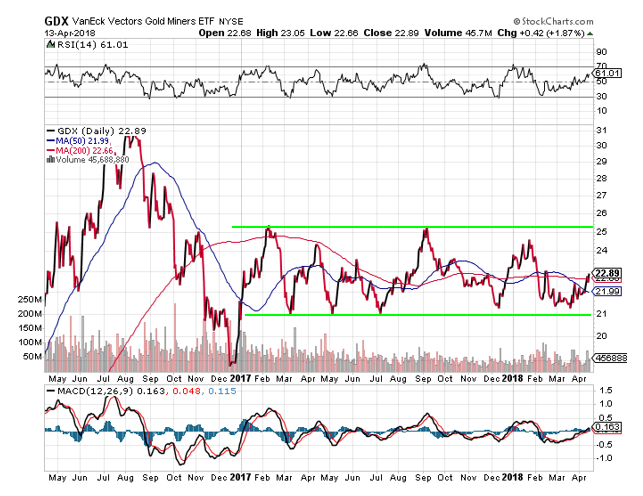
That’s a long time to remain between $21 and $25.50 for the GDX.
But if we put this chart under the magnifying glass, we can see the beginning of a bullish trend.
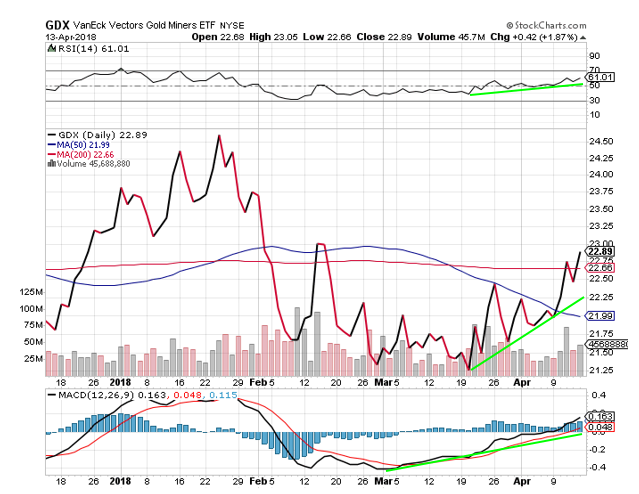
While GDX has been rising since late March, the RSI indicator has been confirming that momentum, and the MACD was already trending higher since early March.
Perhaps more significant is the GDX-to-gold ratio.
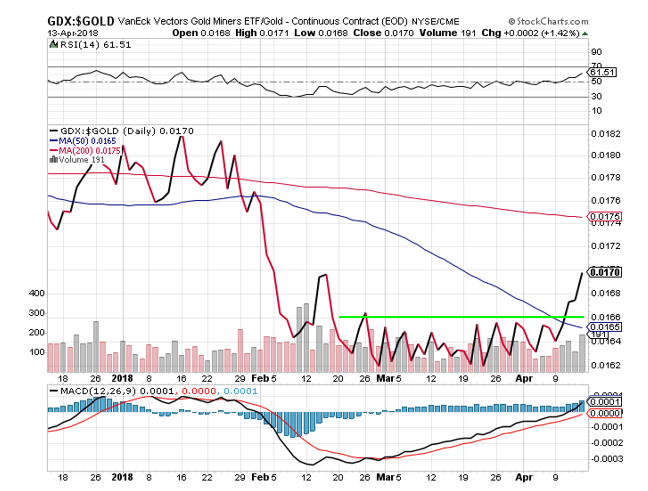
Last week, I suggested the possible rounding bottom for this ratio could mean a “breakout” for this sector. Over the past week, this ratio has broken higher. Both the RSI and MACD have been predicting this for at least a month.
It’s looking like momentum is on the side of gold stocks, which could be leading the metal higher.
A recent report by Macquarie Research commodity analysts says they see precious metals as holding the best potential within the broader commodity sector, with gold prices rising into 2020. The report cited the risk of higher inflation and a weaker greenback thanks to bloated U.S. deficits.
At this juncture, seasonal strength could push gold to $1,400 by summer, then tackle the $1,500 level by year’s end.
— Peter Krauth
Source: Money Morning
