

Today, I’m sharing one of the most important stock market studies you’ll see all year.
It demonstrates a powerful idea… And the result is a simple and effective way to outperform the benchmark indexes AND avoid some of the worst stock market declines in history.
If you’re nervous about being in stocks today, this issue is for you…
The study involves the benchmark S&P 500 Index and its 200-day moving average (or “200-DMA”)…
A lot of professionals use the 200-DMA to size up a market’s long-term trend.
It works by collecting an asset’s closing prices from the past 200 days, then taking the average of those prices. This produces a chart line that “smoothes out” market volatility.
During bull markets, assets tend to spend most of their time above the 200-DMA.
During bear markets, they spend most of their time below it.
But today, we’re looking at something even more important…
The 200-DMA itself is the long-term trend. And it acts like a magnet. Whether it’s moving higher or lower, assets tend to have a hard time going in the opposite direction for long.
So unless you’re looking at a short-term trade, you rarely want to bet that an asset will move lower when its 200-DMA is moving higher, and vice versa.
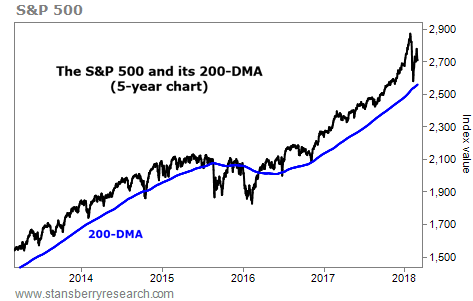
If you’re not familiar with the 200-DMA, this is what it looks like plotted on a five-year chart. You can see that it doesn’t jolt around like the S&P 500 does. And it rarely changes direction…
 Now, I could just tell you that you want to own stocks when the 200-DMA is rising and sell your stocks when it starts to fall. But the proof is too powerful to not include it…
Last week, I took a look back at what happened any time the 200-DMA changed direction over the last 35 years. In order to weed out insignificant changes, I only counted the shifts in which the 200-DMA rose or fell every trading day for a full month.
This only happened 18 times over that period. Some of these changes preceded huge bull and bear markets.
In the chart below, I’ve marked these 18 occasions. This could be one of the most valuable pictures you see all year. The red arrows show “sell points” – times when the 200-DMA turns lower for at least a month. And the green arrows show “buy points” – times when the 200-DMA turns higher for at least a month…
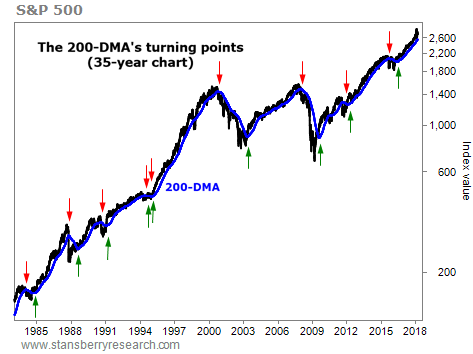 What would have happened if you bought stocks at the green arrows and sold at the reds?
The chart starts on December 31, 1982… just a shade over 35 years ago. Here’s how you would have done if you put $10,000 into the S&P 500 that day, and used this simple buy and sell system after that (through the study date, last week). Keep in mind, this doesn’t include dividends…
 Aside from one little fake-out in 1994, every buy point resulted in a double-digit gain or more.
You would have multiplied your money 22-fold, turning $10,000 into more than $220,000 – a 2,104% return. That’s a fantastic result.
Here’s what you would have missed by selling your stocks at the red arrows, rather than holding all the way through…
 You would have missed some single-digit gains and a couple of 17% gains. But you also would have missed the worst part of two brutal bear markets – 32.5% losses during the dot-com bust, and 26.1% losses during the financial-crisis bust.
That’s a huge amount of avoided stress. Plus, it would have freed up your cash for other opportunities.
What would have happened if you simply bought stocks on December 31, 1982 and held all the way through to February 20?
A buy-and-hold strategy would have delivered a 1,831% gain – 272 percentage points less than our 200-DMA buy-and-sell strategy. And you would have had your money tied up in stocks for an additional 7.5 years (four of which were no fun at all).
So what do you do with this information?
I don’t recommend sticking to this 200-DMA system strictly (although you could do a lot worse). Instead, I consider this a guide for our trading and investing behavior…
As you saw in the first chart today, the 200-DMA is still on the rise. It’s nowhere near a turning point. So we know we still want to own stocks and make bullish trades.
As long as the trend is up, we see little reason to change our medium- or long-term outlook.
It’s a bull market. So stay long.
Good trading,
Ben Morris
I recently visited Mar-a-Lago... And now I'm prepared to put my reputation on the line. Since 1998, my proprietary system would've returned 13,126% in backtests. (That's 13X the S&P and 106X the average investor, according to JP Morgan.) However, one investment I just uncovered could be my biggest winner of all... It involves President Trump, Elon Musk, trillions of dollars, China... And a MAJOR upgrade to the artificial intelligence revolution. See for yourself!
Source: Daily Wealth
