
The company that owns and operates family-oriented theme parks that are located in various areas of the United States, Cedar Fair, L.P. (NYSE: FUN), shows signs of an upcoming price surge according to its latest charts.
Bullish Indications
#1 IH&S Pattern: The daily chart of FUN shows that over the past several months, the stock has been forming an Inverted Head and Shoulders (IH&S) pattern, which is a strong bullish pattern.
After the completion of the IH&S pattern, the stock may move higher in the short term.
#2 Above MA: The stock is currently trading above its 50-day SMA as well as 200-day SMA.
The 50-SMA is currently moving upwards to cross above 200-SMA. This indicates overall bullishness for the stock.
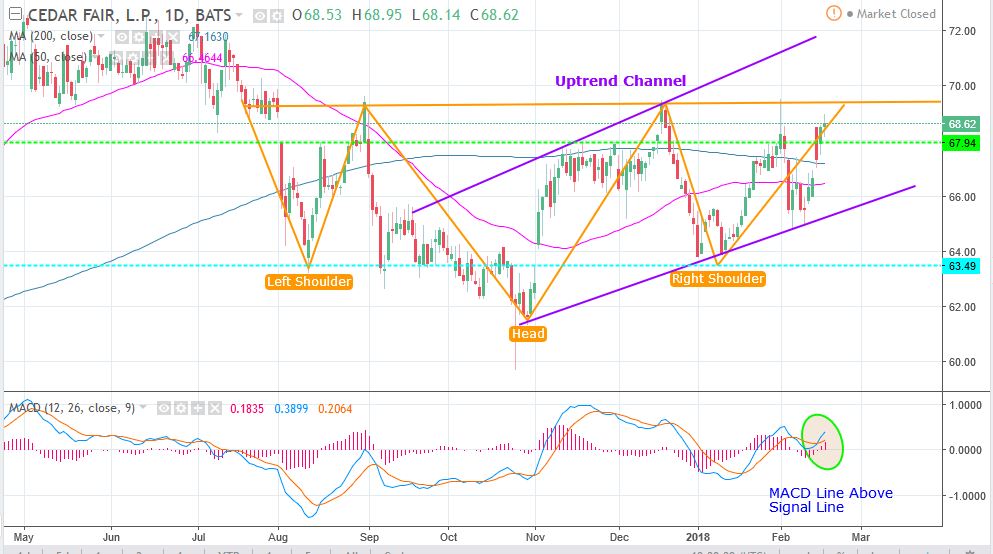
Daily Chart – FUN
#3 MACD Cross above Signal Line: The daily chart of FUN shows that the MACD (light blue color) has crossed above the MACD signal line (orange color). When this happens it typically indicates a bullish setup as a potential buy signal is generated.
Note: The stock is currently trading within an uptrend channel which is marked in purple color in the daily chart above. The ideal buy point is when the stock crosses above the IH&S pattern, or when the stock corrects to the lower end of the uptrend channel.

Weekly Chart – FUN
#4 Weekly MACD Cross: The weekly chart of FUN also shows that the MACD (light blue color) has crossed above the MACD signal line (orange color), indicating potential bullishness.
#5 Fibonacci Support: The stock had taken support at the 50% Fibonacci retracement level before bouncing back as shown in the weekly chart above.
Recommended Trade (based on the charts)
Buy Price: If you want to get in on this trade, you can purchase shares of FUN in two scenarios.
#1 When the stock moves above IH&S pattern. This translates to a price above $69.60.
#2 When the stock corrects to the lower end of the uptrend channel in the daily chart. This translates to a price between $65.30 and $67.
TP: Our target price is $80 based on the IH&S pattern breakout in the next 4-6 months. However, if the stock shows resistance at $72, book half the profit then.
SL: To limit risk, place a stop loss at $63.70 (when entering at the lower end of uptrend channel) and $64.70 (when entering above IH&S breakout). Note that this stop loss is on a closing basis.
Our target potential upside is nearly 15% to 23% in the next months.
- When entering near $65.30: For a risk of $1.6, our target reward is $14.70. This is a 1:9 risk-reward trade.
- When entering near $69.60: For a risk of $4.9, our target reward is $10.40. This is a 1:2 risk-reward trade.
In other words, this trade offers nearly 2X to 9X more potential upside than downside.
Risks to Consider
The stock may reverse its overall trend if it breaks down with high volume from the lower end of the uptrend channel. The sell-off of the stock could also be triggered in case of any negative news, overall weakness in the market, or any regulatory changes in the sector.
Happy Trading!
Tara
Motley Fool Stock Advisor's average stock pick is up over 350%*, beating the market by an incredible 4-1 margin. Here’s what you get if you join up with us today: Two new stock recommendations each month. A short list of Best Buys Now. Stocks we feel present the most timely buying opportunity, so you know what to focus on today. There's so much more, including a membership-fee-back guarantee. New members can join today for only $99/year.
