

Do I have a deal for you…
If you give me $1,000 today, I promise to give you back $1,840 – an impressive 84% return – in just 30 years.
In fact, you can give me as much money as you’d like. I’ll guarantee you that same 84% return by December 2047.
And don’t worry… You can trust me.
How does that sound? Are you in?
If so, make your check out to the U.S. Treasury Department. The offer comes from the federal government… not me.
Right now, the longest-term (30-year) U.S. government bonds – the ones with the highest interest rates – yield 2.8%. Multiply that by 30 years and you get your 84% return.
That may sound attractive to you. But objectively (compared with history), relatively (compared with stocks), and subjectively (in my opinion), it’s not…
And that lack of attractiveness is a powerful force in the markets. It’s one of the main reasons that stocks continue to rise…
Think about it…
When you buy U.S. Treasurys (or other bonds) and hold them, you earn interest along the way and get your initial investment back at maturity. In other words, if you’re pretty sure you’ll get your investment back, yield is everything.
Over the past 30 years, the average yield on 30-year U.S. Treasurys is about 5.5%. (That’s 96% better than the current 2.8% yield.) At that rate, holding for 30 years would generate a 165% return. (Again, that’s 96% better than what you’ll earn if you take today’s deal.)
You can see the long, steady downtrend in 30-year Treasury yields – along with the long-term average – in the chart below…
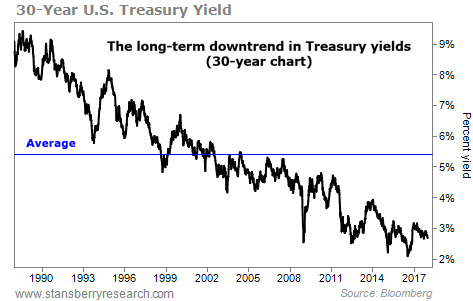
Yields are near all-time lows.
Remember, you want to buy when prices are near all-time lows… not when yields are.
That’s our objective look at bonds.
Now, let’s compare them with stocks (our relative look)…
In stocks, you can earn capital gains as the economy and companies grow. You can earn dividends, too.
Over the past 30 years, the U.S. benchmark S&P 500 Index returned 980%, not including dividends. That’s 8.3% per year. The index’s average dividend yield over that span was about 2.2%.
So if you had bought U.S. stocks at an “average moment” over the past 30 years, and held, you would have made about 10.5% per year. (That’s the 8.3% average return plus the 2.2% average dividend yield.)
Stocks still saw big ups and downs, of course… But we’re thinking long term.
We can’t know how much the economy or companies will grow (or contract) in the future. So to get an idea of what to expect right now, let’s just look at dividend yields, while remembering the possibility of capital gains exists…
Today, the S&P 500 yields about 1.9%. So the long-term average dividend yield (of 2.2%) is about 16% higher than today’s.
Considering the long-term average bond yield is about 96% higher than today’s, that doesn’t seem so bad.
Folks who are making the decision between stocks and bonds today should also be familiar with the “yield spread.” This is simply the difference between the yields on two assets – in this case, 30-year Treasurys and the S&P 500.
The smaller the spread gets, the less attractive bonds are by comparison…
- A 3% yield spread means bonds yield three percentage points more than stocks. So if you buy stocks, you need to earn at least 3% in capital gains to outperform the bonds.
- A 0% spread means bonds and stocks have the same yield. So if you make any capital gains in stocks, you’re doing better than you would in bonds.
- And a negative yield spread means stocks yield more than bonds. So if you buy stocks when the spread is negative, you’re better off owning stocks unless they fall by more than the spread.
As you can see in the chart below, 30-year Treasurys yield only about one percentage point more than the S&P 500 today. This is near all-time lows…
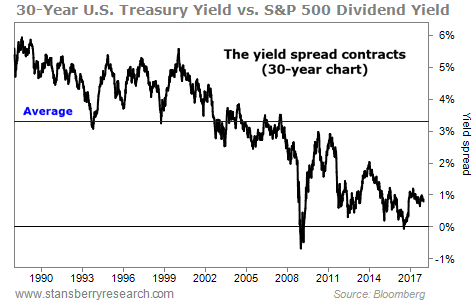
If you think stocks will generate long-term capital gains in excess of 1% a year, you’re better off buying stocks than bonds today.
Now, we’re only using two benchmarks – the 30-year Treasury and the S&P 500 – for these numbers. But the historical levels and trends are similar across the board.
Bonds have low yields. Stocks have reasonable yields and offer a chance at capital gains. And that leads investors to move money out of bonds and into stocks.
This final chart below shows the ratio of the S&P 500 to 30-year Treasurys. (These are prices, not yields.) The ratio just hit a major new high, showing that stocks are far outperforming bonds…
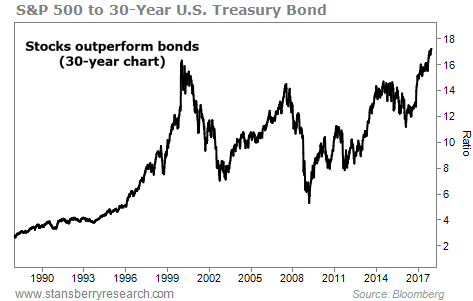
Most folks would look at this chart and say that stocks are expensive relative to bonds. And maybe they are, by some measures…
But when you look at the potential long-term returns in each asset, which one is more attractive?
Do you want a guaranteed 84% in 30 years? Most folks are answering that question with a resounding “No.” So stocks continue to rise. And bonds – at least since last summer – have fallen.
The recent breakout in the stocks-to-bonds ratio is a sign that this trend will likely continue. Trade accordingly.
Good trading,
Ben Morris
[ad#stansberry-ps]
Source: Daily Wealth
