
Two things precede a bear market…
The first is a pullback… The second is a correction.
In trader speak, these are benchmarks for gauging how far a stock market has fallen.
A pullback is often defined as a 5% drop from a recent high. A correction is a 10% drop. And finally, stocks enter a bear market after a plunge of 20% or greater.
You can’t enter a bear market without first seeing a pullback, and then a correction.
Investors are often fearful that these events are around the corner… But based on history, that’s extremely unlikely.
In fact, it’s not likely we’ll see even a pullback over the next month.
Here’s why…
Last month, we saw the benchmark S&P 500 Index fall by more than 1% twice.
But even with these recent declines, market volatility has remained low…
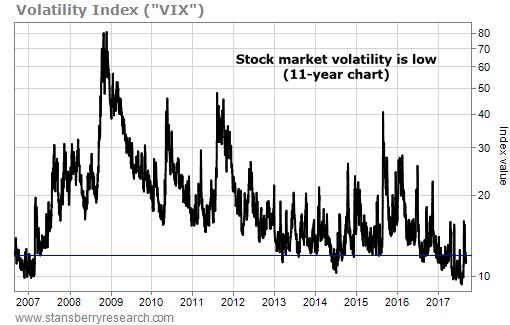
If you’ve ever read about stock market volatility, you’ve probably come across the CBOE Volatility Index (or “VIX”). It’s one of the most widely used financial gauges in the world.
The VIX measures expected volatility in the S&P 500 over the next 30 days. In general, a VIX reading below 20 is considered low, and a VIX above 30 is considered high.
[On Thursday], the VIX closed at 11.22. It has been below 12 just 10% of the time going back to 1991 (as far back as Bloomberg has data). In the 11-year chart below, you can see that this sub-12 area is rare…
 Typically, the VIX rises when stocks drop. So folks often get the idea that the risk of a pullback or correction is higher than normal when the VIX is low.
But that’s not the case.
We recently tested this idea by looking at all of the one-month drawdowns and returns for the S&P 500 since 1991. A “drawdown” is simply the most an asset drops during a given time frame, even if it recovers before the end of that period.
In this first table, you can see what happened in the month following every day the VIX closed below 12. When we ran our test, it had happened 666 times…
 Of the 666 days the VIX closed below 12, the biggest one-month drawdown was 5.9%. And we only saw 11 drawdowns of more than 5%. That’s just 1.7% of the time.
So if you’re expecting an all-out crash over the next month, that’s unlikely. When the VIX closed below 12, as it did yesterday, one-month returns were positive 72% of the time.
Now, let’s compare that with all periods. Below, you’ll see the same table. But this time, it looks at the month following every single day since the start of 1991. First of all, you can see stocks are more volatile…
 For all periods, the median and average drawdowns were 152% and 172% larger, respectively. (There’s some rounding in the tables above.) And interestingly, the median and average one-month returns were 2% and 19% lower, respectively.
In other words, one-month returns tended to be better than “normal” following a VIX reading below 12.
Importantly, during all periods, we saw 5.9% drawdowns about 16% of the time… or more than nine times more likely than when the VIX closed below 12.
For all periods, one-month returns were positive 63% of the time (compared with 72% of the time when the VIX closed below 12).
Across the board, when the VIX has dropped to levels as low as it did yesterday, stocks were likely to be less volatile going forward. And in spite of what a lot of folks think, it’s also much less likely that stocks will be lower one month from today.
To sum this all up, based on history, there’s only a 1.7% chance we’ll see a drop of more than 5% (from yesterday’s closing price) in the S&P 500 over the next month. And we have never seen a correction or a bear market one month after the VIX closes below 12.
With the sharp declines last month, it’s easy to panic… and to think this bull market is coming to its end. But history says otherwise. It’s good to keep this perspective.
Continue to use intelligent asset allocation… And continue to place smart trades… with a bullish bias.
Good trading,
Ben Morris and Drew McConnell
[ad#stansberry-ps]
Source: Daily Wealth
