
The S&P 500 now sports a price-to-earnings ratio of more than 26—a huge number at a time when corporate profits are actually down more than 5% since 2014.
You read that right. Investors appear to be overpaying for falling profits.
[ad#Google Adsense 336×280-IA]Look closer and things seem scarier.
In August 2000, at the height of the dot-com bubble, the S&P 500 had a P/E ratio of 28, just 6% above its current level.
If the stock market continues to perform as it has in the last few months, we could get to that same level by summer.
Then look at volatility.
The CBOE Volatility Index, often called the “fear indicator,” is currently 13 and was below 10 just a few months ago.
That’s its lowest point in history and almost half its historical level.
That means the market is less worried about a correction now than ever before. Yet we’re facing tremendous geopolitical uncertainty, a possible big mix-up of American tax laws and the now-familiar story of stagnant wages and rising inflation.
So why isn’t the market worried?
Beyond First-Level Fears
Falling corporate profits, high valuations and a complacent market make for a scary financial story and sexy headlines the mainstream financial press can use to attract eyeballs. But investors shouldn’t let the whims of a twitchy media influence their decisions.
It’s at times like this that it pays to be a contrarian investor. Because when we take a calm, rational look at the markets, we quickly see that stocks aren’t overbought at all.
In fact, they’re still a bargain.
Granted, the SPDR S&P 500 ETF (SPY) and Vanguard 500 Index Fund (VOO) aren’t as cheap as they were a year ago, when they were 15% below today’s levels, but they’re nowhere near priced to perfection. What’s more, many of these funds’ top holdings are actually significantly undervalued.
The Blue Chips: Some Are Cheap and Some … Not so Much
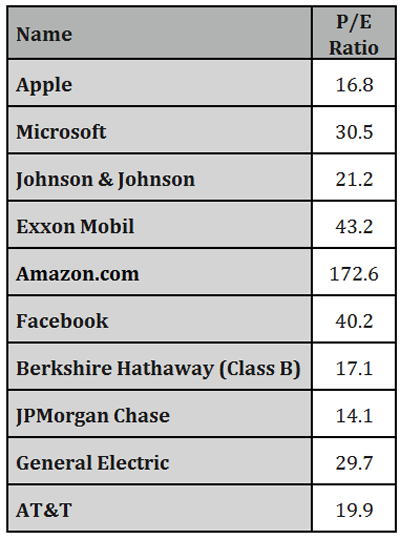
It’s true that Amazon.com (AMZN) has a jaw-dropping P/E of 173, and Exxon Mobil (XOM) is at a less silly, but still worrying, 43, but if we strip these two stocks out, the P/E ratio of the names above drops to 21.5.
This brings us to our first rule in comparing the S&P 500 to history.
1. It’s Not Your Parents’ Market
I’m sure you’ve seen all the historical extrapolations and heard the warnings that the S&P 500 is pricier than it has been throughout its history. But the index used to be full of railroad stocks and cigarette manufacturers in a world where P/E ratios were lower because growth expectations were lower. Amazon’s P/E ratio is monstrous because its earnings-per-share (EPS) growth over the last three years has been, well, monstrous, too:
Eye-Popping Growth
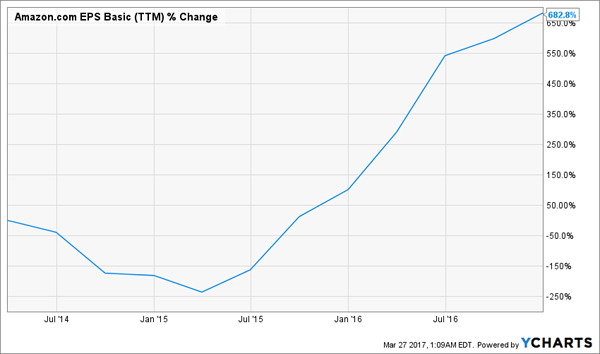
This shows why comparing the S&P 500 to its past will lead you to a false perception of its value today: the index now has a lot more tech companies with high P/E ratios set up by high EPS growth and major expansion opportunities.
2. Energy Skews the Picture
That brings us to the second reason why the S&P 500 looks pricier, especially relative to a few years ago. In March 2014, the index had a P/E ratio of 18.5, and this figure is up over 40% since then. There’s a simple reason: energy.
In the middle of 2014, oil prices plummeted. That chopped energy stocks’ profitability from fat margins to massive losses. Just look at the earnings of Exxon and Chevron (CVX) over the last three years—and remember these are the two biggest energy companies in the S&P 500 by far:
Oil Company Profits Flame Out
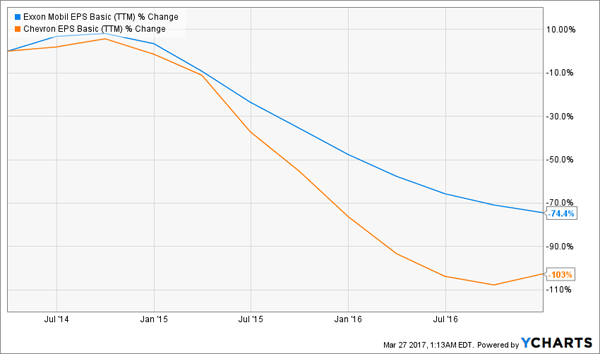
While the prices of these stocks fell too, they didn’t (and indeed couldn’t) fall as much as profitability did, leading to the energy sector skewing the index’s overall P/E ratio.
This, incidentally, is one reason why, as I wrote back on February 21, I prefer active stock-picking over passive investing. It was clear throughout the second half of 2014 that throwing money into energy was a fool’s errand, while the problems in oil and gas created great opportunities in other asset classes, which became oversold.
Similarly, panic is setting in that oil will stay low, despite OPEC’s best efforts to help the commodity. This fear—and the corresponding decline in energy stocks—skews the S&P 500’s overall P/E ratio higher than its recent historical average.
3. Profit Growth Is Accelerating
These are two compelling reasons to disregard the warning of an overvalued market, but my smoking gun is future growth. Corporate profits have been weak in recent years. In fact, earnings have barely moved since the financial crisis, and they remain lower than they were in 2012.
But that’s changing.
Profits are already up 18% from their bottom at the end of 2015, and analysts say they will rise 12% this year from last year. This makes a lot of sense; earnings have been pressured for a decade, and a combination of lower unemployment and pent-up demand suggests there’s room for bottom-line growth.
This means the S&P 500’s forward-looking P/E ratio is actually a more reasonable 23.4.
It gets better. Over the last 20 years, corporate profits have risen by 6% annually. That’s including the dot-com boom and bust, in which the market was flooded by tons of unprofitable companies, and the global financial crisis and the following lean years of massive unemployment, stagnant wages and low corporate investment. Two horrible financial crises, and still 6% annualized growth.
What this means is that the S&P 500’s forward P/E ratio shrinks to less than 20 in the next five years if we assume the index’s price stays flat.
The Stock Market’s Cheap Future

Keep in mind this is an overly pessimistic assumption. I’m assuming that, after the 12% expected earnings growth of 2017, we get earnings of 6% in 2018 and then falling earnings every year thereafter. If we actually get 6% every year, the S&P 500 P/E ratio falls to less than 19.
So are stocks overpriced? Not really, since stocks are a forward-looking financial instrument. They do not price in historical earnings but future earnings. And the future of corporate earnings is bright.
— Michael Foster
Sponsored Link: But that doesn’t solve another problem, especially if you rely on your portfolio for income: right now, SPY pays just a 1.9% dividend yield.
So even if you drop $1 million into the ETF, you’re only getting $19,000 in income! That’s just above the poverty line for a two-person household. And you’re putting yourself in the path of a lot of potential volatility for that “privilege,” too.
Treasuries? At 2.4%, you’re not retiring off them, either!
This “income desert” is precisely why we developed our “8.0% No-Withdrawal Retirement Portfolio.” It pulls together a collection of cash-spinning investments from across the market with one goal: to let you hang it up on just $500,000, with a steady $40,000 income stream headed into your pocket year in and year out.
Here’s a quick look at a few of these income wonders:
- A closed-end fund that pays a 10.1% yield and trades at a 7% discount to net asset value, so it’s got plenty of upside, too!
- A preferred-stock fund paying 8.4% that has little correlation with the overall stock market. This one gives you unbeatable downside protection.
- This dividend machine is as reliable as they come! It’s a real estate investment trust that hands you a rock-solid 8.4% and has hiked its payout for 17 straight quarters!
So don’t load up on stingy blue chips and so-called Dividend Aristocrats when there are far better income plays available. Let me show you the very best of them. Click here to get access to this powerful new portfolio now. You’ll be so glad you did.
Source: Contrarian Outlook
