

Four months ago, Toby Richards got hit on the head with a sledgehammer.
Toby was working on an underground level of a construction site.
Three stories above, one of Toby’s co-workers lost his footing on a scaffold. The man slipped… and let go of his sledgehammer.
[ad#Google Adsense 336×280-IA]The sledgehammer fell 40 feet through a series of small openings in the levels of scaffolding.
And like a guided missile, it struck Toby on the head.
Toby hit the ground.
To the disbelief of his co-workers, Toby stood up, brushed the dirt off his overalls, declared, “I’m OK,” and took six steps forward.
Then he hit the ground again.
Today, thanks to the efforts of a few paramedics, the medical staff at a nearby hospital, and the strong plastic of a mandatory construction-site helmet, Toby is doing just fine.
But his ordeal is a good illustration of what happens after someone gets hit on the head. First, he hits the ground. Then, if he somehow manages to get back up and say, “I’m OK,” there’s still a strong likelihood he’ll hit the ground again.
It’s only after the second collapse that a real recovery begins.
That’s how it works with construction workers. And that’s how it works with most financial assets as well.
Let me explain…
Last week, I mentioned that the market for long-term Treasury bonds – or “T-bonds” – was poised to make a big move. The Bollinger Bands on the chart were pinching together, and it was only a matter of time before T-bonds broke out – one way or the other.
On Friday, Treasury bonds got hit with a sledgehammer. Here’s an updated chart of the iShares 20+ Year Treasury Bond Fund (TLT)…
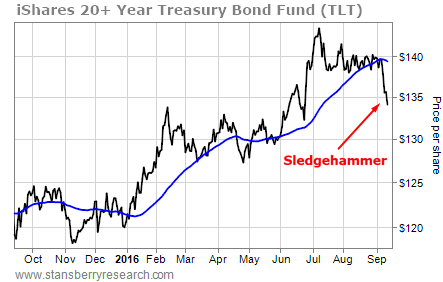
Take a look at the large downside move that occurred when TLT broke to the downside of its recent trading range. That’s a sledgehammer.
TLT is oversold enough now and far enough below its 50-day moving average (DMA) for traders to start looking for a bounce. You can see from the chart that TLT rarely strays more than 3% below its 50-DMA before rallying back up toward the line.
On Tuesday, TLT closed 3.6% below its 50-DMA. So the chart looks ready to bounce back up and declare, “I’m OK.”
So if you shorted TLT when it started breaking down on Friday, now is a good spot at which to cover the trade and take the profit. TLT is oversold and will probably bounce back up toward its 50-DMA.
That’s when we’ll get a second chance to short the T-bond market. Because there’s a very good chance TLT will hit the ground again.
Best regards and good trading,
Jeff Clark
[ad#stansberry-ps]
Source: Growth Stock Wire
