
The recent rally has wiped out one big reason to be bearish.
But it has also created a few new reasons to be cautious.
Let me explain…
Look at this updated chart of the S&P 500…
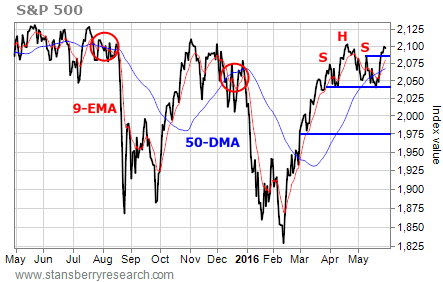
Last week, the S&P 500 closed above the 2,085 high it reached earlier in May. The index has broken its string of “lower highs.” So the “Head and Shoulders” pattern on the chart that I pointed out two weeks ago is no longer valid.
[ad#Google Adsense 336×280-IA]That doesn’t mean it’s time to turn bullish and start throwing money into the market.
As I’ll explain in a moment, there are plenty of other reasons to remain cautious. But the quick breakdown I was looking for toward 1,975 is off the table for the moment.
Instead, the S&P 500 is likely to chop back and forth as the chart forms another pattern from which it can break out. For now, there’s obvious support for the index at 2,040. Resistance is at the April high of about 2,110.
Since we’re approaching the upper end of that trading range, any upside from here is probably limited. And we have several extreme overbought conditions to consider.
For example, last Thursday and Friday, the S&P 500 closed above its upper Bollinger Band. Take a look…
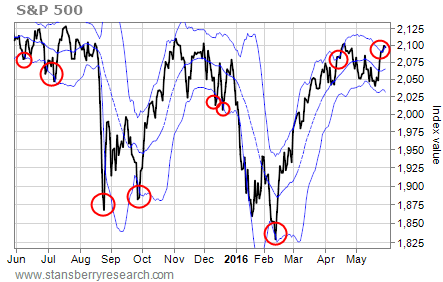
Bollinger Bands measure the most probable trading range for a stock or an index. When a chart pokes outside of its Bollinger Bands, it indicates an extreme move – one that is likely to reverse.
The red circles on the chart mark each time over the past year that the S&P 500 has traded outside of its Bollinger Bands. Each time occurred within days of an important reversal for the index.
Based on this pattern, last week’s close above the upper Bollinger Band means we’re probably close to at least a short-term top for the S&P 500.
The Nasdaq McClellan Oscillator (“NAMO”) also closed above its upper Bollinger Band last week…
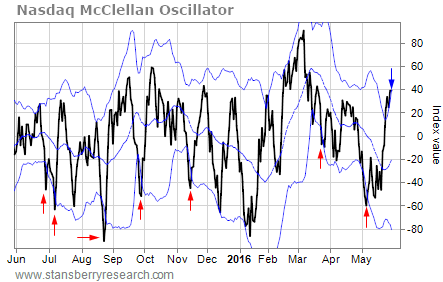
Four weeks ago, the NAMO was oversold. It was trading below its lower Bollinger Band. That condition helped to support the recent rally in the broad stock market.
Now, the NAMO is doing the opposite. It’s trading above its upper Bollinger Band. That indicates an overbought condition. So we need to be on the lookout for a possible reversal in the broad stock market – starting soon.
The S&P 500 has powered higher, and it has invalidated the bearish Head and Shoulders topping pattern. At the same time, though, several other indicators have turned bearish – at least for the short term.
Traders should stay cautious.
Best regards and good trading,
Jeff Clark
[ad#stansberry-ps]
Source: Growth Stock Wire
