
Last week, I warned that the selling pressure in the stock market wasn’t over yet.
Any short-term bounce was likely to set up an ominous “Head and Shoulders Top” pattern on the chart of the S&P 500.
And a breakdown from that pattern could kick off a swift and significant decline.
And the short-term bounce came, just as I predicted. The Head and Shoulders pattern is now in place. The stock market is ready to break down…
Take a look at this updated chart of the S&P 500…
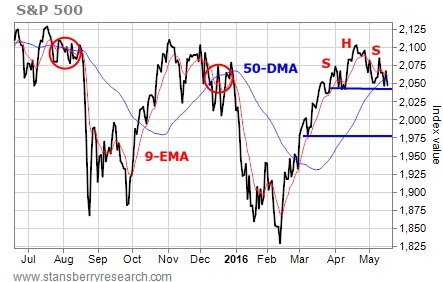
You can see the Head and Shoulders pattern on the chart. Yesterday, the index closed below its 50-day moving average (DMA).
[ad#Google Adsense 336×280-IA]Now, it’s precariously perched just above the neckline of the pattern.
If the S&P 500 closes below the neckline at about 2,038… the target for this breakdown is all the way down at 1,975.
That’s about 3.5% below Tuesday’s close of 2,047.
Another thing that traders should watch is the relationship between the S&P 500’s nine-day exponential moving average (EMA) and its 50-DMA.
Right now, the nine-day EMA is still barely holding above the 50-DMA. That’s a bullish alignment for the short term.
So the bulls still have a small chance that the market may pull out of this pattern.
But if the nine-day EMA crosses below the 50-DMA, that “bearish cross” should increase selling pressure.
Just look at the two previous bearish crosses on the chart. When the nine-day EMA crossed below the 50-DMA last July, stocks held on for a little while. But the market eventually broke down and the S&P 500 dropped 13% over the next month.
We got the same sort of action last December. Stocks held on for a couple of weeks following the bearish cross early in the month. But once the decline started, the S&P 500 plunged 16% before hitting its bottom in early February.
The setup today has similar potential. Be prepared.
Best regards and good trading,
Jeff Clark
[ad#stansberry-ps]
Source: Growth Stock Wire
