
Stocks have fallen for two straight weeks.
The S&P 500 topped out at 2,111 intraday on April 20. Last Friday, the index dropped as low as 2,039. That’s a loss of more than 3% in just two and a half weeks… and it was enough to wipe out all of the gains in the stock market this year.
But at the market’s low on Friday, several technical indicators – like the McClellan Oscillators for both the New York Stock Exchange and the Nasdaq – had stretched into oversold territory. And many individual sectors were forming bullish falling-wedge patterns on their intraday charts.
[ad#Google Adsense 336×280-IA]The market was gearing up for a bounce.
Sure enough, the S&P 500 found support at the 2,040 level.
It reversed and closed Friday at 2,057, up 18 points off the lows.
The bounce continued [Monday] with the index adding another seven points in early trading.
But the decline isn’t over yet…
An ominous pattern is forming on the daily chart of the S&P 500 – which signals even lower prices in the weeks ahead.
Take a look…
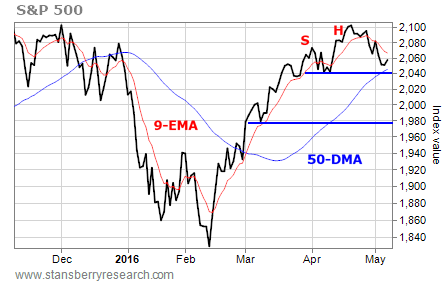 The S&P 500 may be forming a “Head and Shoulders Topping” pattern. This is a bearish formation that often signals the reversal of a bullish trend to a bearish one.
The left shoulder formed in late March when the index reached 2,075 and then dropped back down to its previous low at 2,040. The subsequent rally to 2,105 formed the head of the pattern. And the decline over the past two weeks has pushed the S&P 500 back down toward its previous low at 2,040, which is critical support and the “neckline” for this pattern.
Any short-term rally that pops the index back up toward 2,075 will form the right shoulder. Then any subsequent drop to below the 2,040 neckline will complete the pattern and likely lead to a sharp decline.
Since the head of the pattern is at 2,105 and the neckline is at 2,040, we have the potential for a 65-point move once the neckline is broken. If you subtract 65 from 2,040, you get my target price of 1,975 for this expected decline.
That’s a 4% drop from Friday’s close price. It lines up with the March low in the S&P 500. And it coincides with the 1,973 level that was such a magnet for the index for all of 2015.
Of course, there are no guarantees that the market will follow this script. But of all of the possible outcomes, I think this is the most likely.
For the very short term – meaning the next two or three days – traders should be prepared for a rally. Then, once this short-term bounce runs its course, get ready for another push lower. Like I said, this decline isn’t over yet.
Best regards and good trading,
Jeff Clark
[ad#stansberry-ps]
Source: Growth Stock Wire
