
While I am somewhat of a small fish in the big financial publishing ocean, I always enjoy when I see my theories or observations repeated elsewhere.
[ad#Google Adsense 336×280-IA]During a couple of recent earnings conference calls, I heard Wall Street analysts question management about unique points I have been making in my articles.
Now, one of the income stocks I follow and recommend is using an analysis technique that I use frequently to better explain how they fund those big dividends.
Maybe they did not get the idea from one of my presentations, but each piece of information like this can help income investors make better investment decisions.
 When analyzing high-yield stocks, traditional stock analysis metrics like earnings per share (EPS), payout ratios, and price to earnings (P/E) ratios do not provide an accurate picture of whether a company with a high dividend yield can support and grow the dividend payment.
When I make presentations at investor conferences and discuss my strategy with my newsletter subscribers, I dig deeply into more advanced free cash flow analysis.
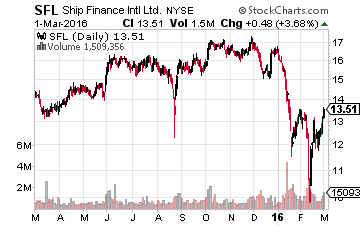
One of the companies that I use to illustrate cash flow is Ship Finance International Limited (NYSE:SFL). Ship Finance pays a large and steady dividend, but the company’s quarterly earnings per share has varied a lot, both higher and lower than the quarterly per share dividend payment.
With each quarterly earnings release presentation, Ship Finance includes a trailing twelve month cash flow waterfall style chart. I use this chart to show cash flow coverage of the dividend. For example, here is the chart from a year ago.
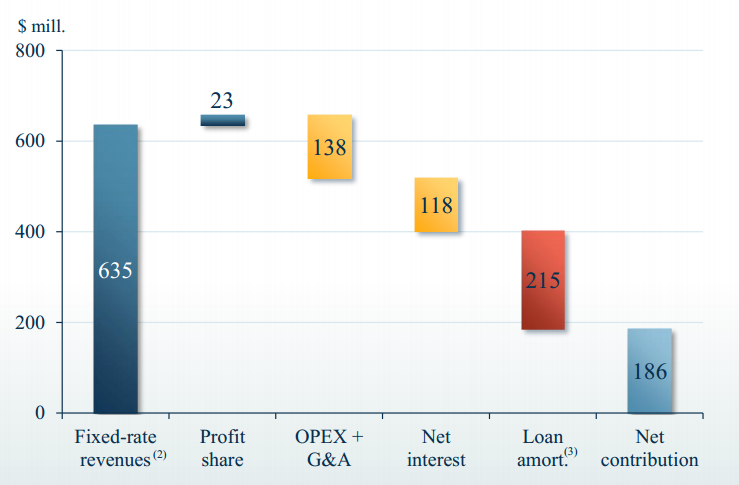
The rightmost blue bar shows that over the previous 12 months the company generated $186 million of unencumbered, free cash flow. I would then tell my audience that the company had paid out about $160 million in dividends over the same period. So at that point in time, Ship Finance generated enough cash flow to cover the dividend by a factor of 1.16 times.
Over the last year, Ship Finance has been growing its free cash flow even as the SFL share price dropped by 20%. Here is the cash flow waterfall chart from the just released 2015 fourth quarter earnings presentation:
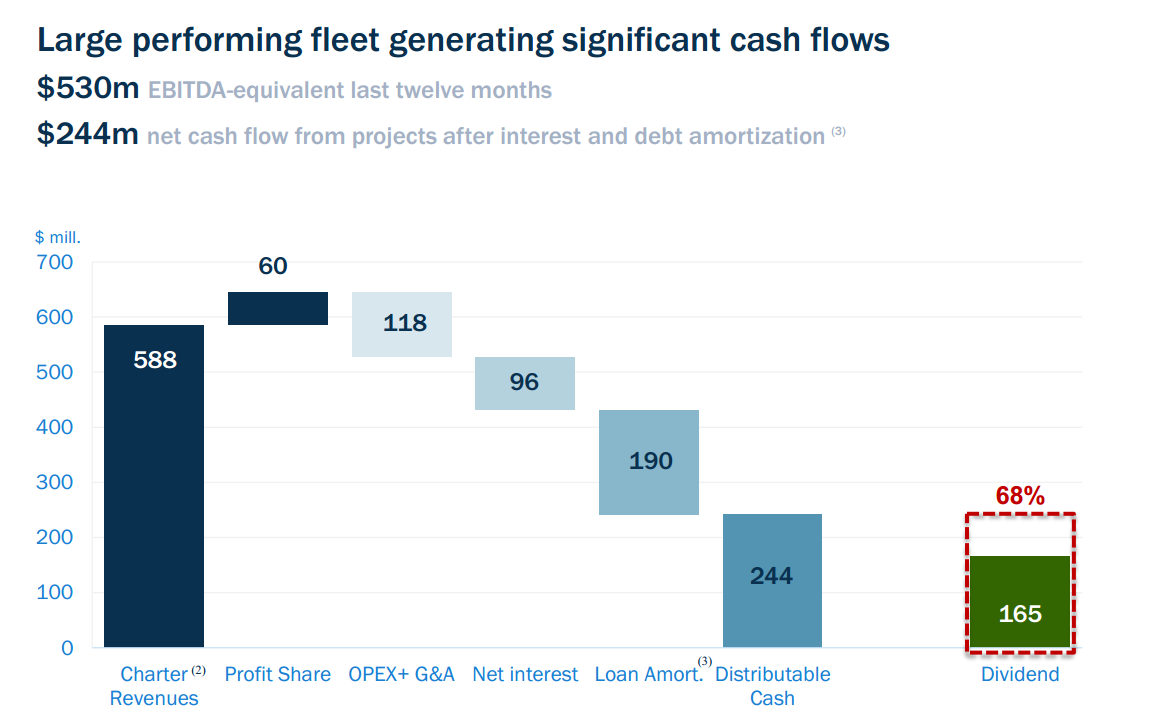
The far right bar shows that the Ship Finance management team is now following my analysis technique by graphically illustrating the cash flow coverage in relation to the dividend payment amounts. Sweet!
As you can see, over the last 12 months cash flow coverage has grown to 1.48 times the dividend amount. The company has also increased the quarterly dividend three times by a total of 7% in the last year. This is a fine and highly recommended high-yield stock. These are strong and surprising cash flow and dividend numbers on a stock that yields 13.8%.
Cash flow per share analysis can help you dig out more stocks like Ship Finance. These are companies with a high yield combined with strong and growing cash flow coverage of the dividend payments.
Finding stable companies that regularly increase their dividends is the strategy Warren Buffett uses himself to produce superior results, no matter if the market moves up or down in the shorter term. The combination of a high yield and regular dividend growth is what has given him consistent gains throughout his decades-long investing career.
— Tim Plaehn
[ad#ia-tim]
Source: Investors Alley
Position: Long SFL
